-
Cisco MDS 9000 Family Fabric Manager Configuration Guide, Release 3.x
-
Index
-
New and Changed Information
-
Preface
- Getting Started
- Installation and Switch Management
- Switch Configuration
-
Fabric Configuration
-
Configuring and Managing VSANs
-
SAN Device Virtualization
-
Creating Dynamic VSANs
-
Configuring Inter-VSAN Routing
-
Distributing Device Alias Services
-
Configuring and Managing Zones
-
Configuring Fibre Channel Routing Services and Protocols
-
Dense Wavelength Division Multiplexing
-
Managing FLOGI, Name Server, FDMI, and RSCN Databases
-
Discovering SCSI Targets
-
Configuring FICON
-
Advanced Features and Concepts
-
-
Security
-
Configuring FIPS
-
Configuring Users and Common Roles
-
Configuring SNMP
-
Configuring RADIUS and TACACS+
-
Configuring IPv4 Access Control Lists
-
Configuring Certificate Authorities and Digital Certificates
-
Configuring IPsec Network Security
-
Configuring FC-SP and DHCHAP
-
Configuring Port Security
-
Configuring Fabric Binding
-
- IP Services
- Intelligent Storage Services
- Network and Switch Monitoring
- Traffic Management
- Troubleshooting
-
Launching Fabric Manager in Cisco SAN-OS Releases Prior to 3.2(1)
-
Cisco Fabric Manager Unsupported Feature List
-
Interface Nonoperational Reason Codes
-
Managing Cisco FabricWare
-
Configuration Limits for Cisco MDS SAN-OS Release 3.1(x) and 3.2(x)
-
 Feedback
Table Of Contents
SAN Discovery and Topology Mapping
Saving a Customized Topology Map Layout
Using Enclosures with Fabric Manager Topology Maps
Using the Inventory Tab from Fabric Manager Web Server
Viewing Logs from Device Manager
Event Information in Fabric Manager Web Server Reports
Network Monitoring
The primary purpose of Fabric Manager is to manage the network. In particular, SAN discovery and network monitoring are two of its key network management capabilities.
This chapter contains the following sections:
•
SAN Discovery and Topology Mapping
SAN Discovery and Topology Mapping
Fabric Manager provides extensive SAN discovery, topology mapping, and information viewing capabilities. Fabric Manager collects information on the fabric topology through SNMP queries to the switches connected to it. Fabric Manager recreates a fabric topology, presents it in a customizable map, and provides inventory and configuration information in multiple viewing options.
Device Discovery
Once Fabric Manager is invoked, a SAN discovery process begins. Using information polled from a seed Cisco MDS 9000 Family switch, including Name Server registrations, Fibre Channel Generic Services (FC-GS), Fabric Shortest Path First (FSPF), and SCSI-3, Fabric Manager automatically discovers all devices and interconnects on one or more fabrics. All available switches, host bus adapters (HBAs), and storage devices are discovered. The Cisco MDS 9000 Family switches use Fabric-Device Management Interface (FMDI) to retrieve HBA model, serial number and firmware version, and host operating-system type and version discovery without host agents. Fabric Manager gathers this information through SNMP queries to each switch. The device information discovered includes device names, software revision levels, vendor, ISLs, PortChannels, and VSANs.
Topology Mapping
Fabric Manager is built upon a topology representation of the fabric. Fabric Manager provides an accurate view of multiple fabrics in a single window by displaying topology maps based on device discovery information. You can modify the topology map icon layout with an easy-to-use, drag-and-drop interface. The topology map visualizes device interconnections, highlights configuration information such as zones, VSANs, and ISLs exceeding utilization thresholds. The topology map also provides a visual context for launching command-line interface (CLI) sessions, configuring PortChannels, and opening device managers.
Using the Topology Map
The Fabric Manager topology map can be customized to provide a view into the fabric that varies from showing all switches, end devices, and links, to showing only the core switches with single bold lines for any multiple links between switches. Use the icons along the left side of the topology map to control these views or right-click anywhere in the topology map to access the map controls.
You can zoom in or out on the topology map to see an overview of the SAN or focus on an area of importance. You can also open an overview window that shows the entire fabric. From this window, you can right-click and draw a box around the area you want to view in the main topology map view.
Another way to limit the scope of the topology display is to select a fabric or VSAN from the Logical Domains pane. The topology map displays only that fabric or VSAN.
Moving the mouse pointer over a link or switch provides a simple summary of that SAN component, along with a status indication. Right-clicking on the component brings up a pop-up menu. You can view the component in detail or access configuration or test features for that component.
Double-click a link to bring link status and configuration information to the information pane. Double-click a switch to bring up Device Manager for that switch.
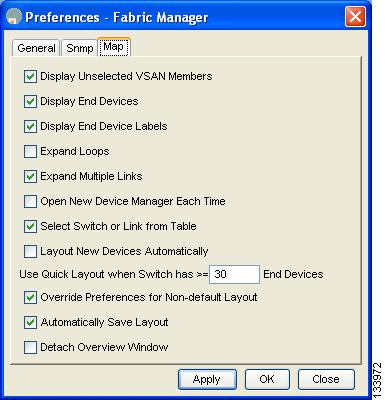
Saving a Customized Topology Map Layout
Changes made to the topology map can be saved so that the customized view is available any time you open the Fabric Manager Client for that fabric.
To save the customized layout using Fabric Manager, follow these steps:
Step 1
Step 2
Figure 59-1 Fabric Manager Preferences
Step 3
Using Enclosures with Fabric Manager Topology Maps
Because not all devices are capable of responding to FC-GS-3 requests, different ports of a single server or storage subsystem may be displayed as individual end devices on the topology map. See the "Modifying the Device Grouping" section on page 5-20 to group these ports into a single enclosure for Fabric Manager.
Clicking Alias->Enclosure displays hosts and storage elements in the Information pane. This is a shortcut to naming enclosures. To use this shortcut, highlight each row in the host or storage table that you want grouped in an enclosure then click Alias -> Enclosure. This automatically sets the enclosure names of each selected row with the first token of the alias.
Mapping Multiple Fabrics
To log into multiple fabrics, the same username and password must be used. The information for both fabrics is displayed, with no need to select a seed switch. To see details of a fabric, click the tab for that fabric at the bottom of the Fabric pane, or double-click the fabric's cloud icon.
To continuously manage a fabric using Fabric Manager, follow the instructions in the "Managing a Fabric Manager Server Fabric" section on page 3-3.
Inventory Management
The Information pane in Fabric Manager shows inventory, configuration, and status information for all switches, links, and hosts in the fabric. Inventory management includes vendor name and model, and software or firmware versions. Select a fabric or VSAN from the Logical Domains pane, and then select the Summary tab in the Information pane to get a count of the number of VSANS, switches, hosts, and storage elements in the fabric. See the "Fabric Manager Client Quick Tour" section on page 5-6 for more information on the Fabric Manager user interface.
Using the Inventory Tab from Fabric Manager Web Server
If you have configured Fabric Manager Web Server, you can launch this application and access the Inventory tab to see a summary of the fabrics managed by the Fabric Manager Server. The Inventory tab shows an inventory of the selected SAN, fabric, or switch.
See Chapter 7, "Fabric Manager Web Server" for more information on how to configure and use Fabric Manager Web Server.
To view system messages remotely using Fabric Manager Web Server, follow these steps:
Step 1
Step 2
Viewing Logs from Device Manager
You can view system messages from Device Manager if Device Manager is running from the same workstation as the Fabric Manager Server. Choose Logs > Events > current to view the system messages on Device Manager. The columns in the events table are sortable. In addition, you can use the Find button to locate text within the table.
You can view switch-resident logs even if you have not set up your local syslog server or your local PC is not in the switch's syslog server list. Due to memory constraints, these logs will wrap when they reach a certain size. The switch syslog has two logs: an NVRAM log that holds a limited number of critical and greater messages and a nonpersistent log that contains notice or greater severity messages. Hardware messages are part of these logs.
Health and Event Monitoring
Fabric Manager works with the Cisco MDS 9000 Family switches to show the health and status of the fabric and switches. Information about the fabric and its components is gathered from multiple sources, including Online System Health Management, Call Home, system messages, and SNMP notifications. This information is then made available from multiple menus on Fabric Manager or Device Manager.
Fabric Manager Events Tab
The Fabric Manager Events tab, available from the topology window, displays the events Fabric Manager received from sources within the fabric. These sources include SNMP events, RMON events, system messages, and system health messages. The Events tab shows a table of events, including the event name, the source and time of the event, a severity level, and a description of the event. The table is sortable by any of these column headings.
Event Information in Fabric Manager Web Server Reports
The Fabric Manager web server client displays collections of information gathered by the Performance Manager. This information includes events sent to the Fabric Manager Server from the fabric. To open these reports, choose Performance Manager > Reports. This opens the web client in a web browser and displays a summary of all fabrics monitored by the Fabric Manager Server. Choose a fabric and then click the Events tab to see a summary or detailed report of the events that have occurred in the selected fabric. The summary view shows how many switches, ISLs, hosts, or storage elements are down on the fabric and how many warnings have been logged for that SAN entity. The detailed view shows a list of all events that have been logged from the fabric and can be filtered by severity, time period, or type.
Events in Device Manager
Device Manager displays the events when you choose Logs > Events. Device Manager can display the current list of events or an older list of events that has been stored on the Fabric Manager host. The event table shows details on each event, including time, source, severity, and a brief description of the event.