-
Cisco MDS 9000 Family Fabric Manager Configuration Guide, Release 2.x
-
New and Changed Information
-
Index
-
Preface
- Part 1 - Fabric Manager Applications
- Part 2 - Cisco MDS SAN-OS Installation and Configuration Files
-
Part 3 - Switch Configuration
-
Cisco Fabric Services
-
VSAN Configuration
-
Dynamic VSAN Configuration
-
Zone Configuration
-
Inter-VSAN Routing Configuration
-
PortChannel Configuration
-
Interface Configuration
-
FCIP Configuration
-
Configuring the SAN Extension Tuner
-
iSCSI configuration
-
FICON Configuration
-
Configuring Intelligent Storage Services
-
Additional Configuration
-
- Part 4 - Security Configuration
- Part 5 - Network and Performance Monitoring
- Part 6 - Troubleshooting
-
GUI/CLI Usage Chart
-
Interface Nonoperational Reason Codes
-
Managing Cisco FabricWare
-
 Feedback
Table Of Contents
Using Cisco Traffic Analyzer with Performance Manager
Understanding Cisco Traffic Analyzer
Using Cisco Traffic Analyzer with Fabric Manager Web Services
Installing and Launching Cisco Traffic Analyzer
Configuring Cisco Traffic Analyzer
Discovering Cisco Traffic Analyzer from Fabric Manager Web Services
Accessing Cisco Traffic Analyzer from Fabric Manager Web Services
Configuring Cisco Traffic Analyzer for Fabric Manager Releases Prior to 2.1(2)
Cisco Traffic Analyzer
Cisco Traffic Analyzer is a version of network top (ntop) software that is modified to support Fibre Channel and SCSI.
This chapter contains the following sections:
•
Using Cisco Traffic Analyzer with Performance Manager
•
•
Using Cisco Traffic Analyzer with Performance Manager
Performance Manager works in conjunction with Cisco Traffic Analyzer to monitor and manage the traffic on your fabric. Using Cisco Traffic Analyzer with Performance Manager requires the following components:
•
•
•
Figure 8-1 shows how Performance Manager works with Cisco Traffic Analyzer to monitor traffic on your fabric.
Figure 8-1 Overview of Performance Manager Working with Cisco Traffic Analyzer
Understanding SPAN
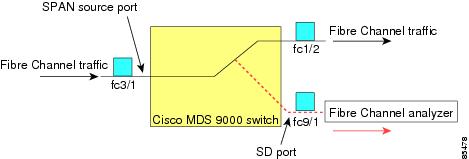
The SPAN feature is specific to switches in the Cisco MDS 9000 Family. It monitors network traffic though a Fibre Channel interface. Traffic through any Fibre Channel interface can be replicated to a special port called the SPAN destination port (SD port). Any Fibre Channel port in a switch can be configured as an SD port. Once an interface is in SD port mode, it cannot be used for normal data traffic. You can attach a Fibre Channel analyzer to the SD port to monitor SPAN traffic (see the "Configuring World Wide Names" section on page 24-3).
SD ports do not receive frames, they merely transmit a copy of the SPAN source traffic. The SPAN feature is nonintrusive and does not affect switching of network traffic for any SPAN source ports (see Figure 8-2).
Figure 8-2 SPAN Transmission
For information on configuring SPAN, refer to the Cisco MDS 9000 Family Configuration Guide.
Understanding the PAA-2
The PAA-2 enables effective, low-cost analysis of Fibre Channel traffic. The device is a standalone Fibre Channel-to-Ethernet adapter, designed primarily to analyze SPAN traffic from a Fibre Channel port on a Cisco MDS 9000 Family switch. The main function of the Port Analyzer Adapter 2 is to encapsulate Fibre Channel frames into Ethernet frames. This allows low-cost analysis of Fibre Channel traffic while leveraging the existing Ethernet infrastructure.
The PAA-2 allows you to examine Fibre Channel frames of various sizes. Fibre Channel frames from Layers 2, 3, and 4 may be examined without network disruption.
Understanding Cisco Traffic Analyzer
Performance Manager collects Fibre Channel level performance statistics using SNMP to access counters on Cisco MDS 9000 Family switches. To view detailed SCSI I/O statistics, you need to look at the data on an SD port with the help of Cisco Traffic Analyzer, which uses the Cisco Port Analyzer Adapter 2 (PAA-2).
Cisco Traffic Analyzer provides real-time analysis of SPAN traffic or analysis of captured traffic through a Web browser user interface. Traffic encapsulated by one or more Port Analyzer Adapter 2 products can be analyzed concurrently with a single workstation running Cisco Traffic Analyzer, which is based on ntop, a public domain software enhanced by Cisco for Fibre Channel traffic analysis.
Round-trip response times, SCSI I/Os per second, SCSI read or traffic throughput and frame counts, SCSI session status, and management task information are monitored. Additional statistics are also available on Fibre Channel frame sizes and network management protocols.
For seamless performance analysis and troubleshooting, Cisco Traffic Analyzer can be launched in-context from Fabric Manager. Port World Wide Name (pWWN), Fibre Channel ID (FC ID), FC alias, and VSAN names are passed to Cisco Traffic Analyzer.
Cisco Traffic Analyzer must be downloaded and installed separately from the following website:
http://www.cisco.com/public/sw-center/sw-stornet.shtml.
Cisco Traffic Analyzer software is available under the Port Analyzer Adapter link. See the "Installing and Launching Cisco Traffic Analyzer" section.
Caution
Note
Using Cisco Traffic Analyzer with Fabric Manager Web Services
You can run Cisco Traffic Analyzer from within Fabric Manager Web Services in Fabric Manager Release 2.1(2) or later.
Note
To use Cisco Traffic Analyzer from Fabric Manager Web Services, follow these steps:
Step 1
Step 2
Step 3
Step 4
Installing and Launching Cisco Traffic Analyzer
You must launch Cisco Traffic Analyzer before you can discover and access it from Fabric Manager Web Services. At a minimum , you need to provide the directory where Cisco Traffic Analyzer stores its database, including the RRD files that it creates for trending.
Note
Verify that you have sufficient space in the partition where the Cisco Traffic Analyzer database is stored.
To install and launch Cisco Traffic Analyzer on a UNIX workstation, follow these steps:
Step 1
http://cisco.com/cgi-bin/tablebuild.pl/mds-fm.Step 2
http://www.ntop.org.Step 3
ntop -P database_directoryWhere database_directory is the directory where you want Cisco Traffic Analyzer to save its database files (for example, /var/ntop).
Note
ntop.exe /c -P tmp -w port_number where port_number is equal to the port that you want Cisco Traffic Analyzer to use. Set the port number to 3001 if you want to use SSL. Fabric Manager Web Services can only detect Cisco Traffic Analyzer if you use port 3000 (the default port).Step 4
Step 5
Step 6
Step 7
Step 8
Caution
Under Windows, you can use the \tmp directory provided with the distribution to store the Cisco Traffic Analyzer database.
To install and launch Cisco Traffic Analyzer on a Windows workstation, follow these steps:
Step 1
http://cisco.com/cgi-bin/tablebuild.pl/mds-fm.Step 2
Step 3
Note
http://winpcap.polito.it/.Step 4
Step 5
a.
b.
c.
d.
Note
Note
ntop.exe /c -P tmp -w port_number, where port_number is equal to the port that you want Cisco Traffic Analyzer to use. Set the port number to 3001 if you want to use SSL. Fabric Manager Web Services can only detect Cisco Traffic Analyzer if you use port 3000 (the default port).e.
Note
Step 6
Step 7
Step 8
Step 9
Step 10
Step 11
Step 12
Tip
—Linux platforms use the shell script path. The ntop output is sent to the syslog file (/var/log/messages by default).
—Windows platforms use the batch file. The ntop output is sent to a file located in the same directory as the one from which ntop is launched.You can remove Cisco Traffic Analyzer as a service by entering the following command at the Windows command prompt:
ntop.exe /rConfiguring Cisco Traffic Analyzer
At a minimum, you must configure Cisco Traffic Analyzer to recognize the IP address and switch port of the switch that Cisco Traffic Analyzer connects to through the PAA-2.
To initially configure Cisco Traffic Analyzer, follow these steps:
Step 1
Step 2
Note
Step 3
Step 4
Discovering Cisco Traffic Analyzer from Fabric Manager Web Services
Fabric Manager Release 2.1(2) or later supports discovering instances of Cisco Traffic Analyzer and SPAN ports configured within your fabric.
Fabric Manager Web Services supports the following Traffic Analyzer integration features:
•
•
•
•
•
To discover instances of Traffic Analyzer running in your fabric from Fabric Manager Web Services, follow these steps:
Step 1
Step 2
Step 3
Step 4
Note
Accessing Cisco Traffic Analyzer from Fabric Manager Web Services
To access an instance of Cisco Traffic Analyzer running in your fabric from Fabric Manager Web Services, follow these steps
Step 1
Step 2
If you did not configure the switch and switch port information in Cisco Traffic Analyzer, you can still discover it, but Fabric Manager Web Services cannot associate that instance of Cisco Traffic Analyzer with any fabric. Cisco Traffic Analyzer also cannot inherit the device alias information from Fabric Manager Web Services.
Fabric Manager Web Services updates Cisco Traffic Analyzer with the latest device alias information every five minutes.
Configuring Cisco Traffic Analyzer for Fabric Manager Releases Prior to 2.1(2)
To configure Performance Manager to work with Cisco Traffic Analyzer for Fabric Manager releases prior to Release 2.1(2), follow these steps:
Step 1
•
•
•
Step 2
a.
b.
http://ip_address:port_numberwhere ip_address is the address of the management workstation on which you have installed the Cisco Traffic Analyzer, and :port_number is the port that is used by Cisco Traffic Analyzer (the default is :3000).
c.
d.
e.
D:<directory\ntop.batwhere D: is the drive letter for the disk drive where Cisco Traffic Analyzer is installed, and
directory is the directory containing the ntop.bat file.
f.
Step 3
Step 4
a.
b.
c.
http://<ip address>/<directory>where:
<ip address> is the address of the management workstation on which you have installed Cisco Traffic Analyzer, and <directory> is the path to the directory where Cisco Traffic Analyzer is installed.
d.
e.
f.
Note
Step 5
Note
Note
For information on viewing and interpreting your Cisco Traffic Analyzer data, refer to the Cisco MDS 9000 Family Port Analyzer Adapter 2 Installation and Configuration Note.For performance drill-down, Fabric Manager Server can launch Cisco Traffic Analyzer in-context from the Performance Manager graphs. The aliases associated with hosts, storage devices, and VSANs are passed to Cisco Traffic Analyzer to provide consistent, easy identification.