
-
Cisco MDS 9000 Family Fabric Manager User Guide, Release 1.1(1a) (Updated: Sep 25, 2003)
-
Index
-
Preface
-
Getting Started with Cisco Fabric Manager
-
Using Cisco Fabric Manager and Device Manager
-
Managing Zones and Zone Sets
-
Managing VSANs
-
Managing Administrator Access
-
Managing Software and Configuration Files
-
Managing Interfaces
-
Managing Events and Alarms
-
Managing the System and Components
-
Managing Fibre Channel Routing and FSPF
-
Managing IP Storage Services
-
Managing Advanced Features
-
Table Of Contents
Using Cisco Fabric Manager and Device Manager
Menu Bar, Toolbars, and Message Bar
Analyzing Switch Device Health
Analyzing End-to-End Connectivity
Analyzing Switch Fabric Configuration
Analyzing the Results of Merging Zones
Using Traceroute and Other Troubleshooting Tools
Setting Fabric Manager Preferences
Viewing Reports in Fabric Manager
Launching Device Manager from Fabric Manager
Comparing Device Manager to Fabric Manager
Setting Device Manager Preferences
Using Cisco Fabric Manager and Device Manager
Table 2-1 summarizes the tasks that you can perform using Fabric Manager and Device Manager. In general, you can perform tasks using Fabric Manager for multiple devices. Device Manager is more convenient to use when you are working with a single switch.
To learn more about the Fabric Manager and Device Manager user interfaces, refer to these topics:
•
Comparing Device Manager to Fabric Manager
To learn about the general procedures you can perform with Fabric Manager, refer to these topics:
•
Analyzing Switch Device Health
•
Analyzing End-to-End Connectivity
•
Analyzing Switch Fabric Configuration
•
Analyzing the Results of Merging Zones
•
Using Traceroute and Other Troubleshooting Tools
•
Setting Fabric Manager Preferences
•
Viewing Reports in Fabric Manager
To learn about the general procedures you can perform with Device Manager, refer to these topics:
•
Setting Device Manager Preferences
Using Fabric Manager
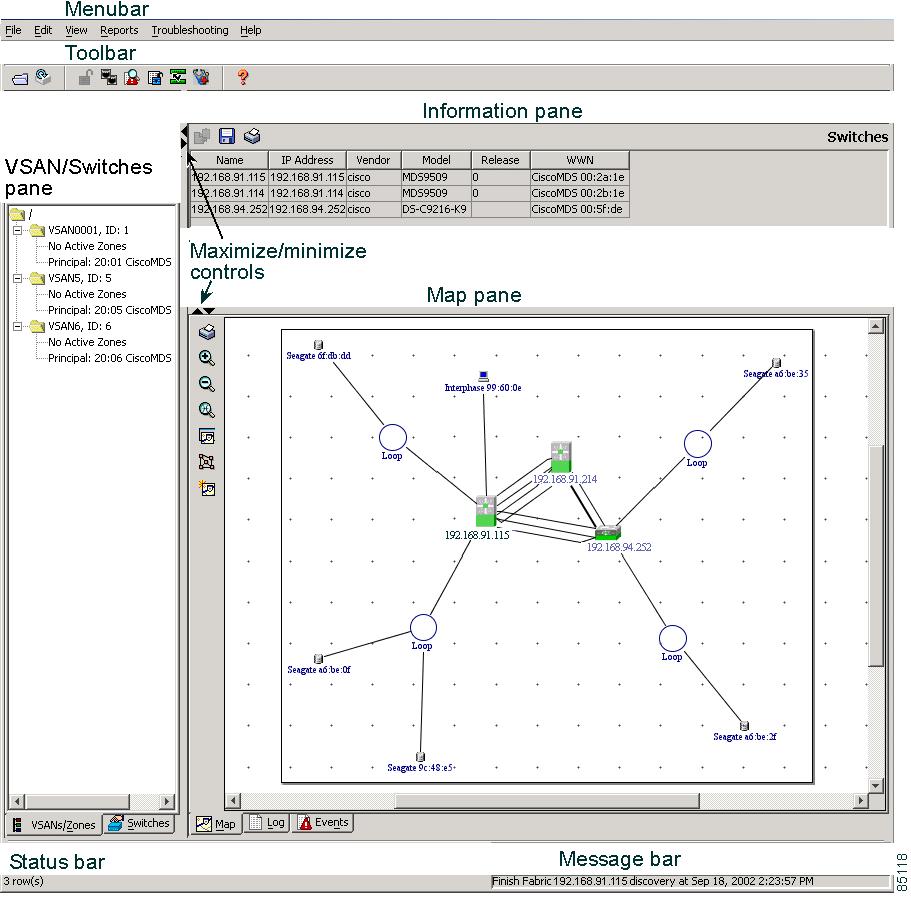
The Fabric Manager displays a view of your network fabric, including Cisco 9000 or third-party switches and end devices. To launch the Fabric Manager from your desktop, double-click the Fabric Manager icon and follow the instructions described in the "Launching Views" section. Figure 2-1 shows the Fabric Manager main window.
Note
Changes made using Fabric Manager are applied to the running configuration of the switches you are managing and the changes may not be saved when the switch restarts. After you make a change to the configuration or perform an operation (such as activating zones), the system prompts you to save your changes before you exit.
Figure 2-1 Fabric Manager Main Window
The menu bar at the top of the Fabric Manager window provides access to options, that are organized by menus. The toolbar provides icons that duplicate the most commonly used options on the File, Tools, and Help menus.
The main window has a menu bar, toolbar, message bar, status bar, and three panes:
•
VSAN/Switch pane—Displays a tree of configured VSANs and zones on the VSANs/Zones tab and a menu tree of available configuration tasks on the Switch tab.
•
Information pane—Displays information about whatever option is selected in the menu tree.
•
Map pane—Displays a map of the network fabric, including switches, hosts, and storage. It also provides tabs for displaying log and event data.
You can resize each pane by dragging the boundaries between each region or by clicking the Minimize or Maximize controls. (See Figure 2-1.)
Menu Bar, Toolbars, and Message Bar
The menu bar at the top of the Fabric Manager window provides options for managing and troubleshooting the current fabric and for controlling the display of information on the Map pane. The menu bar provides the following menus:
•
File—Open a new fabric, rediscover the current fabric, locate switches, set preferences, print the map, and clear or export the Map pane log.
•
Edit—Manage zones, zonesets, and various elements on the Fabric Manager map.
•
View—Change the appearance of the map (these options are duplicated on the Map pane toolbar).
•
Reports—Display summary reports, as described in the "Viewing Reports in Fabric Manager" section.
•
Troubleshooting—Verify and troubleshoot connectivity and configuration, as described in the "Analyzing Switch Fabric Configuration" section.
•
Help—Display on-line help topics for specific dialog boxes in the Information pane.
The Fabric Manager main toolbar provides buttons for accessing the most commonly used menu bar options. The Map pane toolbar provides buttons for managing the appearance of the map. The Information pane toolbar provides buttons for editing and managing the Information pane.
The message bar shows the last entry displayed by the discovery process, and the possible error message. It displays a dialog stating that something has changed in the fabric and a new discovery is needed. The status bar shows both short-term, transient messages (such as the number of rows displayed in the table), and long-term discovery issues.
Logical/Physical Pane
Use the Logical tab on the Logical/Physical pane to manage VSANs and zones in the currently discovered fabric. For information about managing VSANs see "Managing VSANs."
To manage zones, right-click one of the folders in the VSAN tree and click Edit Local Zone Database from the pop-up menu. You see the Edit Local Zone Database dialog box. For information about managing zones and zone sets, see "Managing Zones and Zone Sets."
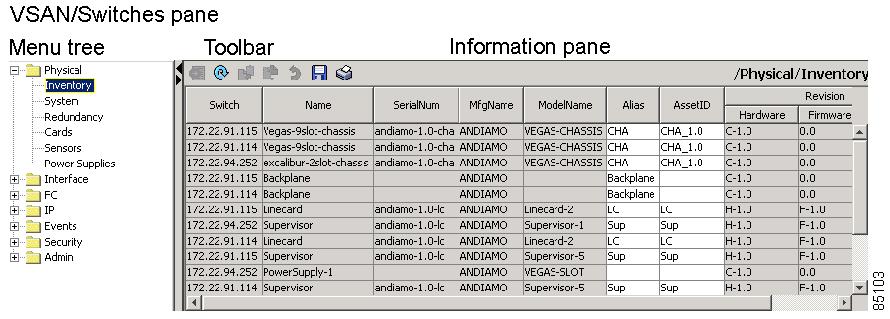
Use the Physical tab on the Logical/Physical pane to display a menu tree of the options available for managing the switches in the currently discovered fabric. You see the menu tree shown in Figure 2-2.
Figure 2-2 Menu Tree and Dialog Box
To select an option, click a folder to display the options available and then click the option. You see the dialog box for the selected option in the Information pane. The menu tree provides the following main folders:
•
Physical—View and configure hardware components.
•
Interface—View, monitor, and configure ports and PortChannel interfaces.
•
FC—View and configure Fibre Channel network configurations.
•
IP—View and configure TCP/IP (management) network configurations.
•
Events—View and configure events, alarms, thresholds, notifications, and informs.
•
Security—View and configure SNMP and CLI security.
•
Admin—Download software images; copy and save configuration files.
Information Pane
The Information pane displays tables or other information associated with the option selected from the menu tree. The Information pane toolbar provides buttons for performing one or more of the following operations:
•
Apply Changes—Apply configuration changes.
•
Refresh Values—Refresh table values.
•
Copy...Ctrl+C — Copy data from one row to another.
•
Paste...Ctrl +V—Paste the data from one row to another.
•
Undo Changes...Ctrl-Z—Undo the most recent change.
•
Export—Export and save information to a tab-delimited file.
•
Print Table —Print the contents of the Information pane.
Note
After making changes you must save the configuration or the changes will be lost when the device is restarted.
Note
The buttons that appear on the toolbar vary according to the option you select. They are activated or deactivated (grayed) according to the field or other object that you select in the Information pane.
Map Pane
The Map pane shows the graphical representation of your fabric. Table 2-2 explains the graphics you may see displayed, depending on which devices you have in your fabric.
Table 2-2 Fabric Manager Graphics
There are three tabs on the bottom of the Map pane:
•
Map—Displays a graphical view of the network fabric with switches, hosts, and storage subsystems.
•
Log—Displays messages that describe system operations, such as fabric discovery.
•
Events—Displays information about the SNMP traps received by the management station.
When viewing large fabrics in the Map pane, it is helpful to keep the following tips in mind to make the display cleaner.
•
Turn off end device labels
•
Collapse loops
•
Collapse expanded multiple links (collapsed multiple links are shown as very thick single lines)
•
Dim or hide portions of your fabric by VSAN
When you right-click an icon, you see a pop-up menu with options that vary depending on the type of icon selected. The various options available for different objects include the following:
•
Open an instance of Device Manager for the selected switch.
•
Open a CLI session for the selected switch.
•
Copy the display name of the selected object.
•
Execute a ping or traceroute command for the device.
•
Show or hide end devices.
•
Create or delete an enclosure.
•
Set the VSAN ID for an edge port (link).
•
Set the trunking mode for an ISL.
•
Create or add to a PortChannel for selected ISLs.
The Map pane has its own toolbar with options for saving, printing, and changing the appearance of the map. When you right-click on the map, a pop-up menu appears that provides options (duplicated on the toolbar) for changing the appearance of the map.
Note
When a VSAN, zone, or zone member is selected in the VSAN tree, the map highlighting changes to identify the selected objects. To remove this highlighting, click the Clear Highlight button on the Map pane toolbar or choose Clear Highlight from the pop-up menu.
Locating Other Switches
The Locate Switches option uses SNMPv2 and discovers devices responding to SNMP requests with the read-only community string public. To enable your Cisco MDS 9000 Family switches to respond to SNMPv2 requests, see "Managing Administrator Access."
To locate switches that are not included in the currently discovered fabric, follow these steps:
Step 1
Choose File > Locate Switches from the Fabric Manager main window.
You see the Locate Switches dialog box.
Step 2
Enter a range of specific addresses belonging to a specific subnet which limit the research for the switches. To look for a Cisco MDS 9000 switch belonging to subnet 192.168.199.0, use the following string:
192.168.100.[1-254]
Multiple ranges can be specified, separated by commas. For example, to look for all the devices in the two subnets 192.168.199.0 and 192.169.100.0, use the following string:
192.168.100.[1-254], 192.169.100.[1-254]
Step 3
Enter the appropriate read community string in the Read Community field.
The default value for this string is "public."
Step 4
Click Display Cisco MDS 9000 Only to display only the Cisco MDS 9000 Family switches in your network fabric.
Step 5
Click Search to discover switches and devices in your network fabric. You see the results of the discovery in the Locate Switches window.
Note
The number in the lower left corner of the screen increments as the device locator attempts to discover the devices in your network fabric. When the discovery process is complete, the number indicates the number of rows displayed.
Note
You can access the field descriptions for the windows or dialog boxes in this procedure in the Reference section of the Fabric Manager or Device Manager help systems.
Modifying Device Grouping
Because of not all the devices are capable of responding to FC-GS3 requests, different ports of a single server or storage subsystem may be displayed as individual end devices on the Fabric Manager map. To group end devices in a single enclosure in order to have them represented by a single icon on the map, follow these steps:
Step 1
Select Storage from the Fabric Manager's menu tree in the Physical tab.
The end devices are displayed in the Information pane.
Step 2
Clink on the Name field for one of the devices you want to be in the enclosure.
Step 3
Enter a name to identify the new enclosure's icon on the Fabric Manager Map pane.
Step 4
Enter the IP address of the device in the IP Address field (optional).
Step 5
Click once on the Name field for that device.
Step 6
Press Ctrl-C to copy that name.
Step 7
Clink on the Name field for another of the devices you want to be in the enclosure.
Click twice if there is no name in the Name field; click three times if there is a name already in the Name field.
Step 8
Press Ctrl-V to paste the name into the Name field for that device.
Step 9
Repeat steps 7 and 8 for each device you want to add to the enclosure.
Note
To remove devices from an enclosure, click three times on the name of the device and press Delete. To remove an enclosure, repeat this step for each device in the enclosure. To change an existing enclosure, delete the enclosure and create a new one.
Managing Discovered Switches
To manage the discovered switches, follow these steps:
Step 1
Choose File > Open Switch Fabric from the Fabric Manager menu bar.
Step 2
Enter the IP address of a switch in the Device Name field on the Open dialog box.
Step 3
Enter your user name and password in the User Name and Auth Password fields.
If the SNMPv3 Privacy feature is implemented, enter the encryption password as well.
Step 4
Check the SNMPv3 check box to select SNMP version 3.
Step 5
Click Open.
Note
You can access the field descriptions for the windows or dialog boxes in this procedure in the Reference section of the Fabric Manager or Device Manager help systems.
Analyzing Switch Device Health
The Switch Health option lets you determine the status of the components of a specific switch. To use the Switch Health option, follow these steps:
Step 1
Click Switch Health from the Fabric Manager Tools menu.
The Switch Health Analysis window is displayed.
Step 2
Click Start to identify any problems that may currently be affecting the selected switch.
The Switch Health Analysis window displays any problems affecting the selected switches.
Step 3
Fix these problems.
Step 4
Click Clear to remove the contents of the Switch Health Analysis window.
Step 5
Click Close to close the window.
Note
You can access the field descriptions for the windows or dialog boxes in this procedure in the Reference section of the Fabric Manager or Device Manager help systems.
Analyzing End-to-End Connectivity
You can use the End to End Connectivity option to determine connectivity and routes among devices with the switch fabric. The connectivity tool checks to see that every pair of end devices can talk to each other, using a Ping test and by determining if they are in the same VSAN or in the same active zone. This option uses versions of the ping and traceroute commands modified for Fibre Channel networks.
To use this option, follow these steps:
Step 1
Choose Tools > End to End Connectivity from the Fabric Manager menu bar.
The End to End Connectivity window is displayed.
Step 2
Select the VSAN in which you want to verify connectivity from the VSAN dropdown list.
Step 3
Identify any latency issues in the network fabric by clicking the option Report average latencies greater than and entering the number of microseconds.
Step 4
Click Ensure that members can communicate to perform a Fibre Channel ping between the selected end points.
Step 5
Identify the number of packets, the size of each packet, and the timeout in milliseconds.
Step 6
Analyze the redundant paths between endpoints by clicking Ensure that redundant paths exist between members.
Step 7
Click Analyze.
The End to End Connectivity Analysis window displays the selected end points with the switch to which each is attached, and the source and target ports used to connect it.
The output shows all the requests which have failed. The possible descriptions are:
•
Ignoring empty zone—No requests are issued for this zone.
•
Ignoring zone with single member—No requests are issued for this zone.
•
Source/Target are unknown—No nameserver entries exist for the ports or we have not discovered the port during discovery.
•
Both devices are on the same switch.
•
No paths exist between the two devices.
•
VSAN does not have an active zone set and the default zone is denied.
•
Average time ... micro secs—The latency value was more than the threshold supplied.
Step 8
Click Clear to remove the contents of the window.
Step 9
Click Close to close the window.
Note
You can access the field descriptions for the windows or dialog boxes in this procedure in the Reference section of the Fabric Manager or Device Manager help systems.
Analyzing Switch Fabric Configuration
The Fabric Configuration option lets you analyze the configuration of a switch by comparing the current configuration to a specific switch or to a policy file. You can save a switch configuration to a file and then compare all switches against the configuration in the file.
To use the Fabric Configuration option to analyze the configuration of a switch, follow these steps:
Step 1
Click Fabric Configuration from the Fabric Manager Tools menu.
The Fabric Configuration window is displayed.
Step 2
Choose if you want to compare the selected switch to another switch or to a Policy File.
•
If you are making a switch comparison, click Switch and then click the drop-down arrow to see a list of switches.
•
If you are making a policy comparison, click Policy File. Then the button to the right of this option to browse your file system and select a policy file (*.XML).
Step 3
Click Rules to set the rules to apply when running the Fabric Configuration Analysis tool.
The Rules window is displayed.
Step 4
Change the default rules as required and click OK.
Step 5
Click Compare.
The system analyzes the configuration and displays issues that arise as a result of the comparison.
Step 6
Click to place a checkmark in the Resolve column for the issues you want to resolve.
Step 7
Resolve them by selecting the Resolve Issues option.
Step 8
Click Clear to remove the contents of the window.
Step 9
Click Close to close the window.
Note
You can access the field descriptions for the windows or dialog boxes in this procedure in the Reference section of the Fabric Manager or Device Manager help systems.
Creating a Policy Profile
You use a policy file to define the rules to be applied when running the Fabric Configuration Analysis tool. When you create a policy file, the system saves the rules selected for the selected switch.
To create a policy file, follow these steps:
Step 1
Choose Tools > Fabric Configuration from the Fabric Manager menu bar.
Step 2
Click Policy File and enter a name for the policy in the field provided.
Step 3
Click Create Policy and confirm the operation when prompted.
Note
You can access the field descriptions for the windows or dialog boxes in this procedure in the Reference section of the Fabric Manager or Device Manager help systems.
Analyzing the Results of Merging Zones
You can use the Zone Merge option on the Fabric Manager Tools menu to determine if two connected switches have compatible zone configurations.
To use the Zone Merge option, follow these steps:
Step 1
Choose Zone Merge from the Fabric Manager Tools menu.
The Zone Merge Analysis window is displayed.
Step 2
Select a switch from each pull-down list.
Step 3
Identify the VSAN for which you want to perform the zone merge analysis.
Step 4
Click Analyze.
The Zone Merge Analysis window displays any inconsistencies between the zone configuration of the two selected switches.
Step 5
Click Clear to remove the contents of the window.
Step 6
Click Close to close the window.
Note
You can access the field descriptions for the windows or dialog boxes in this procedure in the Reference section of the Fabric Manager or Device Manager help systems.
Using Traceroute and Other Troubleshooting Tools
You can use the following options on the Tools menu to verify connectivity to a selected object or to open other management tools:
•
Traceroute—Verify connectivity between two end devices that are currently selected on the Map pane.
•
Device Manager— Launch the Device Manager for the switch selected on the Map pane.
•
Command Line Interface—Open a Telnet or SSH session for the switch selected on the Map pane.
To use the Traceroute option to verify connectivity, follow these steps:
Step 1
Select two or more endpoints on the Fabric Manager map.
Step 2
Click Traceroute from the Tools menu, or right-click one of the endpoints and click Trace Route from the pop-up menu.
The Traceroute window is displayed.
Step 3
Change the timeout value if the default (10 seconds) is too short or too long.
Step 4
Click Start.
The results of the Traceroute operation appear in the Results box.
Note
You can access the field descriptions for the windows or dialog boxes in this procedure in the Reference section of the Fabric Manager or Device Manager help systems.
Setting Fabric Manager Preferences
To set your preferences for the behavior of the Fabric Manager, choose File > Preferences from the Fabric Manager menu bar. The Preferences dialog box is displayed.
This dialog box has the following four tabs, which let you set your preferences for different components of the application:
•
General
•
SNMP
•
Discovery
•
Map
Viewing Reports in Fabric Manager
The Fabric Manager provides a series of reports, showing various information in tabular form. When you select one of these options, you see the available information in tabular form in the Information pane of the Fabric Manager main window. Table 2-3 describes the reports provided by each option.
Using Device Manager
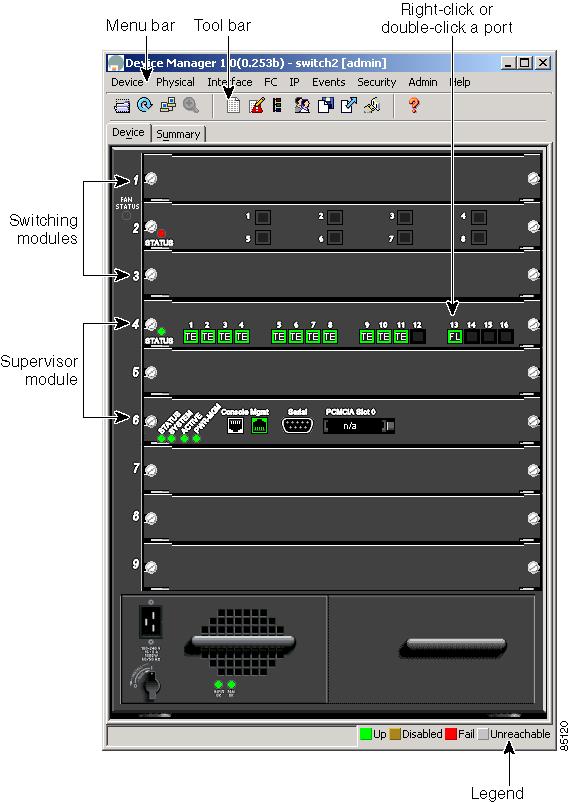
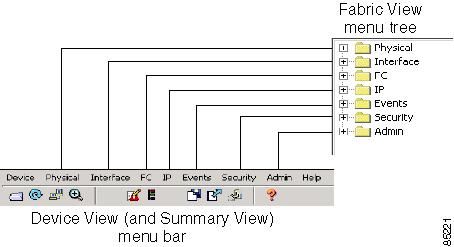
Device Manager provides a physical representation of your switch chassis, with the modules, ports, power supplies, and fan assemblies (Figure 2-3). The menu bar at the top of the Device Manager window provides access to options, organized into menus that correspond to the menu tree in Fabric Manager (Figure 2-5).
The legend at the bottom right of the Device Manager indicates port status, as follows:
•
Green—The port is up.
•
Brown—The port is administratively down.
•
Red—The port is down or has failed.
•
Gray—The port is unreachable.
Launching Device Manager from Fabric Manager
Device Manager gives a graphic representation of a Cisco MDS 9000 Family switch, including the installed switching modules, the supervisor modules, the power supplies, and the status of each port within each module.
To launch the Device Manager from your desktop, double-click the Device Manager icon and follow the instructions described in the "Launching Views" section.
To launch Device Manager from Fabric Manager, right-click the switch you want to manage on the Fabric Manager map and click Device Manager from the pop-up menu that appears. The Device Manager main window is shown in Figure 2-3.
Device Manager can also be started by double-clicking on a switch in the Fabric Manager topology view.
Figure 2-3 Device Manager, Device Tab
Using Summary View
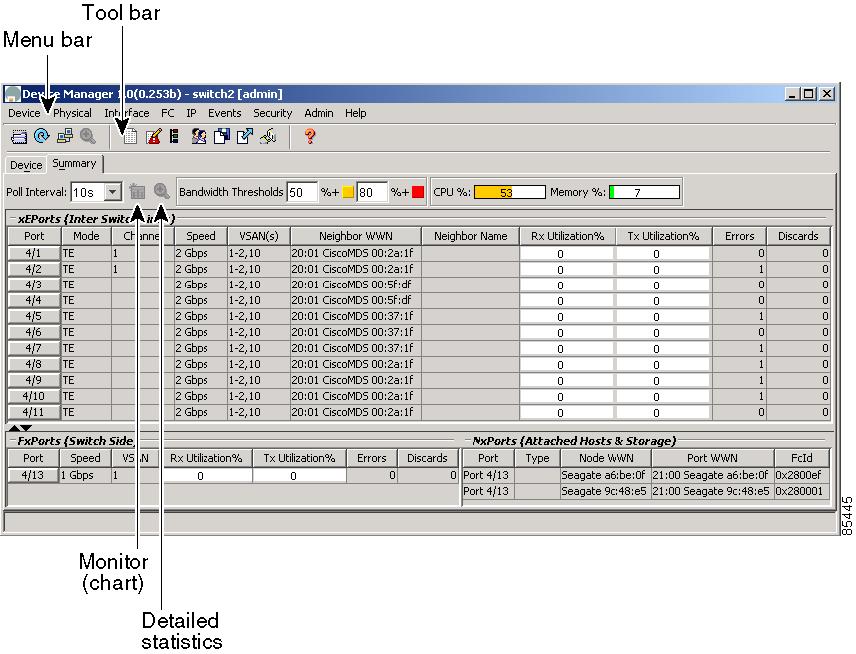
Click the Summary tab on the Device Manager main window to see a summary of xEPorts, FxPorts, and NxPorts on a single switch. Figure 2-4 shows the Summary View.
Figure 2-4 Summary View
The Summary View displays attributes for a single switch, such as port speed, link utilization, and other traffic statistics. It has the same menu bar and toolbar buttons as the Device View.
To monitor traffic for selected objects, click the Monitor icon. To display detailed statistics for selected objects, click the Detailed Statistics icon.
The Summary View provides the same menus and options that are available from the Device View.
Note
You can access the field descriptions for the windows or dialog boxes in this procedure in the Reference section of the Device Manager help system.
Comparing Device Manager to Fabric Manager
As shown in Figure 2-5, the menu bar at the top of the Device Manager contains the same menus as the Fabric Manager menu tree.
Figure 2-5 Device Manager Menu Bar Compared to the Fabric Manager Menu Tree
For information about the options provided by these menus, see the "Logical/Physical Pane" section. The Device menu, which is unique to the Device View and Summary View, provides the following options:
•
Open—Open the Device Manager for a different switch.
•
Open Last—Open the Device Manager for the most recently managed switch.
•
Preferences—Set management preferences for controlling the behavior and appearance of the Device Manager.
•
Refresh—Update the current display.
•
Message Log—Display messages regarding the current operation of the Device Manager application.
•
Command Line Interface—Open a Telnet/SSH session with the current switch.
•
Exit—Close the Device Manager application.
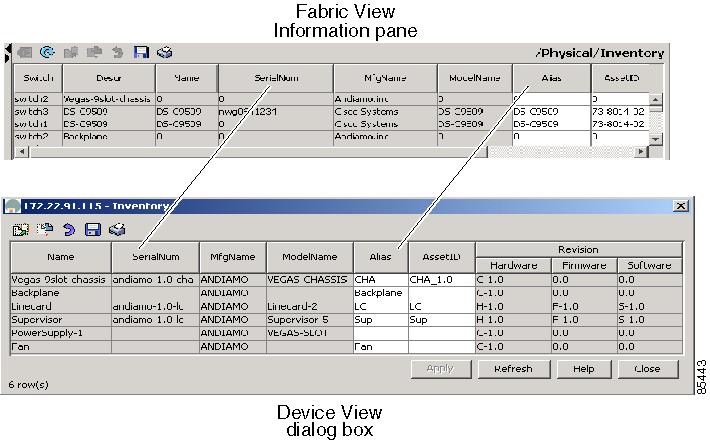
As shown in Figure 2-6, the tables in the Fabric Manager correspond to the dialog boxes that appear in Device Manager. However, the Fabric Manager tables show values for multiple switches and so the first column identifies the specific switch. The Device Manager dialog box shows values for a single switch, while the Fabric Manager shows the same values for one or more switches.
Figure 2-6 Device Manager Dialog Box Compared to Fabric Manager
The toolbar on the Device Manager dialog box provides the same options as the toolbar on the Information pane in Fabric Manager, as summarized here:
•
Create—Insert a new row into a table (if applicable).
•
Delete Row—Delete the selected row from a table (if applicable).
•
Copy...Ctrl+C — Copy data from one row to another.
•
Paste...Ctrl +V—Paste the data from one row to another.
•
Apply Changes—Apply configuration changes.
Note
After making changes you must save the configuration the changes will be lost when the device is restarted.
•
Refresh Values—Refresh table values.
•
Reset Changes...Ctrl-Z—Undo the most recent change.
•
Print table...— Print the contents of the Information pane.
Tip
You can copy values from one cell in a table to the rest of the column. Copy the value to the clipboard, hold down the shift key while pressing the down arrow key (or click on the bottom cell in the column). Then paste the value to all the selected cells and click Apply.
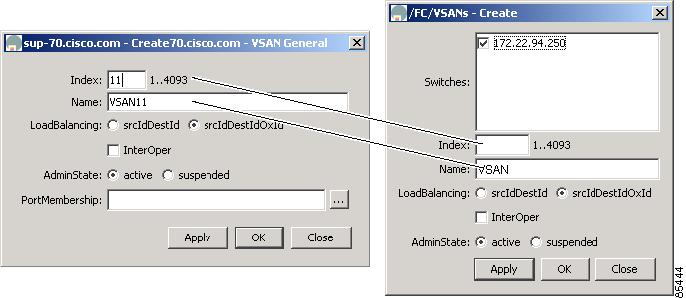
When you click the Create button, you see a dialog box that lets you enter the values required for the specific table. Figure 2-7 shows dialog boxes for creating a new VSAN. As you can see the fields and options are the same from both views, but the appearance of the window may vary slightly. For instance, the dialog box from Fabric Manager may have an option for selecting a specific switch, while the dialog box from Device Manager may have additional port-level detail.
Figure 2-7 Create Dialog Boxes in Fabric Manager and Device Manager
Managing Ports
Tip
You can select multiple ports in Device Manager and apply options to all the selected ports at one time. Either select the ports by clicking the mouse and dragging it around them, or hold down the Control key and click on each port.
To enable or disable a port, right-click the port and click Enable or Disable from the pop-up menu. To enable or disable multiple ports, drag the mouse to select the ports and then right-click the selected ports. Then click Enable or Disable from the pop-up menu.
To manage trunking on one or more ports, right-click the ports and click Configure. On the dialog box that appears, in the Trunk column, right-click the current value and click nonTrunk, trunk, or auto from the pull-down list.
To create PortChannels using Device Manager, click PortChannels from the Interface menu. For detailed instructions, see the "Managing PortChannel Interfaces" section. You can also use Fabric Manager to conveniently create a PortChannel.
Note
To create a PortChannel, all the ports on both ends of the link must have the same port speed, trunking type, and administrative state.
Setting Device Manager Preferences
To set your preferences for the behavior of the Device Manager application, choose Preferences from the Device menu.
Note
You can access the field descriptions for the windows or dialog boxes in this procedure in the Reference section of the Device Manager help system.

 Feedback
