IDS Event Viewer Introduction
Available Languages
Table Of Contents
Accessing the IDS Device Manager
Configuring Refresh Cycle Settings
Configuring Data Archival Settings
Configuring Application Settings
Specifying Web Browser Application Location
Specifying Ethereal Application Location
Specifying NSDB Folder Location
Changing the Auto Refresh View Setting
Introduction to Tables and Graphs
Viewing Events in the Realtime Dashboard
Configuring the Realtime Dashboard Settings
IDS Event Viewer Introduction
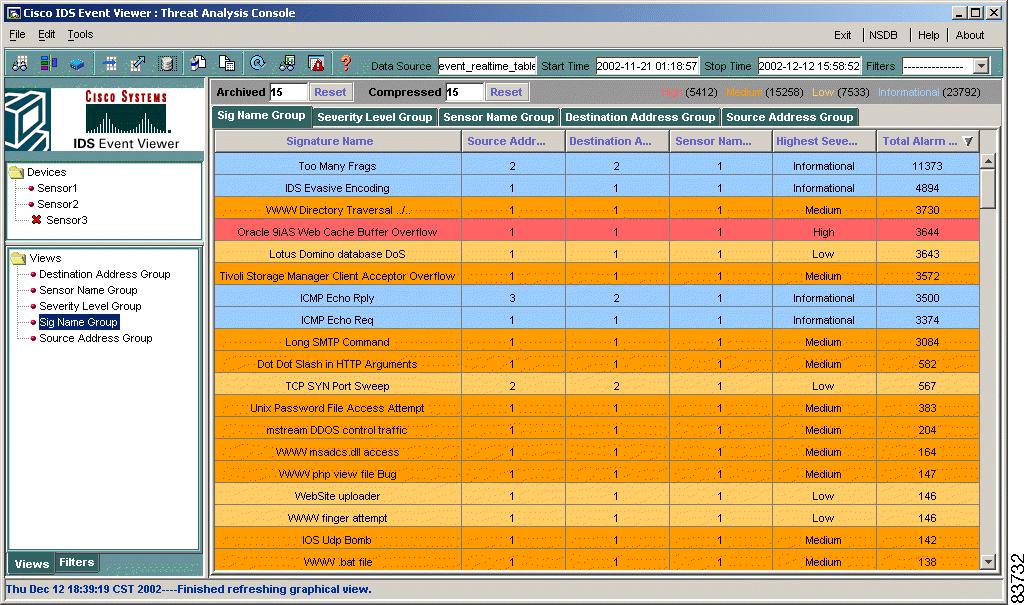
IDS Event Viewer is a Java-based application that enables you to view and manage alarms for up to five sensors. With IDS Event Viewer you can connect to and view alarms in real time or in imported log files. You can configure filters and views to help you manage the alarms. You can also import and export event data for further analysis. IDS Event Viewer also provides access to the Network Security Database (NSDB) for signature descriptions.
Figure 6-1 IDS Event Viewer
System Requirements
IDS Event Viewer can be installed on the following platforms (English version only):
•
Windows NT 4 Service Pack 6.
•
IDS Event Viewer installs and uses the following support applications:
•
•
IDS Event Viewer can be installed on a system that meets or exceeds the following minimum hardware requirements:
•
•
•
Working with IDS Event Viewer
IDS Event Viewer enables you to view and manage alarm feeds from up to five sensors. The following task flow outlines the high-level tasks for configuring and working with IDS Event Viewer.
Step 1

Warning
For more information, see the following references:
1.
2.
Step 2
For more information, see the following references:
3.
Step 3
For more information, see the following references:
Step 4
For more information, see the following references:
1.
2.
3.
4.
5.
6.
Step 5
For more information, see the following references:
Step 6
For more information, see Database Administration
Installing IDS Event Viewer
The following procedure assumes that you have downloaded the IDS Event Viewer executable file to the appropriate host.
Warning
Before You Begin
You must be logged in to the host as a user with administrative privileges to install IDS Event Viewer.
To install IDS Event Viewer, follow these steps:
Step 1
The Welcome panel of the IDS Event Viewer setup program appears.
Step 2
The Select Destination Location panel appears.
Step 3
The Select Program Manager Group panel appears.
Step 4
The Start Installation panel appears.
Step 5
The Installing panel appears.
Step 6
The Installation Complete panel appears.
Step 7
The Install popup window appears.
Step 8
Uninstalling IDS Event Viewer
You cannot upgrade from version 3.1 to version 4.0. Instead, you must uninstall 3.1 before installing version 4.0.
To uninstall IDS Event Viewer, follow these steps:
Step 1
The Select Uninstall Method panel appears.
Step 2
The Perform Uninstall panel appears.
Step 3
If you are uninstalling 3.1, the uninstallation program does not remove the paths that were created when 3.1 was installed. To complete the uninstallation of 3.1, you must manually remove the following paths from the Windows system PATH variable:
•
•
•
•
•
The Cisco IDS Event Viewer and MySQL services are stopped and removed along with the entire Cisco IDS Event Viewer directory.
Starting IDS Event Viewer

Tip
To start IDS Event Viewer, follow these steps:
Step 1
Step 2
Specifying Devices to Monitor
IDS Event Viewer enables you to view alarms for up to five sensors at a time. To specify which five sensors IDS Event Viewer should monitor, you have to add each sensor to the Devices folder. You can later change the properties associated with a device or delete a device from IDS Event Viewer. This section includes the following procedures:
Adding a Device
To add a sensor to the IDS Event Viewer Devices folder, follow these steps:
Step 1
The Device Properties panel appears.
Figure 6-2 Device Properties
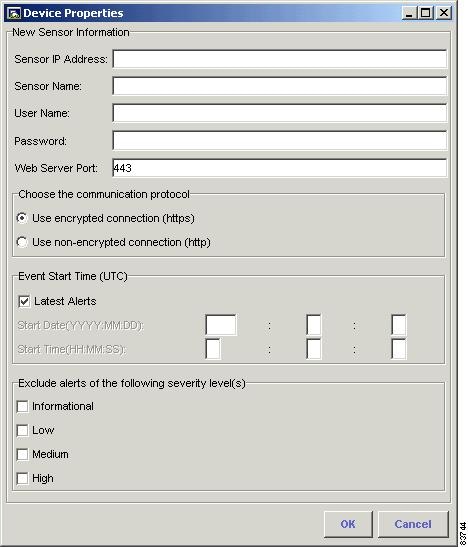
Step 2
•
•
•
•
•

Note
Step 3
Step 4
a.
IDS Event Viewer will receive alerts from the sensor, beginning with the first alert the sensor receives after connecting with IDS Event Viewer.
b.
•
•
IDS Event Viewer will receive alerts from the sensor, beginning with the first alert that matches the criteria you specified.
Step 5
•
•
•
•
Alarms that match the severity level(s) you selected are not pulled from the sensor event store and will not appear in the Statistical Graph.
Step 6
IDS Event Viewer sends a subscription request to the sensor. This request remains open until you modify the device properties or delete the device.
Note
Figure 6-3 Certificate Information
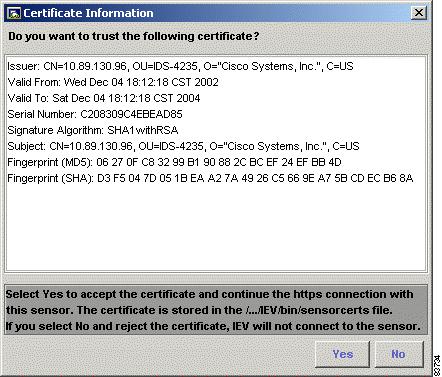
Step 7
Note
Editing Device Properties
To edit properties for an existing device in the Devices folder, follow these steps:
Step 1
Step 2
The Device Properties panel appears.
Step 3
Deleting a Device
To delete a device from the Devices folder, follow these steps:
Step 1
Step 2
The Device Deletion Confirmation dialog box appears.
Step 3
Reviewing Device Status
To review the version information and connection status for a device, follow these steps:
Step 1
Step 2
The Device Status dialog box displays the Sensor Version, Device Status, Web Server Statistic Information, Event Server Statistic Information, and Analysis Engine Statistic Information.
Figure 6-4 Device Status

IDS Event Viewer will return one of the following connection status responses:
•
Subscription not open yet.•
Subscription successfully opened.•
Failed to open subscription. Check communication parameters.•
Network connection error. Is the web server running?•
Status unknown. IEV server program may not be running.Step 3
Accessing the IDS Device Manager
You can access IDS Device Manager for a particular sensor from IDS Event Viewer.
To access IDS Device Manager, follow these steps:
Step 1
Step 2
The browser application opens and connects to the IP address for this sensor, using the port number and encryption specified in the Device Properties panel.
Configuring Filters
Filters enable you to customize and refine your view of event data by specifying alarms to exclude from your view. IDS Event Viewer ships with a default filter; however, you can create and store user-defined filters in the Filters folder. These filters can later be applied to any default or user-defined view. This section includes the following procedures:
Creating a Filter
To create a filter, follow these steps:
Step 1
The Filter Properties panel appears.
Figure 6-5 Filter Properties
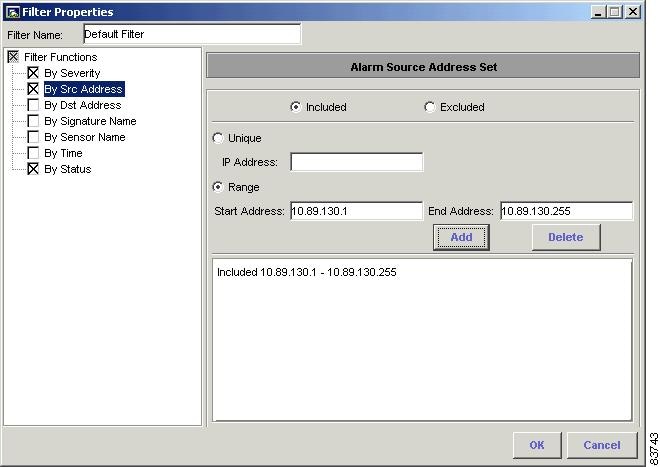
Step 2
Step 3
Step 4
a.
b.
The IP address is added to the group of addresses excluded or included (depending on what you selected) by this filter.
c.
The IP address range is added to the group of addresses excluded or included (depending on what you selected) by this filter.
d.
Step 5
a.
•
•
•
•
Figure 6-6 Filter Properties
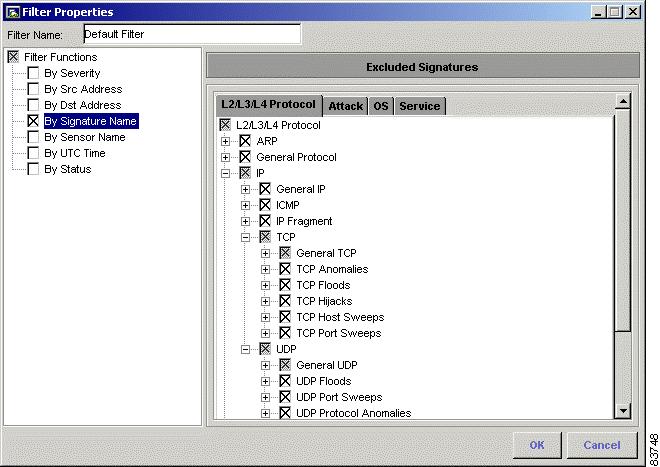
b.
The signatures you select are excluded by this filter.
Step 6
Step 7
a.
b.
Tip
c.
d.
Tip
e.
Step 8
•
•
•
•
•
Step 9
The filter is added to the Filters folder and can now be used in a view.
Editing Filter Properties
To edit the properties for an existing filter in the Filters folder, follow these steps:
Step 1
The Filter Properties panel appears.
Step 2
Step 3
A dialog box appears and warns you that you are about to overwrite the existing filter with the edited filter.
Step 4
Deleting a Filter
To delete a filter from the Filters folder, follow these steps:
Step 1
The Filter Deletion Confirmation dialog box appears.
Step 2
Step 3
Configuring Views
Views enable you to analyze filtered event data from a specified source. IDS Event Viewer ships with five default views; however, you can use the View Wizard to create and store user-defined views in the Views folder. This section includes the following procedures:
Creating a View
To create a view, follow these steps:
Step 1
The View Wizard appears.
Step 2
Step 3
Step 4
Step 5
Step 6
Step 7
The final panel of the View Wizard appears.
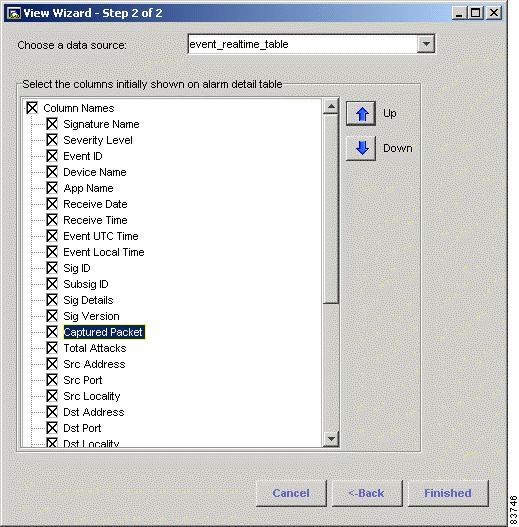
Figure 6-7 View Wizard
Step 8
Note
Step 9
Step 10
The view is added to the Views folder.
Editing View Properties
Tip
To edit the properties for an existing view in the Views folder, follow these steps:
Step 1
The View Wizard appears.
Step 2
Step 3
Step 4
A dialog box appears and warns you that you are about to overwrite the existing view with the edited view.
Step 5
Deleting a View
To delete a view from the Views folder, follow these steps:
Step 1
The View Deletion Confirmation dialog box appears.
Step 2
Step 3
Configuring Preferences
From the Edit menu, you can specify how often contents in a graph or table view are refreshed. You can also configure archival settings to optimize performance. This section includes the following procedures:
•
•
Configuring Refresh Cycle Settings
To configure the Refresh Cycle settings, follow these steps:
Step 1
The Refresh Cycle tab of the Preferences panel appears.
Figure 6-8 Refresh Cycle
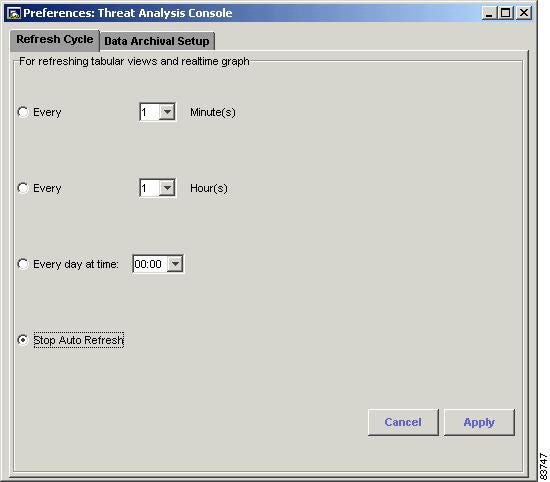
Step 2
a.
b.
c.
d.
Step 3
Configuring Data Archival Settings
IDS Event Viewer includes a database archival feature that enables you to archive real-time events and ensure available disk space for incoming events. Two thresholds control the archival process. The first is a time interval and the second is a maximum number of records. Crossing either threshold triggers the archival processes.
If the time interval threshold is crossed, all records with a status matching the archival settings are moved from event_realtime_table to archive_table.timestamp. Any alarms with a status set to Deleted are deleted.
If the maximum records threshold is crossed, any alarms with a status set to Deleted are deleted from the event_realtime_table. Then, all records with a status matching the archival settings are moved from event_realtime_table to archive_table.timestamp. If, after the initial archival process, the event_realtime_table still contains more than half of the maximum number of records allowed, the archival process continues to archive and remove records (except those with a status set to New). If the number of records remaining exceeds the maximum number of records allowed, all remaining records are archived, including those with a status set to New.
To configure data archival settings, follow these steps:
Step 1
The Data Archival Setup tab of the Preferences panel appears.
Step 2
•
•
•
•
Step 3
a.
b.
c.
Step 4
Step 5
Step 6
Note
Step 7
Step 8
Configuring Application Settings
IDS Event Viewer relies on supporting applications to carry out database, retrieval, and communication functions. From the Edit menu, you can specify the location of these supporting applications. This section includes the following procedures:
•
•
•
•
Specifying Web Browser Application Location
Note
Note
To specify the location of your browser, follow these steps:
Step 1
The Application Settings panel appears.
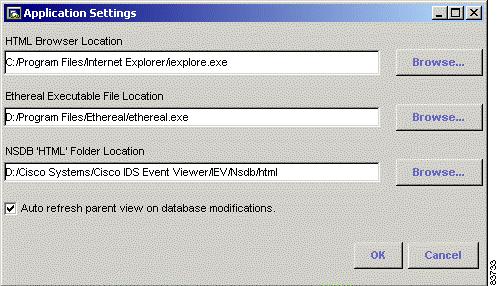
Figure 6-9 Application Settings
Step 2
Step 3
Specifying Ethereal Application Location
Note
To specify the location of Ethereal, follow these steps:
Step 1
The Application Settings panel appears.
Figure 6-10 Application Settings
Step 2
Step 3
Specifying NSDB Folder Location
Note
To specify the location of the NSDB, follow these steps:
Step 1
The Application Settings panel appears.
Figure 6-11 Application Settings
Step 2
Step 3
Changing the Auto Refresh View Setting
By default, if you delete a row in the Drill Down Dialog table or Expanded Details Dialog table, the aggregation table for that view is automatically refreshed to reflect the changes. However, you can change the default setting so that a change in a subordinate view is not reflected in the parent view until the next refresh cycle.
To change the auto refresh database setting, follow these steps:
Step 1
The Application Settings panel appears.
Figure 6-12 Application Settings
Step 2
Step 3
Viewing Event Data
After you configure IDS Event Viewer, you can manipulate the views and tables to display event data from the sensors you are monitoring. This section includes the following introduction and procedures:
•
•
Introduction to Tables and Graphs
IDS Event Viewer enables you to access various tables and graphs that provide specialized views into the event data you are analyzing. Before you create a view and begin working with the individual tables and graphs, you should review the following descriptions.
The following tables and graph organize the events for a view. The events shown in these tables and graph differ depending on the data source you select for the view. The data source can be the event_realtime_table, archived tables, or imported log files.
•
•
•
•
•
The following table and graph organize events from a continuously running thread in IDS Event Viewer. This thread continuously monitors and aggregates the total number of alarms IDS Event Viewer receives.
•
•
Specifying a Data Source
You must associate a data source with a view to indicate the events that view should display.
To specify or change the data source associated with a view, follow these steps:
Step 1
Step 2
The Change Data Source dialog box appears.
Step 3
If the view is open, the table automatically refreshes with events from the new data source. Otherwise, to reset the view with events from the new data source, double-click the view in the Views folder.
Viewing All Columns
You can right-click a column to hide it from the current view. You can later display all columns, including those hidden from view.
To view all columns, follow these steps:
Step 1
The columns configured for this view are displayed.
Step 2
Note
The column is hidden from the current view only. The next time you open this particular view, the column appears. If you want to permanently remove the column, edit the view properties.
Step 3
Step 4
The Drill Down Dialog appears, unless you double-click the Total Alarm Count column, in which case the Alarm Information Dialog appears.
Step 5
A second table appears in the Drill Down Dialog and displays the contents of the cell. Double-clicking a cell containing an arrow (—>) in this second table displays the Alarm Information Dialog.
Sorting Data in Columns
You can sort the table data in ascending or descending order by column.
To sort data in columns, follow these steps:
Step 1
Step 2
An Up Arrow or Down Arrow appears, indicating the possible sort order for the column data.
Step 3
Note
Displaying Multiple Views
You can display multiple views at the same time. IDS Event Viewer places one view behind the other and displays a tab for each view.
To display multiple views, follow these steps:
Step 1
Step 2
The view appears in the right view pane and displays an alarm aggregation table.
Step 3
Step 4
Step 5
All open views close.
Viewing Event Details
You can expand an event to view the details, such as signature name and severity level, associated with that event.
To view event details, follow these steps:
Step 1
The Expanded Details Dialog appears with the Whole Address panel displayed.
Step 2
Viewing Events in a Graph
You can view events in a Realtime Graph or Statistical Graph. Each graph provides a view of the average number of alarms per minute, based on severity level. However, each graph represents a different data source and therefore a different view into the events.
The Realtime Graph is populated with events from a continuously running thread in IDS Event Viewer. This thread continuously monitors and aggregates the total number of alarms IDS Event Viewer receives. The events displayed in the Realtime Graph reflect the average number of alarms received by IDS Event Viewer. The time stamp for these events reflects the time IDS Event Viewer received the alarm, not necessarily the time the sensor generated the alarm.
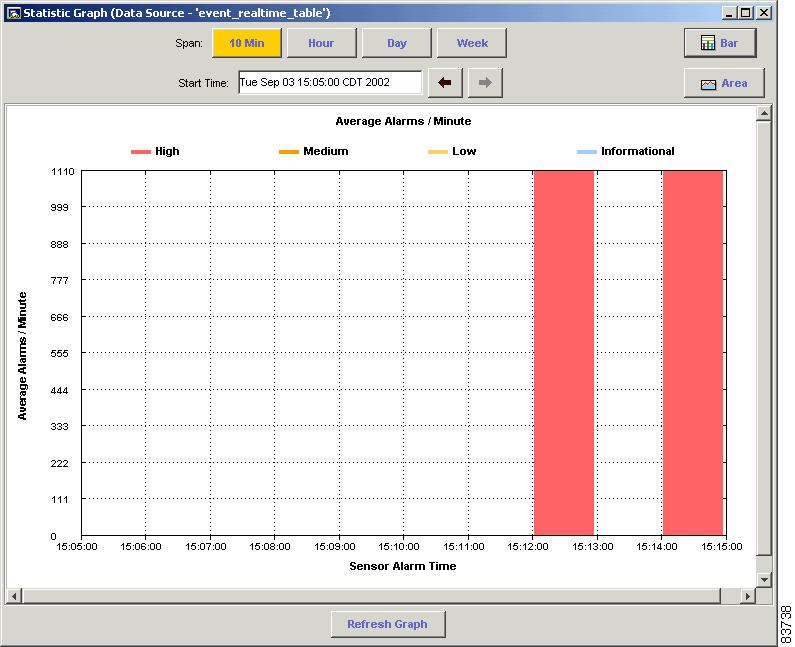
The Statistical Graph is populated with events from the data source you select. Valid data sources include the event_realtime_table, any archived table, or any imported table. The events displayed in the Statistical Graph reflect the average number of alarms received by IDS Event Viewer, based on the filter that is applied to the data source. Therefore, depending on the filter, the Statistical Graph may not reflect the true average number of alarms. The time stamp for these events reflects the time the sensor generated the alarm.
To view a graph, follow these steps:
Step 1
The Realtime Graph appears.
Figure 6-13 Realtime Graph

Step 2
a.
b.
IDS Event Viewer queries the data source for the selected view and calculates the average alarms per minute. The Statistical Graph appears and displays the result.
Figure 6-14 Statistical Graph
Step 3
a.
b.
Step 4
Viewing Events in the Realtime Dashboard
You can use the Realtime Dashboard to view a continuous stream of real-time events from the sensor.
To view events in the Realtime Dashboard, follow these steps:
Step 1
IDS Event Viewer opens a subscription request with the sensor. If the connection is successful, the Realtime Dashboard appears and displays the most recent events received by the sensor since the request was opened.
Figure 6-15 Realtime Dashboard

Step 2
IDS Event Viewer stops populating the Realtime Dashboard with events.
Step 3
IDS Event Viewer populates the Realtime Dashboard with events, beginning with the first event that was received after the stream was paused.
Step 4
All existing events are removed from the Realtime Dashboard and IDS Event Viewer opens a new subscription with the sensor.
Configuring the Realtime Dashboard Settings
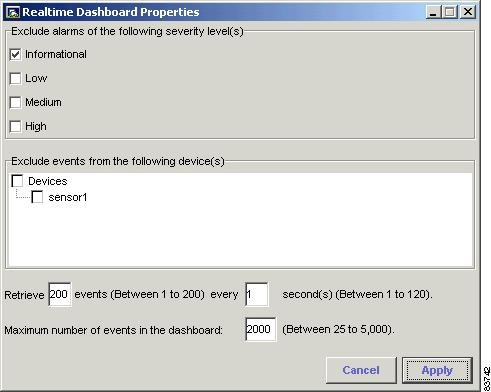
By default, the Realtime Dashboard displays the most recent events received from every device configured in IDS Event Viewer. You can configure the Realtime Dashboard to display only events from a particular device or only events of a particular severity level. You can also configure how often the Realtime Dashboard should retrieve events from the sensor(s) and the maximum number of events to display.
To configure the Realtime Dashboard settings, follow these steps:
Step 1
The Realtime Dashboard Properties panel appears.
Figure 6-16 Realtime Dashboard Properties
Step 2
•
•
•
•
Alarms that match the severity level(s) you selected will not appear in the Realtime Dashboard.
Step 3
IDS Event Viewer closes any open subscriptions to this device and no events are received from the sensor.
Step 4
a.
b.
Step 5
If the maximum number is reached, the oldest alarm will be removed from the Realtime Dashboard. This process will continue until the number of alarms in the Realtime Dashboard is less than the maximum number you specified.
Step 6
Using Ethereal
Ethereal is a network protocol analyzer for Windows that enables you to examine data from a live network or from a captured file. You can interactively browse the captured data and view summary and detail information for each packet, including the reconstructed stream of a TCP session. If you have Ethereal installed on the same host as IDS Event Viewer, you can start the Ethereal application from IDS Event Viewer Tools menu and view IP log files.
Working with Alarms
After you know how to manipulate views and tables to display the event data you are interested in, you can begin to manage individual alarms within those events. This task includes setting a status for alarms you have reviewed, adding notes to an alarm you want to track, or reviewing detailed alarm and signature information.
Viewing Individual Alarms
You can view individual alarms associated with an event.
To view individual alarms, follow these steps:
Step 1
a.
The Expanded Details Dialog appears.
b.
The Alarm Information Dialog appears.
Step 2
a.
b.
The Alarm Information Dialog appears.
Setting the Alarm Status
You can associate a status with the alarm, indicating what action should be taken by IDS Event Viewer (for alarms marked Deleted or during alarm archival) or by someone else in your organization.
Tip
To set the status for an alarm, follow these steps:
Step 1
Step 2
a.
b.
•
•
•
•
•
c.
Adding Notes to an Alarm
You can add notes (up to 255 characters) to an alarm entry and store these notes as part of the alarm entry in the database.
To add notes to an alarm, follow these steps:
Step 1
Step 2
Step 3
The cell becomes active and a cursor appears.
Step 4
Show Alarm Context
Certain alarms may have context data associated with them. Context data provides a snapshot of the incoming and outgoing binary TCP traffic (up to 256 bytes in both directions) that preceded the triggering of the signature.
To view the context for an alarm, follow these steps:
Step 1
The Decoded Alarm Context panel appears.
Show Attack Details
Certain attacks, such as sweep attacks, affect multiple victims or are the result of multiple attackers. The alarms generated from these attacks contain summary details of the attack.
To view the attack details for an alarm, follow these steps:
Step 1
The Summary Attack Details panel appears.
Accessing the NSDB
The NSDB is a repository of information for individual signatures, including signature id, type, structure, and description.
To access the NSDB, perform one of the following steps:
Step 1
or
Step 2
or
Step 3
or
Step 4
Database Administration
Database administration is essential to maintaining the integrity of IDS Event Viewer. Database administration includes routinely importing, exporting, and deleting event data. This section includes the following procedures:
•
Importing Log Files
To import a log file, follow these steps:
Step 1
The Import Log Files panel appears.
Figure 6-17 Import Log Files

Step 2
Step 3
Step 4
Note
Step 5
a.
b.
Step 6
a.
b.
Step 7
Depending on the option you chose, either the log file is appended to an existing table or a table is created. You can then select this table as the data source for a particular view and view the alarms in the log file.
Exporting Tables
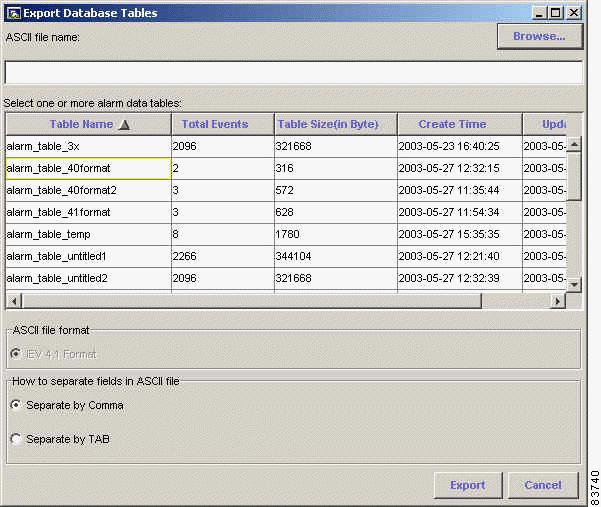
You can export data from the IDS Event Viewer tables to an ASCII file.
To export a table, follow these steps:
Step 1
The Export Database Tables panel appears.
Figure 6-18 Export Database Tables
Step 2
Step 3
Step 4
Note
Step 5
Step 6
Deleting Tables from Data Source
You can delete an existing table from the list of available data sources for a view.
To delete a table from the data source repository, follow these steps:
Step 1
The Data Source Information panel appears.
Step 2
The Table Deletion Confirmation dialog box appears.
Step 3
Deleting Alarms
To delete alarms from a data source, follow these steps:
Step 1
a.
b.
The Data Source Information panel appears.
c.
Alarms with a status set to Deleted are removed from the table.
Step 2
The status of all alarms in that table is set to Deleted and the table content is purged.
Step 3
Note
 Feedback
Contact Cisco
- Open a Support Case

- (Requires a Cisco Service Contract)
This Document Applies to These Products
- Collaboration Endpoints - Retired Products
- Conferencing - Retired Products
- Contact Center - Retired Products
- Optical Networking - Retired Products
- Routers - Retired Products
- Security - Retired Products
- Servers - Unified Computing (UCS) Retired Products
- Storage Networking Retired Products
- Switches - Retired Products
- Video - Retired Products
- Wireless - Retired Products