Table Of Contents
Using the Troubleshooting Toolset
Troubleshooting a Logged Event
Performing General Network Troubleshooting
Using the Troubleshooting Tool Bar
Showing or Hiding the Troubleshooting Tool Bar
Understanding Troubleshooting Views
Viewing 15-minute Intervals of Summary Data
Changing Summary View Display Options
Printing Troubleshooting Views
Opening the T1 Access Line Summary View
Opening the DDS Access Line Summary View
DS3 and E3 Access Line Summary
Opening the DS3 or E3 Access Line Summary View
Opening the HSSI Access Line Summary View
V.35, X.21, RS-449, RS-232, or EIA-530 Access Line Summary
Opening this Access Line Summary View
IMA, OC-3, DS1, and DSL Access Line Summary
Viewing Access Line Data for Multiple Physical Access Lines
Opening an Access Line Statistics View
IMA, OC-3, DS1, and DSL Access Line Statistics
Frame Relay and Frame-Based IP Access Channel Summaries
Opening the Frame Relay or Frame Relay-based IP Access Channel Summary View
ATM and ATM-based IP Access Channel Summaries
Opening an ATM Access Channel Summary View
Frame Relay and Frame/HDLC-based IP Transport ASEs
ATM and ATM-based IP Transport ASEs
HDLC and HDLC-based IP Access Channel Summaries
Opening an HDLC Access Channel Summary View
Viewing Access Channel Data for IP Transport ASEs
IP Access Channel CoS Thresholds
Multi-Protocol Frame Relay and HDLC Access Channel Statistics
Viewing Frame Relay Circuit Data
Opening the PVC Congestion View
Opening the PVC Statistics View
Opening the IP Circuit Summary View
Opening the IP Circuit Protocols View
Opening the IP Circuit CoS Summary View
Opening the IP Circuit CoS Threshold View
Opening an IP Circuit Statistics View
Opening the VC Summary View (ATM-to-ATM)
Opening the VC Summary View (ATM-to-Frame Relay or Frame Relay-to-ATM)
Viewing Multi-Protocol HDLC Protocol Data
Opening the Protocol Summary View for HDLC
Opening the HDLC Protocol View
Opening a Protocol Statistics View for HDLC
Viewing Access Channel Burst Data
Viewing Round Trip Delay Information
Initiating Network Line Loopback
Troubleshooting
Use the Troubleshooting Toolset to analyze network performance on every access line, access channel, and circuit in your network. You can examine troubleshooting data from the perspective of physical and data link layers, network protocol layers, and Internet application layers as appropriate to the ASEs.
The Troubleshooting Toolset updates real-time summary data every five seconds, real-time statistics every second, and historical data every 15 minutes from the ASE on the line you are currently viewing.
Topics in this chapter include:
•
"Using the Troubleshooting Toolset"
•
•
•
•
•
•
•
•
•
•
•
Using the Troubleshooting Toolset
To open the Troubleshooting Toolset, you can troubleshoot a logged event from the Event Processor or you can perform general troubleshooting by opening the Toolset directly.
Troubleshooting a Logged Event
Step 1
A triangle to the left of an event indicates the event is selected.
Step 2
The Troubleshooting Toolset is launched, and the Summary view appropriate to the selected event appears.
Performing General Network Troubleshooting
Step 1
Step 2
Step 3
The Troubleshooting Toolset is launched, and the view selected in Step 2 appears.
While troubleshooting, use the Network Selector at any time to quickly switch the network element you are viewing.
When the Troubleshooting Toolset button is unavailable, either you have not selected a network element or your user ID does not have permission to perform troubleshooting. Contact your PAM administrator.
Using the Troubleshooting Tool Bar
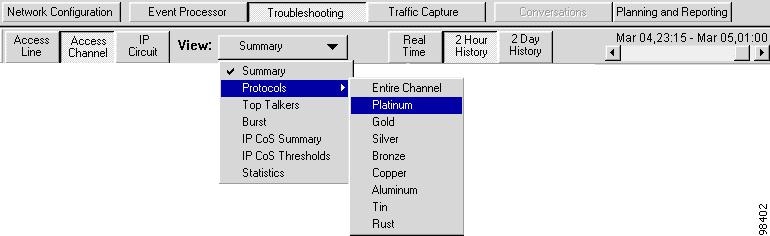
In the Troubleshooting Toolset, use the Troubleshooting Tool bar to choose the source, display type, and time frame (real time, 2-hour history, and 2-day history) of the data being collected about your network's performance (Figure 6-1). These options are also available from the Troubleshooting menu.
Figure 6-1 Troubleshooting Tool Bar—ATM ASE Selected
Note
The circuit perspective varies by link layer type and ASE software version.
Showing or Hiding the Troubleshooting Tool Bar
From within the Troubleshooting Toolset, choose or deselect View > Troubleshooting Toolbar.
Table 6-1 describes the components of the Troubleshooting Tool bar.
Exiting Troubleshooting
To close the Troubleshooting Toolset, choose File > Close, switch to the Traffic Capture or Event Processor Toolsets, or exit Cisco WAPMS.
When you choose the Traffic Capture or Event Processor Toolset while in the Troubleshooting Toolset, these Toolsets replace the Troubleshooting window. When you launch the Network Configuration, Planning and Reporting, or Conversations Toolsets while in the Troubleshooting Toolset, these tools run in a separate window.
Opening the Network Configuration Toolset resets the data display in the Troubleshooting window. However, when you open the Planning and Reporting or Conversations Toolset, Troubleshooting graphs, charts, and statistics continue scrolling and updating with new data. When you close either of these windows or redisplay the Troubleshooting window, data display is uninterrupted.
When you reopen the Troubleshooting Toolset after closing it and switch to real-time mode, new data begins displaying. To display data missed while the window was closed, switch to 2-hour or 2-day historical mode.
Understanding Troubleshooting Views
The Troubleshooting Toolset displays network performance data in several view formats. These views vary by the type of network element selected and the type of ASE (Cisco WAPMS or Visual ASE, or partner device) from which it displays data. See Table 6-2 for a description of all views.
Regardless of whether the configured circuit is near-end or end-to-end, all data displayed for Access Line and Access Channel views—including graphs, bar charts, and status indicators—references the near-end site only. For an end-to-end configured circuit, views at the Circuit view level display data for the near-end on the left and for the far-end on the right.
Table 6-2 Troubleshooting View Descriptions
AAL Utilization
Available for the Access Channel perspective for ATM circuits only. Displays bandwidth utilization of ATM Adaptation layers for ATM networks. For ATM ASEs, data for ATM adaptation layers AAL-1, AAL-2, AAL-5, Path (indicating virtual path), and Other is displayed. (A VC of Other indicates VC was detected on the line and its adaptation layer is a type other than AAL-1, AAL-2, or AAL-5.)
Alarms
Available for the Circuit perspective for AAL-5 type ATM circuits only, and only when protocol support exists; otherwise, alarm graphs appear in the Summary view. Displays the percentage of time the following Operation and Maintenance (OAM) signals were detected: Alarm Indication Signal (AIS) and Remote Defect Indication (RDI). Other graphs in the view display VC throughput, PCR, and SCR. See the "VC Alarms" section.
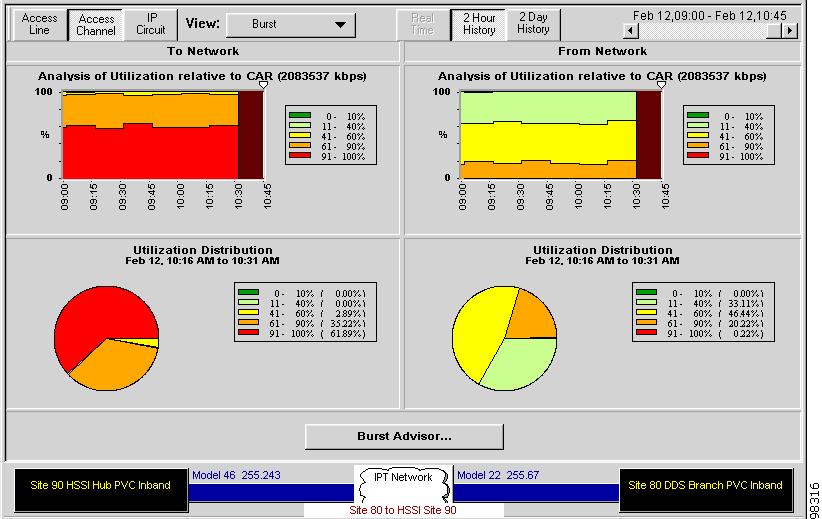
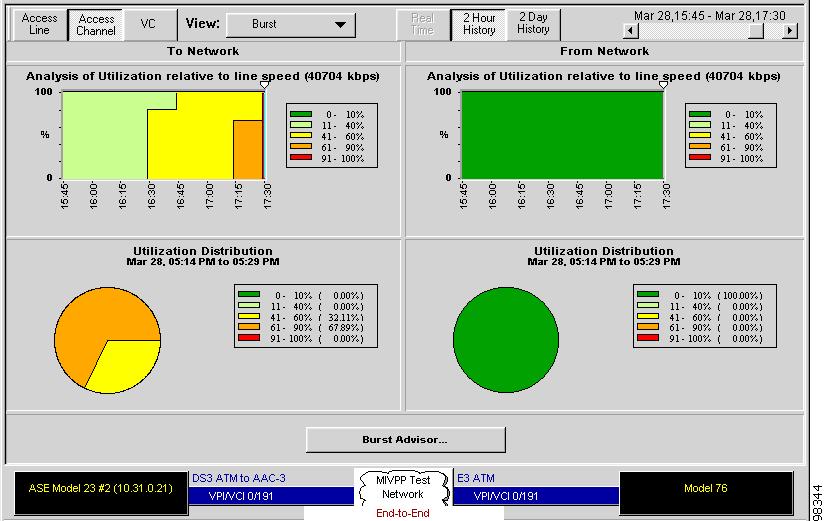
Burst
Available for the Access Channel (for IP Transport only) and Circuit perspectives. Displays graphs and tables that provide detailed utilization data in 15-minute segments for a selected channel or circuit in 2-day and 2-hour perspectives (Real Time is not available). Data granularity is one second. Available to all ASEs at the channel and circuit levels, but not available at the circuit level for HDLC circuits. See the "Viewing Burst Data" section.
Congestion
Available for the Circuit perspective of Frame Relay and ATM circuits.
•
•
IP CoS Summary
Available for IP Transport ASEs, shows throughput summary graphs by IP class of service on the access channel or IP circuit. See the "IP Access Channel CoS Summary" section and the "IP Circuit CoS Summary" section.
IP CoS Threshold
Available for IP Transport ASEs, shows throughput relative to policing threshold for each IP class of service on the access channel or IP circuit. See the "IP Access Channel CoS Thresholds" section and the "IP Circuit CoS Thresholds" section.
Protocols
Displays graphs of throughput by protocol data for a selected circuit in 2-day, 2-hour, or real-time perspectives. Some partner ATM devices may not support this view.
QoS Advisor
Available for the Circuit perspective for ATM-to-ATM circuits on supported partner devices only. This view displays Cell Delivery Ratio (CDR), Cell Transfer Delay (CTD), circuit throughput, and circuit availability.
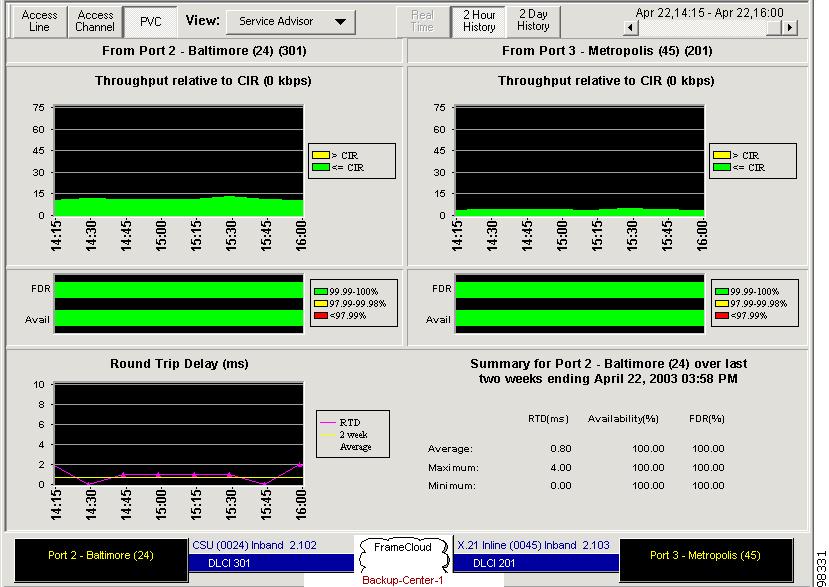
Service Advisor
Available for the Circuit perspective for IP Transport, Frame Relay, and ATM. Displays graphs showing network performance against service level agreement (SLA) metrics data in 2-day and 2-hour perspectives. (Real Time perspective is not available.) See the "Viewing Service Advisor Data" section.
Statistics
Displays data tables of detailed counts of network performance variables in real time only, as reported by the ASE, for a selected access line, access channel, or circuit. Real-time counts are rolled into the last hour and last day totals. Statistics are generally available for all troubleshooting perspective views; they are unavailable for certain types of physical access lines.
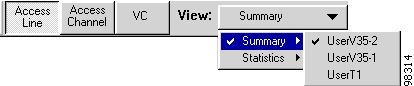
For partner devices that support multiple physical access lines, a cascaded menu in the Summary View displays statistics per physical access line. See the "IMA, OC-3, DS1, and DSL Access Line Summary" section.
Summary
Displays graph, chart, and condition indicator data for a selected network element. Use this view to assess the state of signals critical to the health of an access line, access channel or circuit (as selected through the troubleshooting perspective). Graphs display data in 2-day or 2-hour blocks, or in real time. (See the "Viewing 15-minute Intervals of Summary Data" section and the "Changing Summary View Display Options" section.)
For partner devices that support multiple physical access lines, a cascaded menu in the Summary View displays summary information per physical access line. See the "IMA, OC-3, DS1, and DSL Access Line Summary" section.
Top Talkers
Available for IP Transport ASEs, shows IP top talkers and throughput by protocol on the access channel. See the "Top Talkers" section.
Table 6-3 summarizes available views by troubleshooting perspective for Cisco WAPMS and partner devices.
Table 6-3 Troubleshooting Views for ASEs and Partner Devices
ATM
(DS3/E3)Summary
> User DS3/E3Statistics2
> User DS3/E3
> Network DS3/E3Summary
Burst
AAL Utilization
StatisticsVC
Summary
Protocols
Congestion
Burst
Service Advisor
QoS Advisor2
Alarms3
StatisticsFrame Relay
Summary
Statistics2Summary
Burst
StatisticsPVC
Summary
Protocols
Congestion
Burst
Service Advisor
StatisticsHDLC
Summary
Statistics2Summary
Burst
StatisticsProtocol
Summary
Protocols
StatisticsIP Transport
Summary
StatisticsSummary
Protocols (per CoS)
Top Talkers
Burst
IP CoS Summary
IP CoS Threshold
StatisticsIP
Summary
Protocols
IP CoS Summary
IP CoS Thresholds
Service Advisor
Statistics
1 Views under this perspective display data for near-end site only.
2 Available only for ATM-to-ATM configured circuits for supported partner devices only.
3 Available for AAL-5 circuits configured on ATM ASEs.
Network Traffic Directions
Troubleshooting statistics present data referenced from the network point of view. Troubleshooting graphs and bar charts present data referenced from the ASE site (access line, channel, or circuit) point of view. Discussions in this chapter refer to troubleshooting data flowing to the network and from the network.
•
•
Viewing 15-minute Intervals of Summary Data
The time cursor appears in graphs in Troubleshooting Summary views, allowing you to isolate 15-minute intervals of summary statistics for viewing. Because Summary views are time-synchronized, the cursor always appears in the same relative position on the graphs that use it.
The time cursor is unavailable during real-time monitoring. you are viewing historical data and the time cursor does not appear, it may not be available under Troubleshooting Options (see the "Changing Summary View Display Options" section).
Using the Time Cursor
Step 1
All time cursors appearing in the Summary view now point to the new time and all graphs are now updated with statistics gathered during the 15-minute period surrounding the time pointed to by the cursors.
Step 2
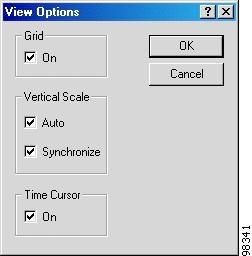
Changing Summary View Display Options
When viewing summary data, you can customize the appearance of the Summary view.
Figure 6-2 Troubleshooting View Options Window
From any Summary view, choose Troubleshooting > Options from the Menu bar. Table 6-4 lists the options available in the View Options window.
Printing Troubleshooting Views
You can print any Troubleshooting view currently appearing on your monitor. Choose File > Print and choose your options from the standard Print window.
Viewing Access Line Data
Cisco WAPMS provides Summary and Statistics views of access line traffic:
•
•
All data displayed for Access Line views references the near-end site only, whether you are viewing channel data for a near-end or an end-to-end configured circuit.
The right half of the Access Line Summary view always displays data for the primary interface of the network side of the ASE access line. For ASEs that support only one user interface or access line, the left half displays signal activity for that user interface. For ASEs and partner devices that support multiple access lines, the Summary view includes a cascaded menu from which you can choose which access line data to display in the left half of the view. Data displayed in views for these device types varies based on your cascaded menu choice and the type of access lines supported. (See the "IMA, OC-3, DS1, and DSL Access Line Summary" section and the "Viewing Access Line Data for Multiple Physical Access Lines" section.)
Table 6-5 indicates which access line Troubleshooting views are available for various access line types. The information displayed also varies by access line type.
Table 6-5 Access Line Troubleshooting Views
T1 (passive probe/inline ASE or CSU/DSU ASE)
Summary
Statistics
DDS
Summary
Statistics
DS3, E3
Summary
Statistics
HSSI
Summary
X.21, V.35, RS-449, RS-232, EIA-530
Summary
"V.35, X.21, RS-449, RS-232, or EIA-530 Access Line Summary" section.
Partner Devices: IMA, OC-31 , DS1, E11, E3, and DSL1
Varies by partner device
1 Not available for Cisco WAPMS and Virtual ASEs but supported for partner devices.
T1 and E1 Access Line Summary
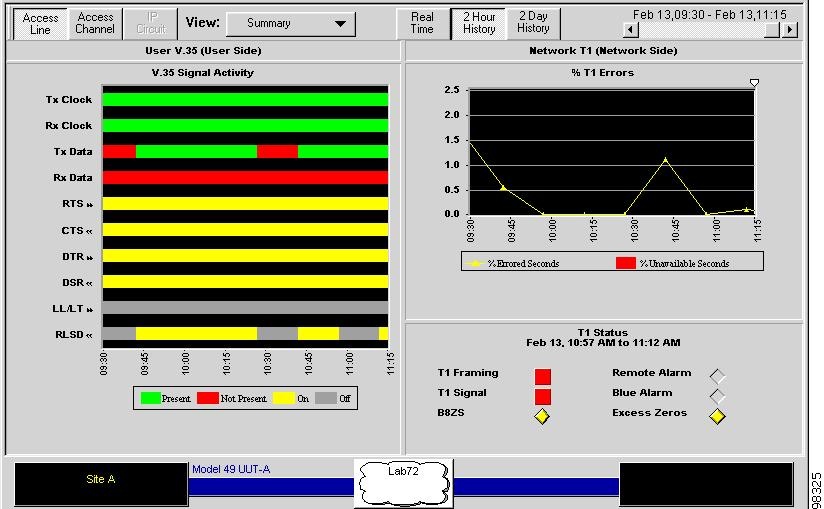
This view varies for access lines with CSU/DSU ASEs and passive probe/inline ASEs.
In the User V.35 view, when the T1 or E1 access line is configured from a CSU/DSU ASE, two graphs appear: V.35 Signal Activity on the left and % T1 Errors on the right. The % T1 Errors graph plots the percentage of errored seconds in yellow and the percentage of unavailable seconds in red of the network primary interface.
The Signal Activity graph shows the following line states:
•
•
•
•
Direction arrows indicate the originator of remaining signals. RTS, DTR, and LL/LT signals originate from the user side, while CTS, DSR, and RLSD signals originate from the network. (See Figure 6-3).
Status indicators in the bottom right show the health of the primary network interface T1/E1 line relative to the selected time period. In real-time mode, the indicators show the current status of the access line. In 2-hour or 2-day historical mode, the indicators show the access line status during the 15-minute measurement interval selected with the historical scroll bar on the Troubleshooting Tool bar and the time cursor.
Figure 6-3 T1 Access Line Summary View—CSU/DSU V.35 Interface
When the T1 or E1 access line is configured from a passive probe/inline ASE, the view plots percentage errored seconds of the T1/E1 user interface on the left, and the primary T1/E1 network interface on the right. All graphs reflect the entire measurement interval selected from the Troubleshooting Tool bar.
In the User DSX-1 view, the percentage of T1 errors (errored and unavailable seconds) appears for the user and network sides, along with T1 status LEDs.
Opening the T1 Access Line Summary View
Step 1
Step 2
For the ASE, from the submenu you can choose User V.35 or User DSX-1. Table 6-6 describes the signals and status indicators appearing in the Summary View for CSU/DSU.
DDS Access Line Summary
The Summary view for a DDS access line contains two graphs (see Figure 6-4). The color-coded bar graph on the left indicates the state of DDS signal activity on the line. The %DDS Errors graph on the right indicates the percentage of errored and unavailable seconds. Both graphs reflect the entire measurement interval selected from the Troubleshooting Tool bar.
Figure 6-4 DDS Access Line Summary View
In a typical Frame Relay environment, Data is Present continuously, and RTS/CTS and DTR/RLSD are On. When this is not the case, it probably indicates a power outage by the router or ASE, or a loss of signal from the Frame Relay network.
In the lower right of the view, status indicators show DDS line status for the selected time period. In the real-time view, the indicators show the current status of the access line. In the 2-hour or 2-day view, they show the access line status during the 15-minute measurement interval selected with the historical scroll bar on the Troubleshooting Tool bar.
Opening the DDS Access Line Summary View
Step 1
Step 2
Table 6-7 describes the signal graph and status indicators appearing in the Summary view for a DDS access line.
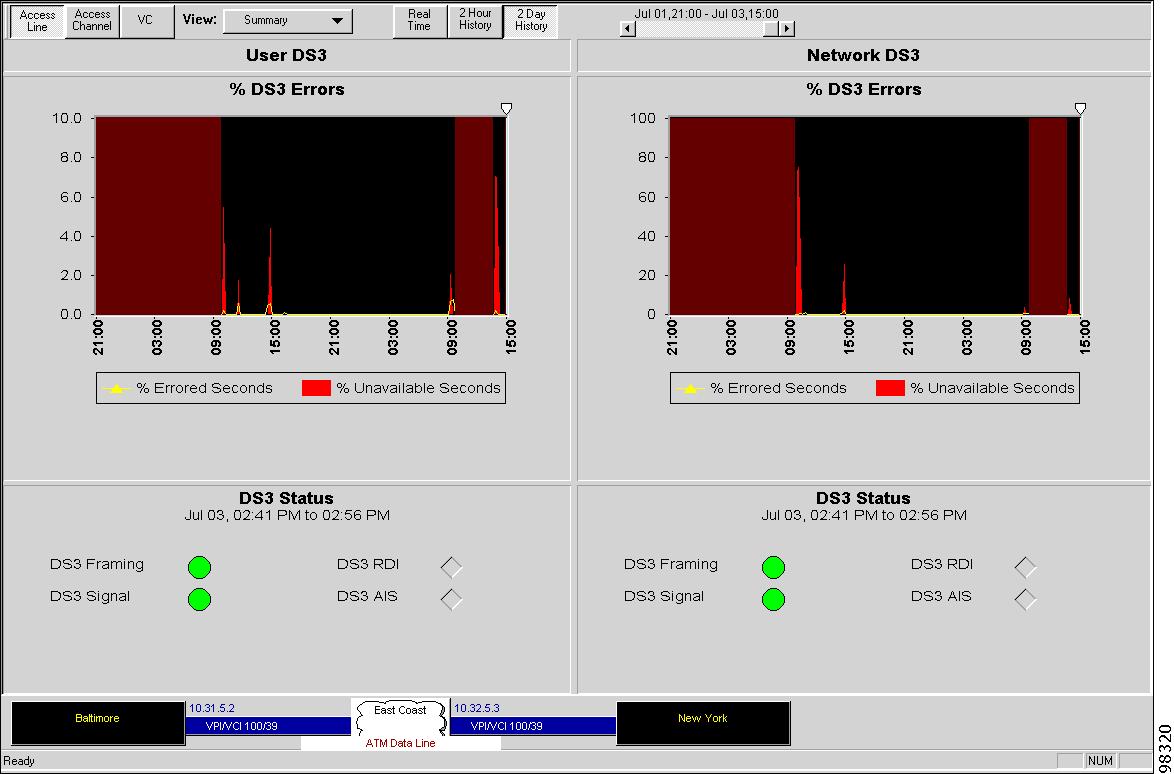
DS3 and E3 Access Line Summary
The Access Line Summary view for DS3 and E3 type access lines displays two graphs: one for traffic to the network, the other for traffic from the network. Each graph shows the percentage of errored seconds in yellow and the percentage of unavailable seconds in red. Both graphs reflect the entire measurement interval selected from the Troubleshooting Tool bar.
Figure 6-5 DS3 Access Line Summary View (End-to-end Circuit)
The lower part of the view indicates status for traffic to and from the network (see Table 6-8). Indicators show the DS3 or E3 line status with the time period selected. In real-time mode, indicators show the current access line status. In a 2-hour or 2-day time period, they show the access line status during the 15-minute measurement interval selected with the historical scroll bar on the Troubleshooting Tool bar and the time cursor.
Opening the DS3 or E3 Access Line Summary View
Step 1
Step 2
Table 6-8 describes the status indicators in the resulting view.
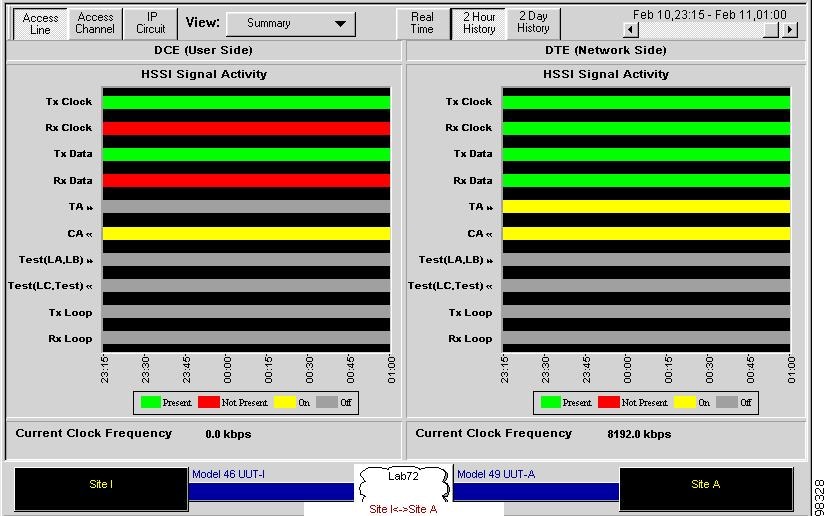
HSSI Access Line Summary
The HSSI Access Line Summary view displays clock, data, and HSSI line status signals to and from the user and the network.
•
•
The Access Line Summary view for the HSSI ASE shows all signals for both user and network sides, and the Clock, Data, Test, and Loop signals show both transmit and receive signals. Direction arrows indicate the originator of the signal. TA and Test (LA, LB) originate from the user side, while CA and Test (LC, Test) originate from the network side. Both graphs reflect the entire measurement interval selected from the Troubleshooting Tool bar.
The view shows the following line states:
•
•
•
•
In a typical Frame Relay environment, Clock and Data are present continuously, and TA and CA are On. When this is not the case, it may indicate a router or ASE power outage, or a loss of signal from the Frame Relay network. For more detailed signal information, see Table 6-9.
Figure 6-6 HSSI Access Line Summary View
The bottom panes of the view show the current clock frequency for traffic in each network direction.
Opening the HSSI Access Line Summary View
Step 1
Step 2
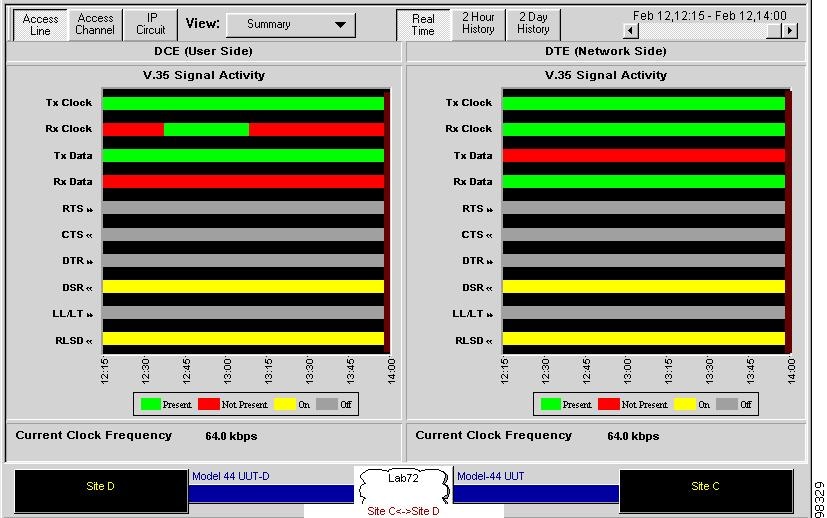
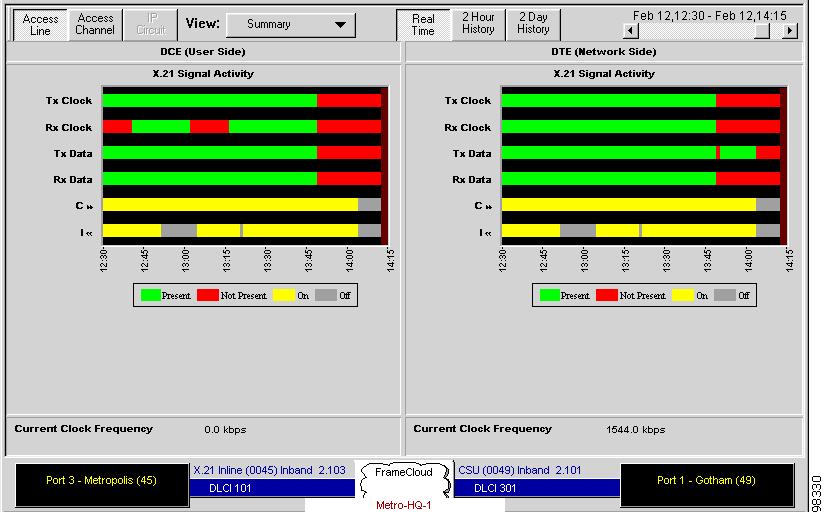
V.35, X.21, RS-449, RS-232, or EIA-530 Access Line Summary
The Summary view for a V.35, X.21, RS-449, RS-232, or EIA-530 access line displays clock, data, and line status signals to and from the user and the network.
•
•
The Access Line Summary view shows all signals for both user and network sides, and the Clock and Data signals show both transmit and receive signals. Direction arrows indicate the originator of remaining signals. For the V.35 ASE, RTS, DTR, and LL/LT signals originate from the user side, while CTS, DSR, and RLSD signals originate from the network (see Figure 6-7 and Table 6-10). For the X.21 ASE, the C signal originates from the user side and I originates from the network (see Table 6-11).
Both graphs reflect the entire measurement interval selected from the Troubleshooting Tool bar.
The view shows the following line states:
•
•
•
•
In a typical Frame Relay environment, Data is Present continuously, and RTS/CTS and DTR/RLSD are On. When this is not the case, it may indicate a router or ASE power outage, or a loss of signal from the Frame Relay network.
Figure 6-7 Access Line Summary View— V.35
The current clock frequency for traffic in each network direction appears at the bottom of the view.
Opening this Access Line Summary View
Step 1
Step 2
For X.21 inline probe ASEs, the following Access Line Summary view is shown (Figure 6-8). For detailed signal information, see Table 6-11.
Figure 6-8 Access Line Summary View— X.21
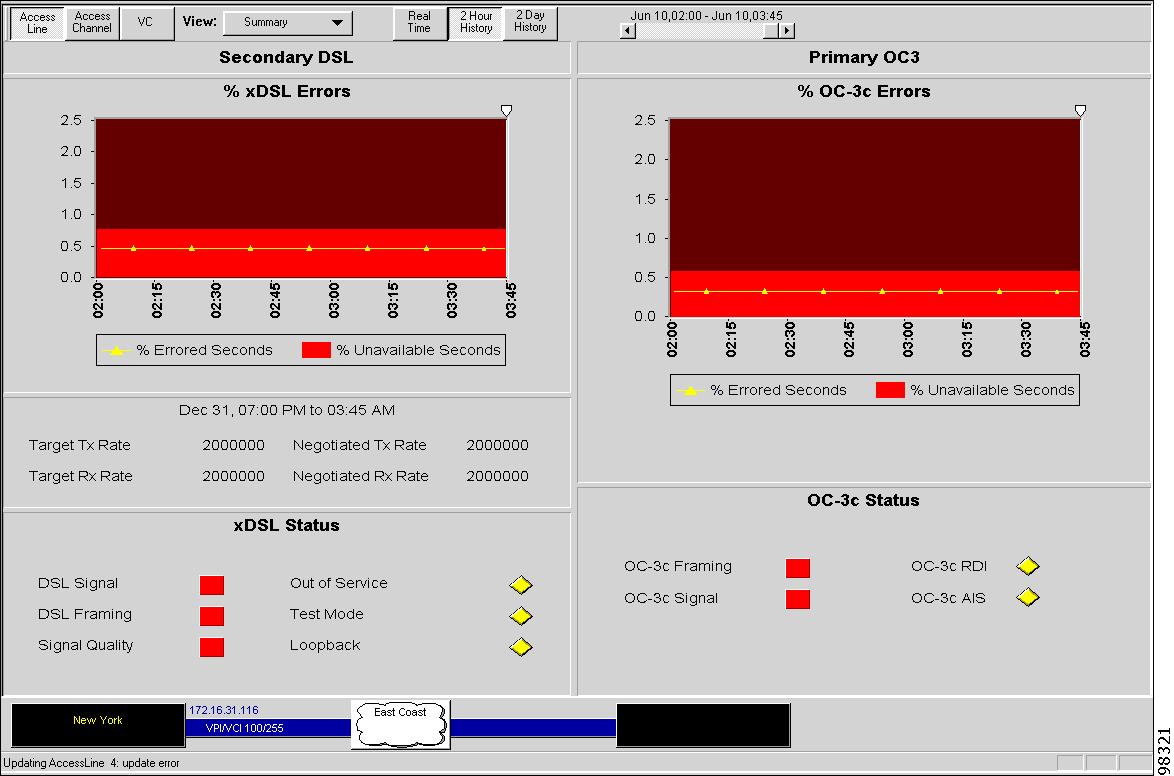
IMA, OC-3, DS1, and DSL Access Line Summary
Partner devices can display Access Line Summary views for the IMA, OC-3, DS1, and DSL protocols. For each protocol, Access Line Summary graphs show the percentage of errored seconds (in yellow), and the percentage of unavailable seconds (in red) for the measurement interval selected. A DSL and OC-3 example is shown in Figure 6-9.
Figure 6-9 DSL and OC-3 Access Line Summary View
Status indicators for the OC-3, IMA, and DSL protocols are described in Table 6-12, Table 6-13, and Table 6-14. Status indicators for DS1 are identical to those for T1 (see Table 6-6).
Viewing Access Line Data for Multiple Physical Access Lines
For ASEs and partner devices that support multiple physical access lines, use the Summary View menu to choose the access line data to display.
Figure 6-10 Summary View Menu for Multiple Physical Access Lines
Data displayed in the graphs for devices supporting multiple physical access line varies based on the type of access lines supported. Graphs on the right display network data for the primary access line; graphs on the left display data for any physical access lines supported by the partner device you selected in the View > Summary menu.
For example, Figure 6-10 indicates the ASE supports three user access lines: two V.35 access lines and a T1 line. From the selection indicated, network data and status indicators for the user T1 line are displayed on the left, and data for the primary network interface for that ASE on the right.
Note
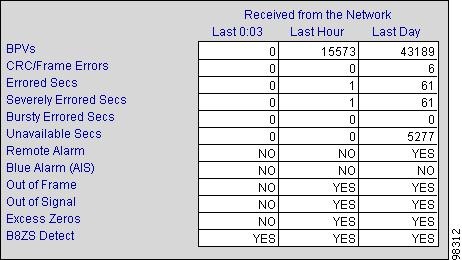
Access Line Statistics
The Access Line Statistics view displays information in data tables about the health of your network lines. The information varies based on the access line type and whether the ASE supports multiple physical access lines (see Figure 6-11).
Note
For all ASE types, tables in the Statistics view contain three columns that cover different time periods. The first column shows real-time statistics, which accumulate for 15 minutes and are reset to zero at the end of each 15-minute interval. The second column shows statistic counts rolled from the first column for the last hour. The third column shows statistic counts rolled from the second column for the last day.
Figure 6-11 Access Line Statistics View—T1 CSU/DSU ASE
For ATM ASEs (which support only one physical access line), the view shows statistics for one direction. You choose the direction using the View menu. For example, for a DS3 ATM ASE, the menu displays Network DS3 and User DS3, specifying statistical view choices for the network or user side of the ASE.
For a CSU/DSU ASE, the view contains one table showing statistics from the network. For a passive probe/inline ASE the view contains two tables showing statistics to and from the network.
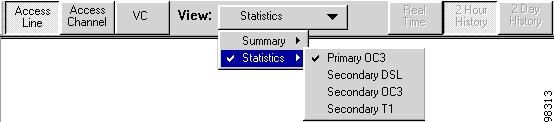
For partner devices supporting multiple access lines, the view shows statistics for one line—its to or from network direction is determined by the ASE configuration. You choose the access line for which to display statistics using the View menu. For example, Figure 6-12 shows the Access Line Statistics menu choices for a partner device supporting four physical access lines: an OC-3 (primary) line, and three secondary lines: DSL, OC-3 and T1.
Figure 6-12 Access LIne Statistics Selection for Multiple Physical Access Lines
Opening an Access Line Statistics View
Step 1
Step 2
T1 and DDS Statistics
Table 6-15 describes the statistics appearing in the Access Line Statistics view when a T1 or DDS access line is selected.
When analyzing T1 variables in the Access Line Statistics view, with the exception of the B8ZS indicator, any non-zero count or positive indicator usually shows a problem with the quality of the transmission circuit or CPE. For these problems, review the service level agreement with your telecommunications company or WAN service provider to determine the level of performance acceptable for your network.
DS3/E3 Statistics
Table 6-16 describes the statistics that appear when a DS3 or E3 line is selected.
IMA, OC-3, DS1, and DSL Access Line Statistics
Partner devices can display Access Line Statistics views for the following protocols: IMA, OC-3, DS1, and DSL.
•
•
Table 6-17 Access Line Statistics—DSL
LOS Seconds
See definitions in Table 6-16.
OOS Seconds
TestMode Seconds
Loopback Seconds
Dropped Data Count
Dropped data count from measurement interval.
Rx Corrected Errors
Number of received corrected errors detected in the measurement interval.
Viewing Access Channel Data
Cisco WAPMS provides Summary, Statistics, Burst, and other views of access channel traffic as outlined in Table 6-18.
Note
The information appearing in the views varies by access channel type.
Table 6-18 Access Channel Troubleshooting Views
Frame Relay
Summary
Shows utilization and error condition data at the link layer. Access circuit details for Frame Relay DLCIs.
"Frame Relay and Frame-Based IP Access Channel Summaries" section.
Statistics
Lists detailed Frame Relay data in table format.
"Multi-Protocol Frame Relay and HDLC Access Channel Statistics" section.
ATM
Summary
Shows utilization and error condition data at the link layer. Access circuit details.
Statistics
Lists detailed ATM data in table format.
AAL Utilization
Shows utilization and distribution of ATM Adaptation layers (AAL-1, AAL-2, AAL-5 and Other) for ATM ASEs and supported partner devices.
HDLC
Summary
Shows utilization and error condition data at the link layer.
Statistics
Lists detailed HDLC data in table format.
"Multi-Protocol Frame Relay and HDLC Access Channel Statistics" section.
IP Transport
Summary
Shows utilization, most used IP circuits, and error condition data at the link layer. Access circuit details.
"Frame Relay and Frame-Based IP Access Channel Summaries" section and "ATM and ATM-based IP Access Channel Summaries" section.
Protocols
Shows throughput and distribution by protocol for the entire channel and by each defined class of service (CoS).
Top Talkers
Shows the top IP network users and throughput by protocol on the access channel.
IP CoS Summary
Shows throughput and distribution of access channel usage by CoS.
IP CoS Threshold
Shows throughput by CoS above and below policing threshold settings.
Statistics
Lists detailed IP access channel data in table format.
All types
Burst
Available for access channels. Provide detailed utilization information from a historical perspective.
Frame Relay and Frame-Based IP Access Channel Summaries
The Frame Relay Access Channel Summary graphically displays utilization and error conditions in the access channel of your Frame Relay network. In the view, three related graphs have color-coded, plotted lines indicating traffic direction. The top left graph tracks the percentage of access channel utilization, the top right graph tracks the most used PVCs (for Frame Relay) or IP circuits (for IP) as a percentage of line speed, and the lower left graph tracks the percentage of errored frames. Graphs can be viewed in 2-hour, 2-day, or real-time increments. (See Figure 6-13.)
For Frame Relay-based IP Transport ASEs, the Access Channel Summary view is similar to that for Multi-Protocol ASEs with the following exceptions:
•
•
•
To drill down on circuit information for a particular site, double-click a circuit in the upper-right graph
Figure 6-13 Access Channel Summary View—Frame Relay-based IP Transport
In the lower right pane, indicators show the current status of the access channel in real time. These indicators change shape and color based on the following access channel conditions:
•
•
•
•
You can also access circuit details from the Summary view. Click the Circuit Details button to view the status of all DLCIs on the selected channel.
Note
Opening the Frame Relay or Frame Relay-based IP Access Channel Summary View
Step 1
Step 2
Table 6-19 describes the contents of the resulting view.
Table 6-19 Access Channel Summary View—Frame Relay and Frame-based IP Transport
Access Channel Utilization
Displays access channel usage as a percentage of access channel speed. Utilization is calculated as:
[(octets received during measurement interval) x 8 x 100%] ÷ [(access channel rate) x (measurement interval duration)]
Octets received includes header, FCS, and information field.
Most Used PVCs
(Frame Relay only) Displays access channel usage by individual PVCs (indicated by the DLCI number on the local channel). The measurement interval for which data is displayed appears under the Most Used PVCs graph title.
Most Used IP Circuits
(IP Transport only) Circuits are shown by PVC name only. Displays access channel usage by individual IP circuits (indicated by the PVC name). The measurement interval is the same as Most Used PVCs.
% Errored Frames
Indicates errored frame activity in both directions on the access channel. Abnormal Frames are aborted, too short, or too long frames. These are often a sign of improper equipment configurations. Errored Frames have an FCS or octet alignment error, and can indicate equipment failure or an underlying transmission impairment.
Current Channel Link State
Green: normal state. LMI heartbeat polling is working properly, the network switch and CPE are communicating, or LMI is not in use.
User Red: the CPE is not sending LMI requests.
Network Red: the network switch is not responding to CPE polls.
User Yellow, Network Red: LMIsolate is on, but the network is down.
User Yellow, Network Green: LMIsolate is on, and the network is up.
Current Access Line Quality
Green: normal state. No transmission impairments occurred during the current measurement interval.
Red: transmission impairments occurred during the current measurement interval. (This is very likely a physical layer problem. Diagnose such problems in the Access Line Summary view.)
Current Circuit State
For Frame Relay and Frame Relay-based IP Transport ASEs only.
Green: normal state. All circuits are active.
Yellow: no circuits are present.
Red: at least one circuit is inactive. The text indicates the number of inactive circuits.
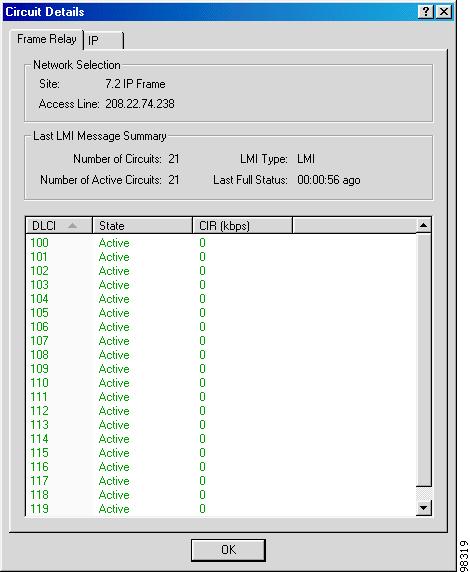
Circuit Details
Click to display status details and verify connectivity on all DLCIs on the port, the state of each (active or inactive), and the nominal transmission rate (in frames/second) of each. For IP Transport ASEs, view and verify connectivity of IP circuits also. For more information, see the "Viewing Circuit Details" section.
ATM and ATM-based IP Access Channel Summaries
The ATM Access Channel Summary graphically displays utilization and error conditions in the access channel of your ATM network. The view may vary by ATM ASE version and capability support for partner devices. For ATM-based IP Transport ASEs, the IP Access Channel Summary view is similar to that for Multi-Protocol ATM ASEs. (See Figure 6-14.)
Figure 6-14 Access Channel Summary—ATM IP Transport ASE
The lower right pane contains two sets of status indicators showing current ATM access channel status to and from the network. They change shape and color based on the access channel condition:
•
•
•
To drill down on circuit information for a particular site, double-click a site in the upper-right graph.
For ATM ASEs, the view shows access channel utilization to and from the network, most used VCs (as a percentage of line speed), and the percentage of errored cells received from the network and status indicators. AAL utilization appears in a separate view (see the "ATM AAL Utilization" section).
Opening an ATM Access Channel Summary View
Step 1
Step 2
Table 6-20 describes the view contents.
Table 6-20 Access Channel Summary View—ATM
Access Channel % Utilization
Access channel usage as a percentage of access channel capacity. Utilization is calculated as:
[cells x 100%] ÷ [channel capacity x measurement interval].Note: Access channel capacity varies by line speed and transmission convergence layer. For example, DS3 HEC capacity is approximately 104,268 cells per second; DS3 PLCP capacity is 96,000 cells per second.
% Errored Cells
Errored cell activity on the access channel to and from the network. Errored cells are determined by evaluating the header sequence (HEC value) of each cell.
Channel Link State
Green to and from network: both network and user ATM links are up.
Green to network, red from network: user-side ATM link is down.
Red to network, green from network: network-side ATM link is down.
Red to and from network: both network and user ATM links are down.
Cell Delineation
Green: normal state. The ASE is receiving ATM cells according to the transmission convergence layer setting (HEC or PLCP).
Red: alarm state. Either the DS3/E3 stream is not carrying ATM traffic or the ASE is not configured with the appropriate TC Layer setting.
VC AIS Summary
A VC AIS (Alarm Indication Signal) is a circuit-level alarm message that alerts downstream equipment the incoming signal along with one or more VCs in this ATM channel has been broken because of a failure upstream. To the network, an AIS indicates a fault with the CPE on the user side of the ASE. From the network, an AIS indicates a fault on the network side of the ASE.
Green: normal state.
Red: alarm state. An AIS is present currently.
VC RDI Summary
A VC RDI (Remote Defect Indicator) is a circuit-level alarm message that alerts upstream equipment its outgoing signal, along with one or more VCs in this ATM channel, is not reaching the far end of the VC because of a failure downstream. (The equipment that generates an RDI upstream also generates an AIS downstream.) To the network, an RDI indicates the signal on the user's side of the ASE is broken. From the network, an RDI indicates the signal from the network side of the ASE is not reaching the CPE.
Green: normal state.
Red: alarm state. An RDI is signaled currently.
Transmission Convergence Layer
Mode of cell delineation in use: PLCP or HEC.
Circuit Status
(IP Transport only) State value for each IP circuit.
Green: normal state. All circuits are active.
Yellow: no circuits are present.
Red: at least one circuit is inactive. The text indicates the number of inactive circuits.
Circuit Details
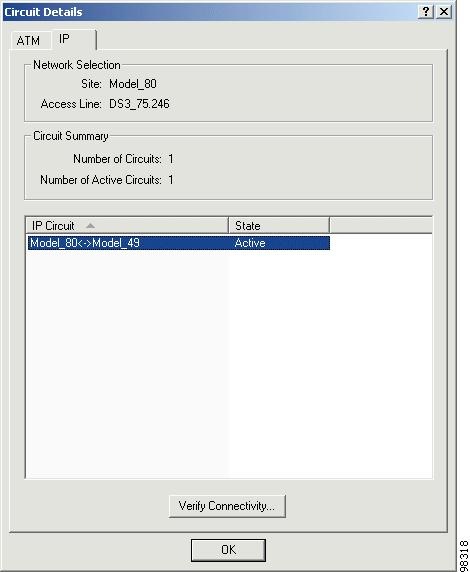
Click to view all VCs configured for that access line, the state of each (active or inactive), and the nominal transmission rate (in cells/second) of each. For ATM-based IP Transport ASEs, view the number of active ATM AAL-5 and IP circuits on the access channel and verify connectivity. For more information, see the "Viewing Circuit Details" section.
Viewing Circuit Details
From the Access Channel Summary view you can view circuit detail status by clicking the Circuit Details button in the lower right corner of the view. Information appearing in the Circuit Details window depends on the ASE type and whether it is in promiscuous mode.
Note
Frame Relay and Frame/HDLC-based IP Transport ASEs
For Multi-Protocol Frame Relay ASEs, you can view the status and verify connectivity of all DLCIs on a port (in addition to those configured in the network performance database).
An ASE in promiscuous mode automatically detects Frame Relay circuits. DLCI status information is based on the circuit table stored in the ASE.
LMI is a polling protocol between the Frame Relay Access Device (FRAD) and the network for exchanging information about the status of the interface and its defined PVCs. The window provides DLCI status according to the last LMI message from the ASE, which is initiated when you (or a user at any PAC) request circuit details.
For Frame Relay-based and HDLC-based IP Transport ASEs, click the IP tab in the Circuit Details window to view IP circuit status and verify connectivity.
Note
Figure 6-15 Circuit Details Window—Frame Relay-based IP Transport ASE
Table 6-21 describes Circuit Details window information and options.
Table 6-21 Circuit Details—Frame Relay and IP Transport
Site
Name of site.
Access Line
Name of access line on network.
Number of Circuits
Total number of configured circuits.
Number of Active Circuits
Number of circuits with active status.
LMI Type
(Frame Relay only) LMI type in use by the ASE on this port. Values are Annex A, Annex D, or LMI. The Circuit Details window displays "--" to indicate the ASE is not in LMI mode.
Last Full Status
(Frame Relay only) Number of seconds, minutes, and hours that have elapsed since the last LMI message was read. The Circuit Details window displays "--" to indicate the ASE is not in LMI mode.
DLCI IP Circuit
DLCI number for Frame Relay ASE or IP circuit name for IP Transport ASE.
State
State value for each DLCI or IP circuit—either Active or Inactive.
CIR (kbps)
Committed information rate (CIR) in kilobits per second of each DLCI, when available.
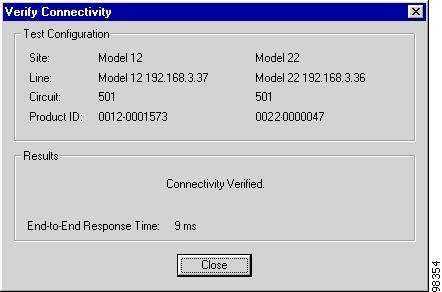
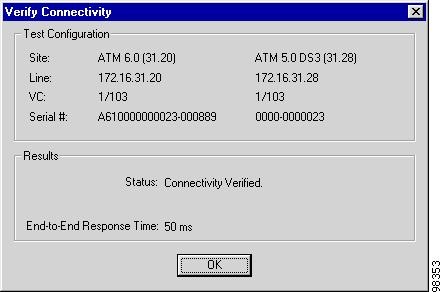
Verify Connectivity
Perform an immediate test of end-to-end PVC connectivity on a selected, active DLCI or IP circuit. See the "Verifying Connectivity" section.
ATM and ATM-based IP Transport ASEs
For Multi-Protocol ATM ASEs and ATM-based IP Transport ASEs, click Circuit Details on the Access Channel Summary view to display a list of all VCs configured for that access line, the state (active or inactive) and the nominal transmission rate (in cells/second) of each VC.
For ATM-based IP Transport ASEs, you can access and verify connectivity of AAL-5 and IP circuits. For more information on window fields, see Table 6-22.
Figure 6-16 Circuit Details Window—ATM or IP Transport ASE
Table 6-22 provides a description of this window for AAL-5 circuits.
Table 6-22 Circuit Details Window Description—ATM
VPI/VCI
Defined VPI/VCI for the circuit.
State
Operational status for each VPI/VCI—either Active or Inactive.
Nominal Rate
Nominal data rate (cells per second for VPI/VCI), when available.
Verify Connectivity
Performs an immediate test of end-to-end VC connectivity on a selected, active VC. For ATM, this is active only for AAL-5 circuits. See the "Verifying Connectivity" section.
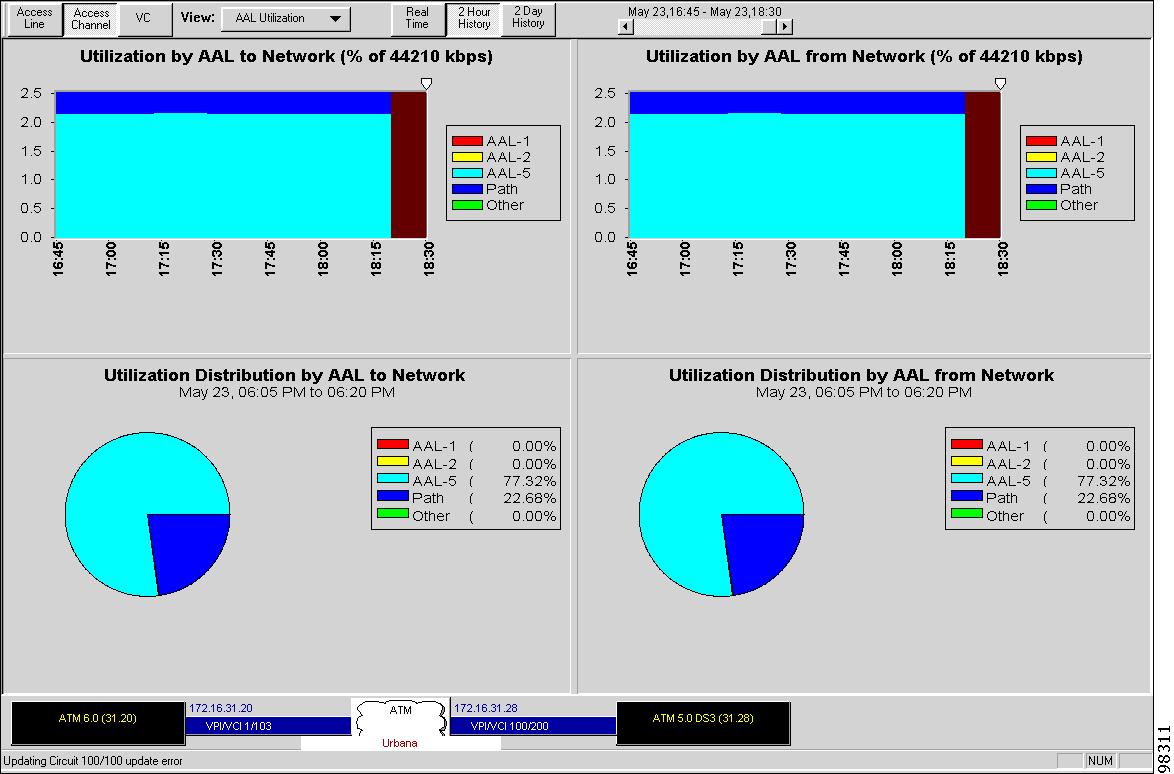
ATM AAL Utilization
The ATM AAL Utilization view is available for ATM ASEs and supported partner devices. The view displays AAL utilization as a percent of line speed for AAL-1, AAL-2, AAL-5, Other, and Path (virtual path). Other indicates a VC with an adaptation layer type other than AAL-1, AAL-2, or AAL-5 has been detected a VC on the line.
The view also presents the same data as a percentage distribution of network traffic. The display provides both to and from network perspectives.
Figure 6-17 Access Channel AAL Utilization View
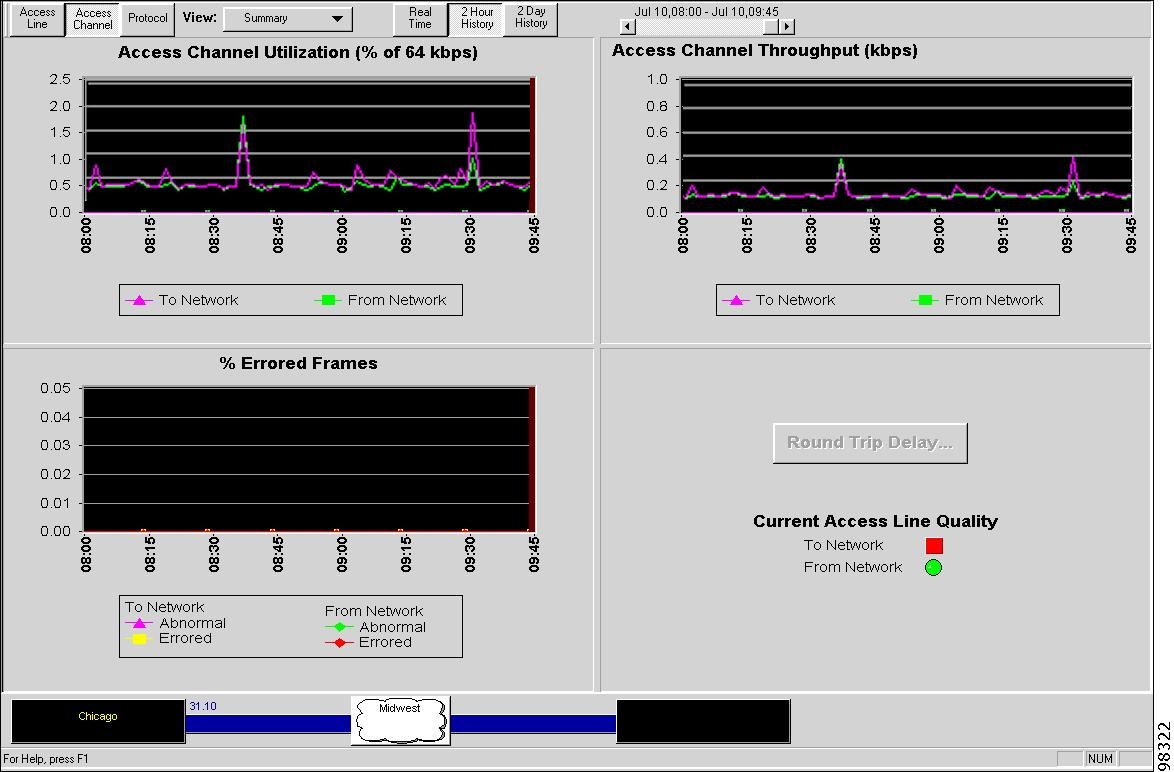
HDLC and HDLC-based IP Access Channel Summaries
The HDLC Access Channel Summary presents a graphical view of utilization and error conditions in the access channel of your HDLC network. In the view, three related graphs are color coded to indicate the direction of traffic. The upper left graph shows the percentage of channel utilization, the upper right graph shows the channel throughput, and the lower left graph shows the percentage of errored frames.
Figure 6-18 HDLC Access Channel Summary View—Single-Ended
Status indicators in the lower right pane show access line quality to and from the network. The indicators reflect the current channel status in real time. They change shape and color based on the access line condition:
•
•
•
Opening an HDLC Access Channel Summary View
Step 1
Step 2
Table 6-23 Access Channel Summary View—Multi-Protocol HDLC
Access Channel Utilization
Displays access channel usage as a percentage of access channel speed. Utilization is calculated as:
[(octets received during measurement interval) x 8 x 100%] ÷ [(access channel rate) x (measurement interval duration)]
Octets received includes header, FCS, and information field.
Access Channel Throughput
Displays access channel throughput in kilobits per second.
% Errored Frames
Indicates errored frame activity in both directions on the access channel. Abnormal Frames are aborted, too short, or too long frames. These are often a sign of improper equipment configurations. Errored Frames have an FCS or octet alignment error, and can indicate equipment failure or an underlying transmission impairment.
Current Access Line Quality State
Green: no transmission impairments occurred during the current measurement interval.
Red: transmission impairments occurred during the current measurement interval. (Note, this is likely a physical layer problem. Diagnose such problems in the Access Line Summary view.)
Round Trip Delay
Plots the RTD for each second during a 15-minute interval. A flat horizontal yellow line graphs the prior two week average RTD for comparison purposes. Available only for end-to-end circuits. See the "Viewing Round Trip Delay Information" section.
Viewing Access Channel Data for IP Transport ASEs
Cisco WAPMS provides the following views of IP access channels:
•
•
•
•
The Protocols, Top Talkers, IP CoS Summary, and IP CoS Threshold views are discussed in this section.
Note
IP Access Channel Protocols
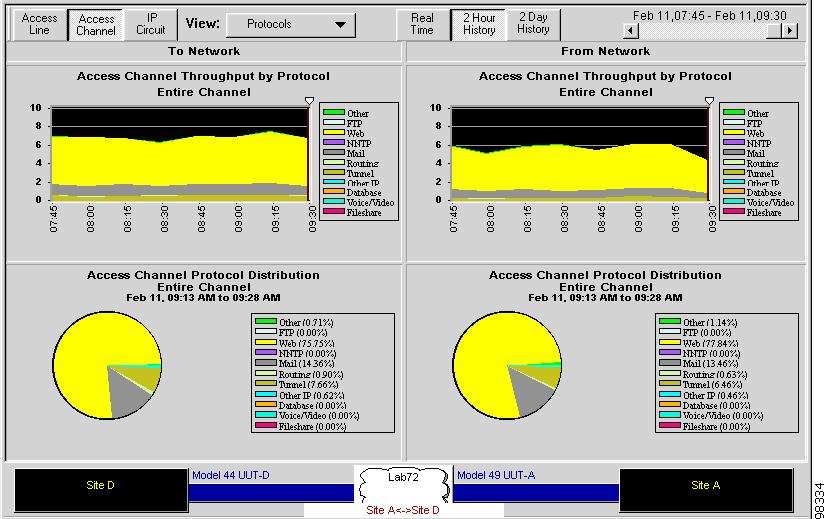
The Access Channel Protocols view for IP Transport ASEs shows data sent from the ASE for the entire channel and each defined class of service. Stacked area graphs show throughput by protocol for the entire channel or selected class to and from the network. Pie charts show the distribution of configured protocols on the channel or selected class (in percentages) to and from the network. Graphs can be viewed in 2-hour, 2-day or real-time. For more details, see Table 6-24.
Protocols are those selected for the ASE in the Network Configuration window. For more information on protocol selection, see the "Protocols" section.
Figure 6-19 IP Access Channel Protocols—Entire Channel Selected
Opening an IP Transport Access Channel Protocols View
Step 1
Step 2
Step 3
Table 6-24 describes the contents of the resulting view.
Top Talkers
The Access Channel Top Talkers view for IP Transport ASEs shows the top five host IP addresses that have sent the most traffic over the monitored access channel. Stacked area graphs at the top of the view show throughput by protocol for the entire channel.
Protocols are those selected for the ASE in the Network Configuration window. For more information on protocol selection, see the "Protocols" section.
Figure 6-20 IP Access Channel Top Talkers
Opening an IP Transport Access Channel Top Talkers View
Step 1
Step 2
Table 6-25 describes the contents of the resulting view.
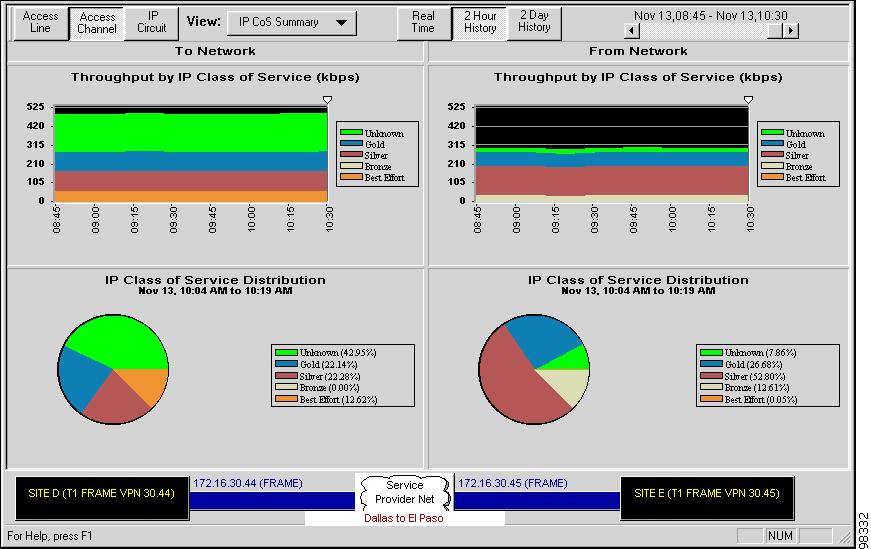
IP Access Channel CoS Summary
The IP Class of Service (CoS) Summary view displays two sets of graphs. Stacked area graphs show throughput by class of service (in kilobits per second) to and from the network. Pie charts show the distribution of IP traffic by classes (in percentages) to and from the network. See Table 6-26 for a description of each display. This view is available only when at least one class of service is configured.
In this and other class of service views, classes are identified by set colors, so a class identified by blue in one graph is identified by blue in another. Graphs can be viewed in 2-hour, 2-day, or real-time increments.
Figure 6-21 IP Access Channel CoS Summary
Opening an IP Transport Access Channel IP CoS Summary View
Step 1
Step 2
Table 6-26 describes the contents of the resulting view.
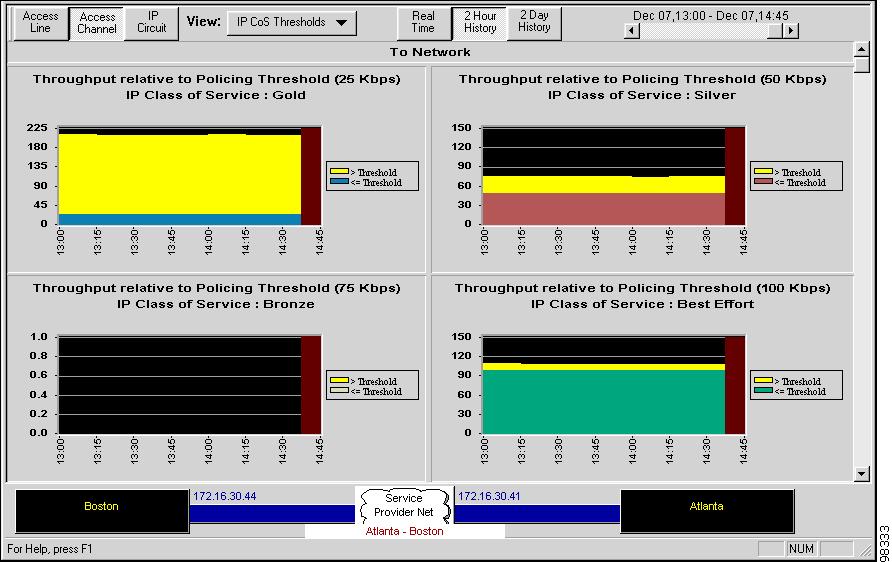
IP Access Channel CoS Thresholds
The IP Class of Service (CoS) Threshold view shows throughput to the network as it relates to the specific policing thresholds for each class of service defined on the IP access channel. The policing threshold is the upper limit assigned to a class of service as part of a service level agreement; traffic which exceeds this limit may not be guaranteed by a service provider.
This view shows up to eight classes of service (based on the number defined for the domain). Four graphs are viewable on the window at one time. When more than four classes of service are defined, scroll the window vertically to see results. Graphs can be viewed in 2-hour, 2-day, or real-time increments. The view is available only when at least one class of service is configured.
In this and other class of service views, classes are identified by set colors, so a class identified by blue in one graph is identified by blue in another. Areas in yellow for each graph indicate throughput above the policing threshold.
Figure 6-22 IP Access Channel CoS Threshold
Opening an IP Transport Access Channel IP CoS Threshold View
Step 1
Step 2
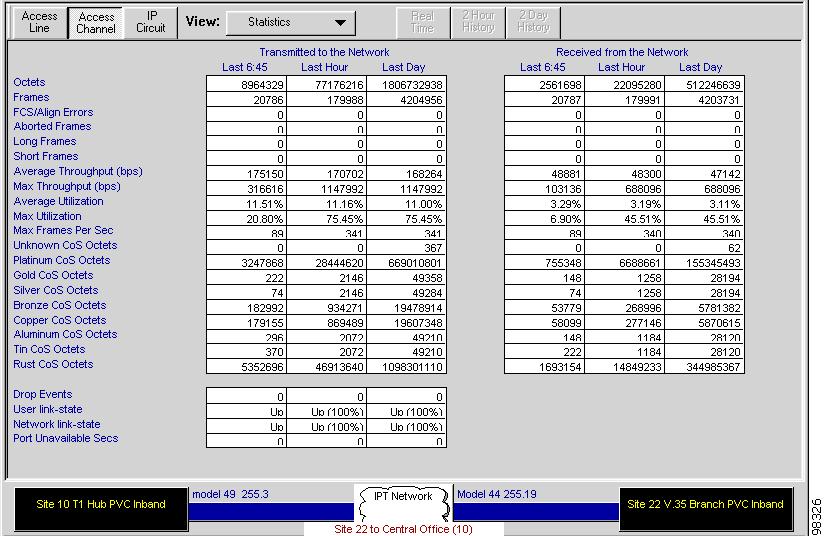
Access Channel Statistics
The Access Channel Statistics view shows utilization and error conditions of your WAN connections in table format.
The view contains three-column tables depicting to and from network statistics for different time periods. Real-time statistics (in the first column) accumulate for 15 minutes and are reset to zero at the end of each 15-minute interval. Statistic counts from the first column are rolled into the second, and counts from the second column into the third.
Statistics displayed in the resulting view vary based on link layer type.
Figure 6-23 Access Channel Statistics View—Frame Relay-based IP Transport ASE
Opening the Access Channel Statistics View
Step 1
Step 2
Multi-Protocol Frame Relay and HDLC Access Channel Statistics
Table 6-27 describes the statistics displayed in the view for Frame Relay and HDLC channels.
IP Access Channel Statistics
In addition to displaying the same set of statistics as the Frame Relay and HDLC Access Channel statistics views, for Frame Relay-based IP Transport ASEs the IP Access Channel statistics view provides data on each configured class of service. The total unknown class of service octets and the number of octets for each class is displayed in last 15-minute, last hour, and last day increments. For information on other statistics, see Table 6-28.
For ATM-based IP Transport ASEs, see the "ATM Access Channel Statistics" section
ATM Access Channel Statistics
Table 6-28 describes the statistics displayed in the view for ATM access channels.
Viewing Frame Relay Circuit Data
Cisco WAPMS provides the following views of Frame Relay circuits:
•
•
The PVC Summary, Protocols, Congestion, and Statistics views are discussed in the following sections.
You can view circuit troubleshooting data for single-ended Frame Relay circuits, PVC end-to-end circuits (Frame Relay-to-Frame Relay), and mixed circuits (Frame Relay-to-ATM). For end-to-end circuits, the left side of the Troubleshooting window displays near-end circuit data; the right side displays far-end circuit data. For single-ended circuits (near-end only), the graphs display data from the vantage point of the network: data transmitted to the network (from the ASE) is shown on the left; data transmitted from the network (to the ASE) is shown on the right.
PVC Summary
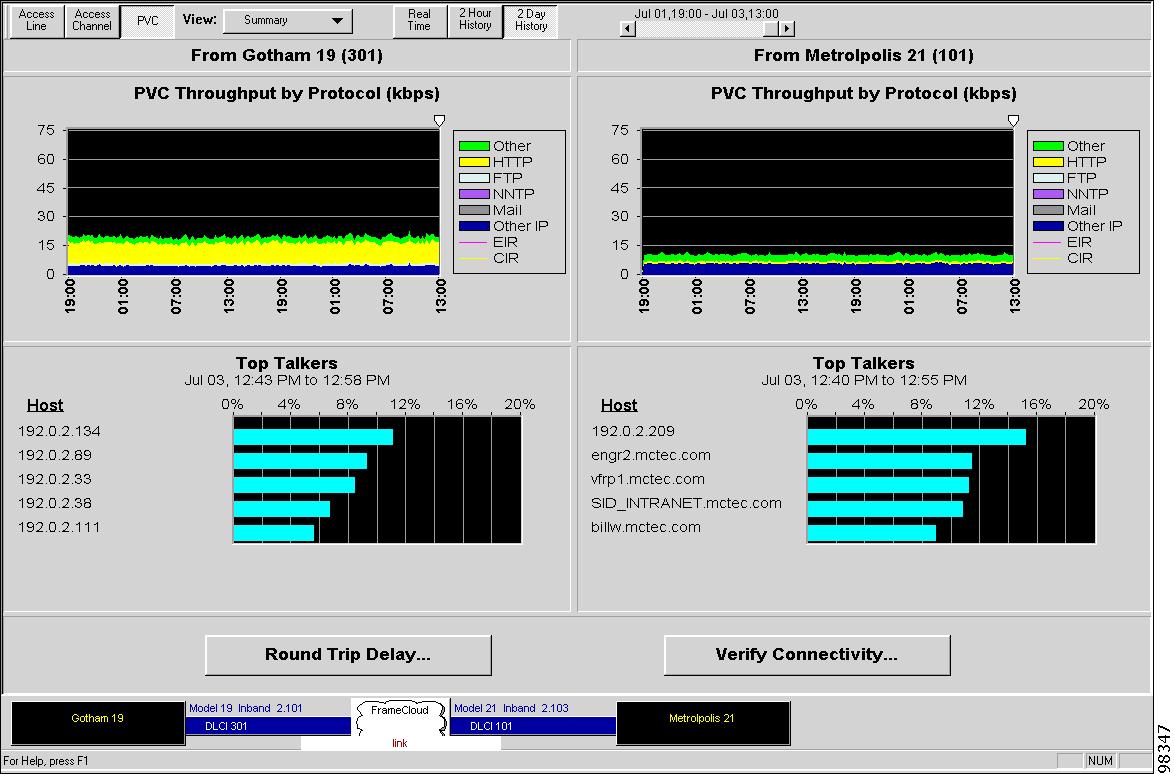
The PVC Summary view graphically displays throughput and utilization patterns in the selected PVC of your Frame Relay network. It contains two sets of graphs: The top two graphs show throughput by protocol, as configured for the ASE in the Network Configuration window. (See the "Protocols" section.) The lower two graphs list up to five "Top Talkers,"—hosts carrying the most activity—by host name/address, shown as a percentage of total utilization. (See Figure 6-24.)
For a Frame Relay-to-Frame Relay or a Frame Relay-to-ATM end-to-end circuit, the two sets of graphs are repeated: the left set displays data for traffic from the near-end DLCI to the network, and the right set displays data for traffic from the far-end DLCI or VC to the network. For an end-to-end PVC circuit, the Verify Connectivity button is displayed. For a full PVC end-to-end circuit, the Round Trip Delay button is displayed.
At the bottom of the view, click the Round Trip Delay and Verify Connectivity buttons to access additional circuit information. (See the "Viewing Round Trip Delay Information" section and the "Verifying Connectivity" section.)
Note
Figure 6-24 Frame Relay PVC Summary View (Frame-to-Frame Circuit)
When your PVC circuit has a near-end only, the Summary view differs in the following ways:
•
•
•
Note
Opening the PVC Summary View
Step 1
Step 2
Table 6-29 describes the contents of the resulting view.
PVC Protocols
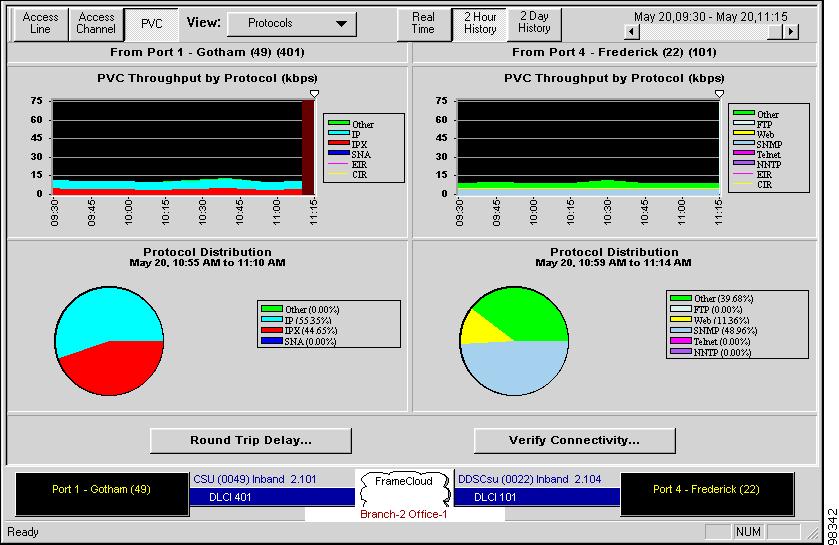
The PVC Protocols view displays throughput and distribution by protocols, as configured for the ASE in the Network Configuration window. (See the "Protocols" section.)
For an end-to-end PVC circuit or a Frame Relay-to-ATM circuit, the PVC Protocols view contains four graphs. The top two graphs indicate throughput (shown in kilobits per second) by protocol from each of the two access lines (near-end and far-end) to the network. When the ASE cannot discriminate throughput by protocol, the top two graphs indicate total throughput. The two pie charts indicate the distribution of the protocols relative to each access line's total throughput.
Figure 6-25 Frame Relay PVC Protocols View
When your PVC circuit is single-ended (no far-end DLCI), the Summary view differs in the following ways:
•
•
•
At the bottom of the view, click the Round Trip Delay and Verify Connectivity buttons to access additional circuit information. (See the "Viewing Round Trip Delay Information" section and the "Verifying Connectivity" section.)
Viewing a PVC Protocols View
Step 1
Step 2
PVC Congestion
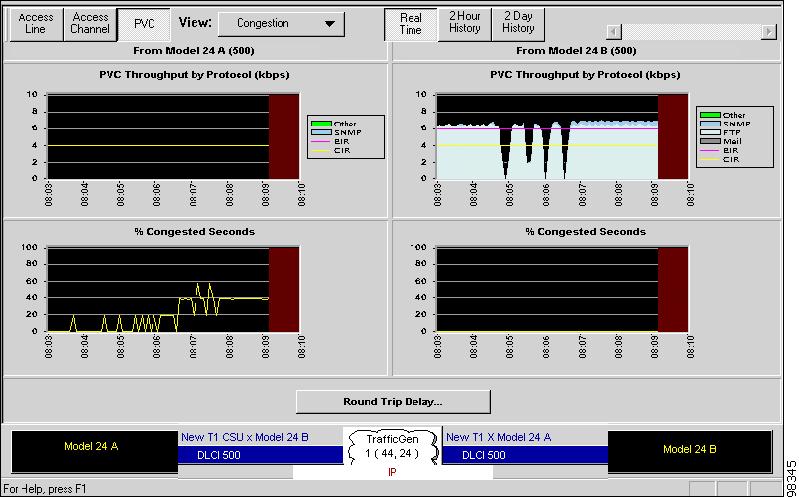
The PVC Congestion view shows congestion on the Frame Relay circuit. Congestion is defined as any one-second interval during which an ASE detects frames with either of the congestion bits set as positive. Congestion bits are FECN (forward explicit congestion notification) to the network and BECN (backward explicit congestion notification) from the network.
For an end-to-end PVC circuit or a mixed circuit (Frame-to-ATM), the PVC Congestion view contains four graphs. The top two graphs indicate throughput by protocol for the PVC near-end on the left and the PVC or VC far-end on the right. Displayed protocols are those configured for the ASE in the Network Configuration window. The bottom two graphs indicate congestion for the PVC near-end on the left and the far-end PVC or VC on the right. See Figure 6-26.
Figure 6-26 Frame Relay PVC Congestion View
For an end-to-end PVC circuit, click Round Trip Delay and Verify Connectivity buttons to access additional circuit information. (See the "Viewing Round Trip Delay Information" section and the "Verifying Connectivity" section.) Round Trip Delay is unavailable for Frame-to-ATM circuits, and both may not be available for partner devices.
When the circuit is configured as a near-end PVC only, the Congestion view differs in the following ways:
•
•
•
When troubleshooting congestion, see also the congestion-related reports in the Planning and Reporting Toolset. (See "Planning and Reporting.")
Opening the PVC Congestion View
Step 1
Step 2
PVC Statistics
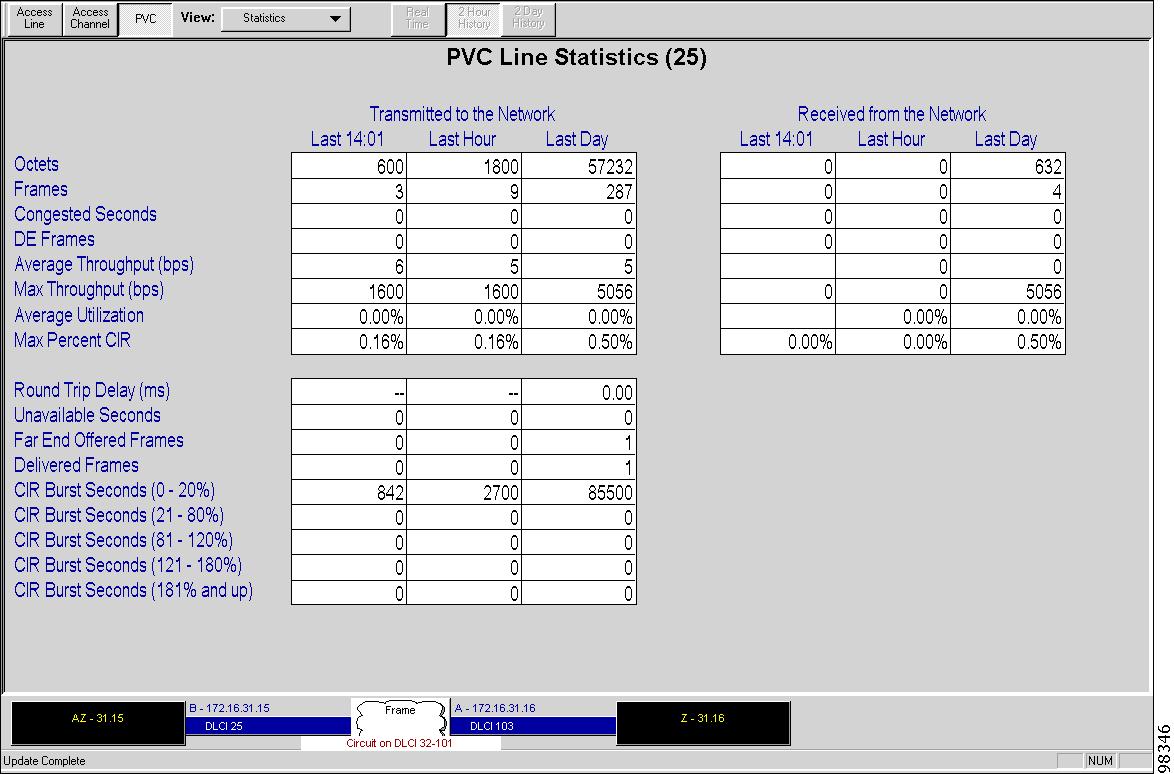
The Frame Relay PVC Statistics view presents circuit throughput and error conditions in table format.
The PVC Statistics view contains two three-column tables depicting to and from the network statistics for different time periods. Real-time statistics (in the first column) accumulate for 15 minutes and reset to zero at the end of each 15-minute interval. Statistic counts from the first column are rolled into the second, and counts from the second column are rolled into the third.
Figure 6-27 Frame Relay PVC Statistics View
Opening the PVC Statistics View
Step 1
Step 2
Table 6-30 describes the statistics displayed in this view.
Viewing IP Circuit Data
Cisco WAPMS provides the following views of IP circuits:
•
IP Circuit Summary
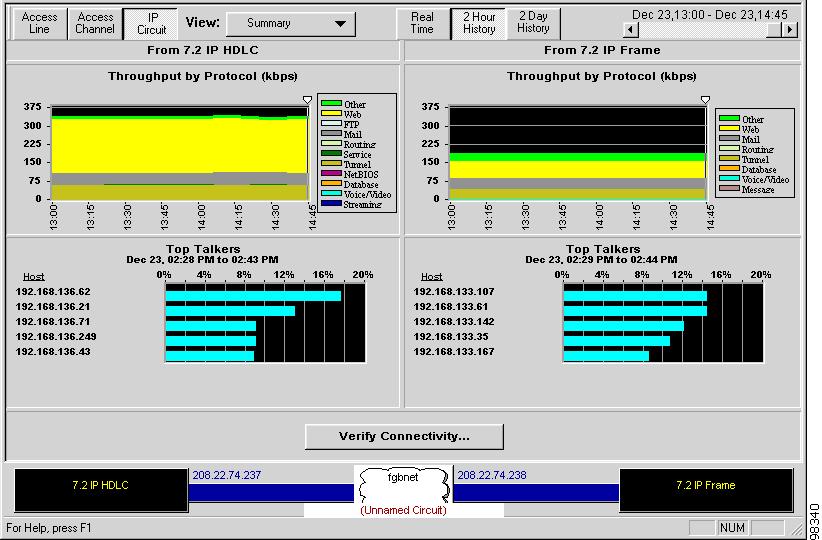
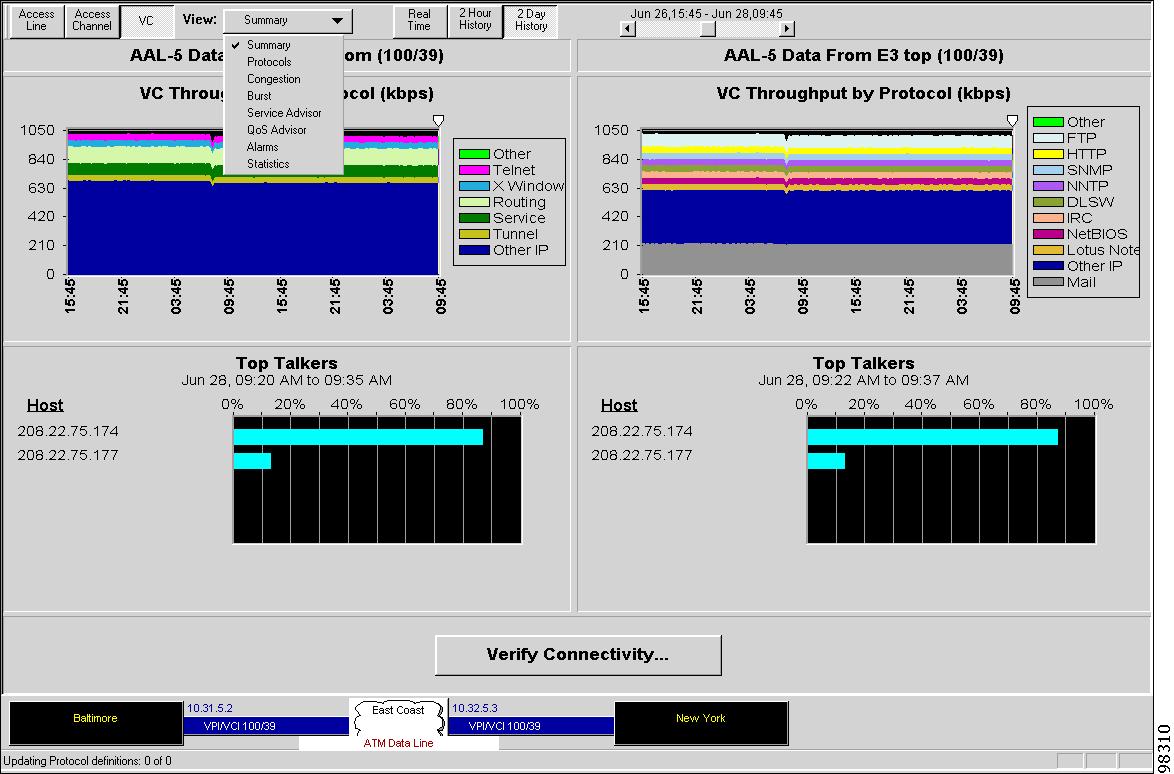
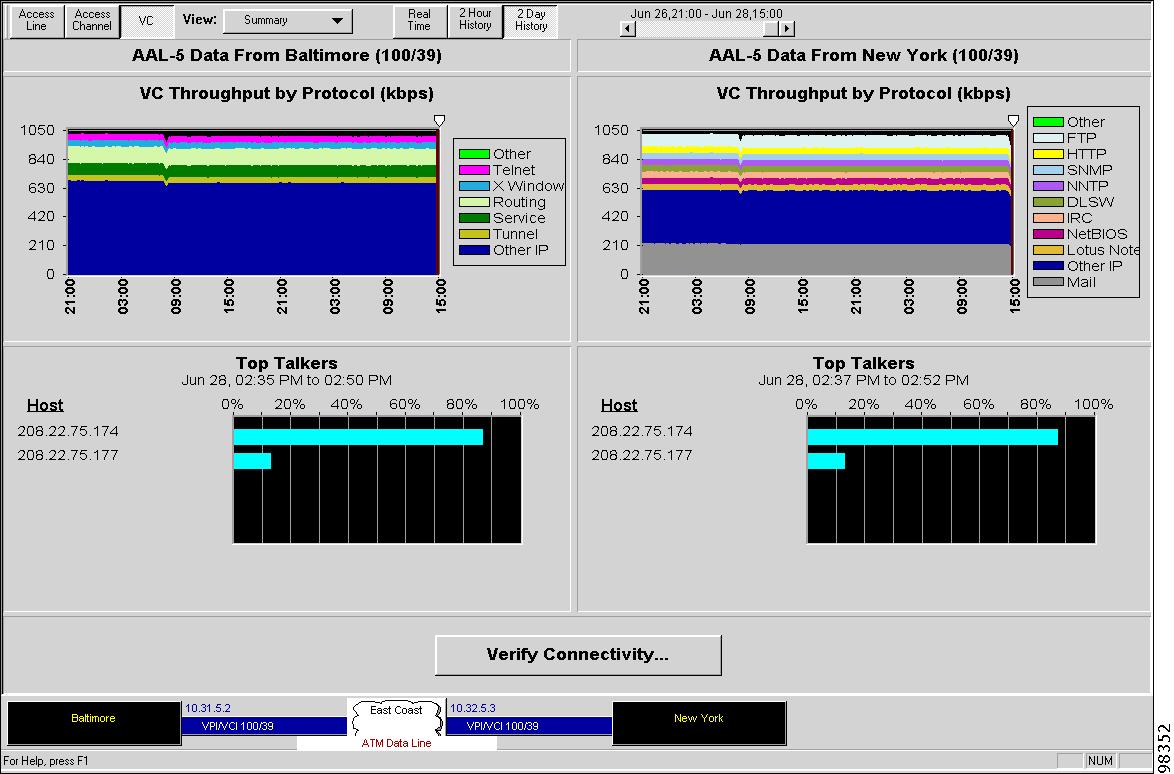
The IP Circuit Summary view displays two sets of graphs. Stacked area graphs show throughput by protocol in kilobits per second for the near and far end sites of the circuit. Bar graphs show the IP addresses of "Top Talkers" from the near and far end sites—hosts on the network who have sent the most traffic over the circuit. Graphs can be viewed in 2-hour, 2-day, or real-time increments.
For throughput by protocol for each site, up to ten IP and network layer protocols are displayed; these match the protocols displayed on the Access Channel Protocols view. Protocols listed are those configured for the ASE in the Network Configuration window. For more information, see the "Protocols" section.
The IP Circuit Summary view is identical to the Frame Relay PVC Circuit Summary view. See the "PVC Summary" section.
Figure 6-28 IP Circuit Summary View
Opening the IP Circuit Summary View
Step 1
Step 2
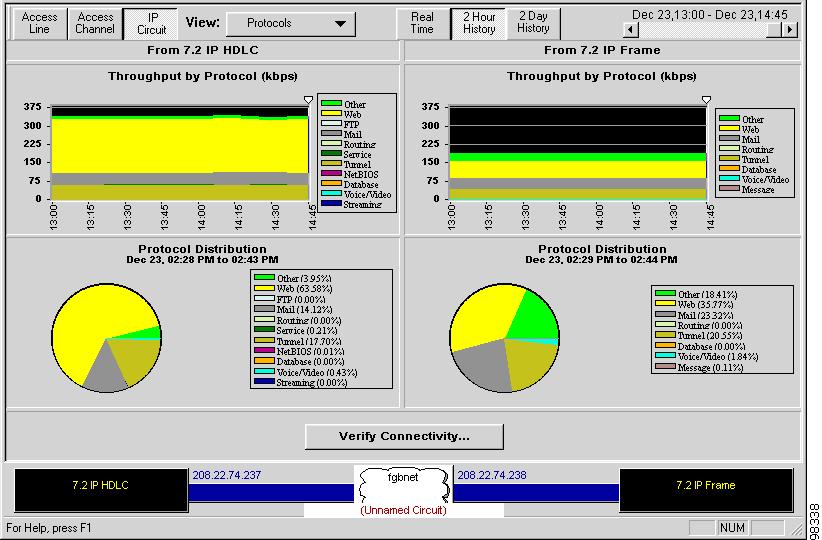
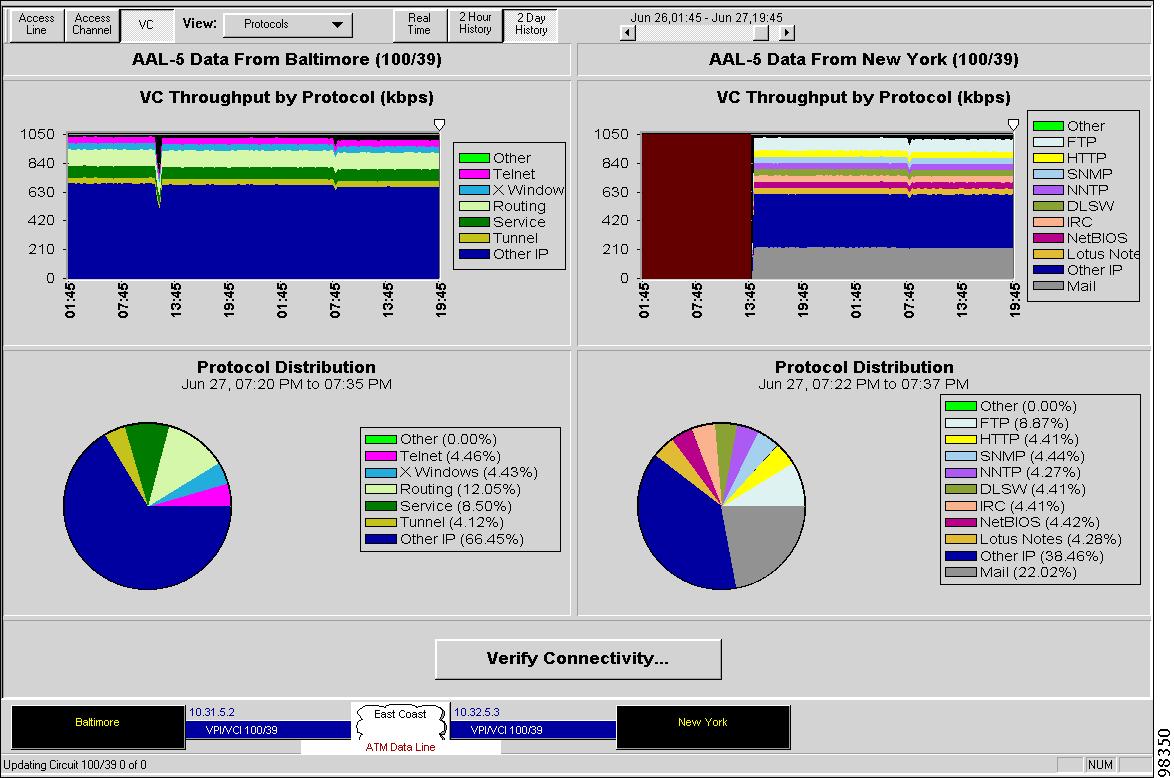
IP Circuit Protocols
The IP Circuit Protocols view contains two sets of graphs. Stacked area graphs show throughput by protocol (in kilobits per second) for the near and far ASEs on the circuit. Pie charts show the distribution of usage by protocol for each site.
For Throughput by Protocol for each site, up to ten IP and network layer protocols are displayed; these match the protocols displayed on the Access Channel Protocols view. Protocols listed are those configured for the ASE in the Network Configuration window. For more information, see the "Protocols" section.
The IP Circuit Protocols view is identical to the Frame Relay PVC Circuit Protocol view. See the "PVC Protocols" section.
Figure 6-29 IP Circuit Protocols
Opening the IP Circuit Protocols View
Step 1
Step 2
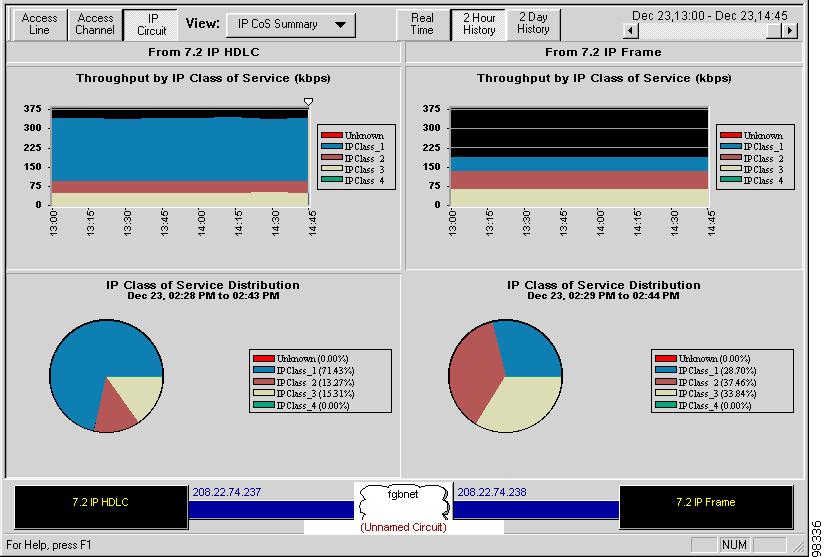
IP Circuit CoS Summary
The IP Circuit CoS Summary view contains two sets of graphs. Stacked area graphs show throughput by each defined class of service (in kilobits per second) for the near and far ASEs. Pie charts show the distribution of IP class of service usage by class for each site.
Figure 6-30 IP Circuit CoS Summary
Opening the IP Circuit CoS Summary View
Step 1
Step 2
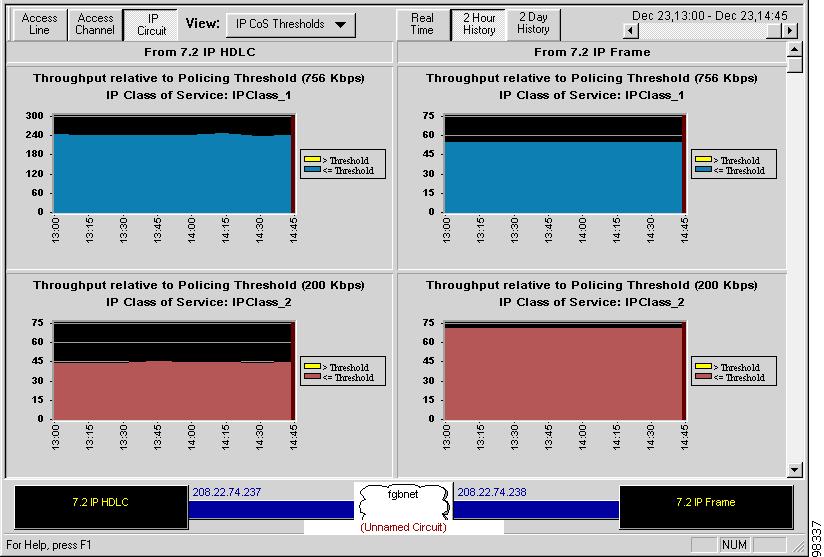
IP Circuit CoS Thresholds
The IP class of service (CoS) Threshold view displays stacked area graphs showing throughput relative to policing threshold for each defined class of service (in kilobits per second) for the near and far ASEs on the circuit. The policing threshold is the upper limit assigned to a class of service as part of a service level agreement; traffic which exceeds this limit may not be guaranteed by a service provider.
In this and other class of service views, classes are identified by set colors, so a class identified by blue in one graph is identified by blue in another. Areas in yellow for each graph indicate throughput above the policing threshold.
Note
Figure 6-31 IP Circuit CoS Thresholds
Opening the IP Circuit CoS Threshold View
Step 1
Step 2
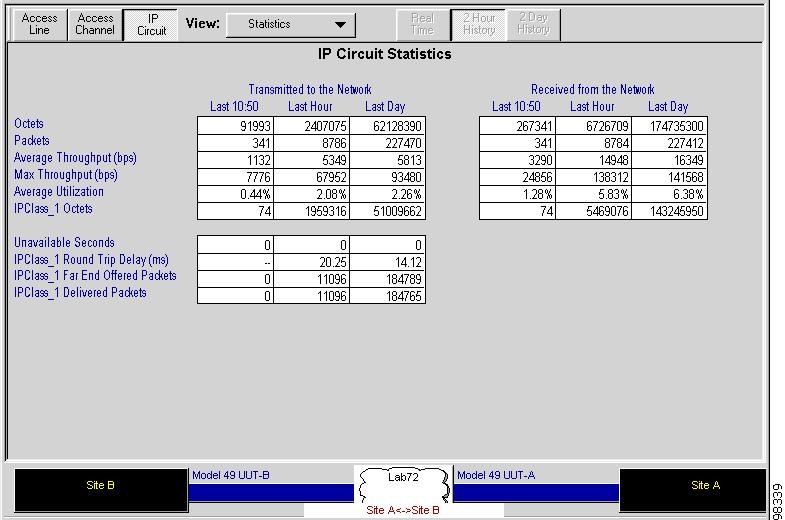
IP Circuit Statistics
The IP Circuit Statistics view presents circuit throughput and error conditions in table format for individual classes of service on the IP circuit.
The upper left table shows statistics for data transmitted to the network, and the upper right table shows data transmitted from the network. The lower right table shows service level agreement statistics. Each table contains three columns covering different time periods. The first column shows real-time statistics, which accumulate for 15 minutes and are reset to zero at the end of each 15-minute interval. The second column shows statistic counts rolled from the first for the last hour. The third column shows counts rolled from the second column for the last day.
Note
Opening an IP Circuit Statistics View
Step 1
Step 2
Step 3
Table 6-31 describes the statistics displayed in the resulting view.
Figure 6-32 IP Circuit Statistics
Viewing ATM Circuit Data
Cisco WAPMS provides the following views of ATM circuits:
•
•
This section describes the Summary, Protocols, Congestion, QoS Advisor, Alarms, and Statistics views.
Note
You can view circuit troubleshooting data for ATM single-ended circuits, ATM-to-Frame Relay circuits, and ATM-to-ATM circuits. However, the type of ATM ASE—Cisco WAPMS, Virtual ASE, or partner device—chosen for the near-end circuit determines which views are available in the Troubleshooting circuit perspective (see Figure 6-33).
For an end-to-end circuit, the left side of the view displays near-end circuit data; the right side displays far-end circuit data. For a single-ended circuit, graphs display data for that site from the vantage point of the network: data transmitted to the network (from the ASE) is shown on the left; data transmitted from the network (to the ASE) is shown on the right.
Figure 6-33 Circuit View Availability—ATM ASEs
Table 6-32 lists the views that are available for ATM ASEs configured in mixed networks (ATM and Frame Relay).
Table 6-32 ATM Circuit Troubleshooting Views
ATM ASE
Summary, Protocols, Congestion, Burst, Service Advisor, QoS Advisor,1 Alarms,2 Statistics
Frame Relay ASE
Summary, Protocols, Congestion, Burst, Service Advisor, Statistics
Partner device
Varies depending on ASE supported capabilities
1 Available for ATM-to-ATM circuits on supported partner devices only.
2 Available for AAL-5 circuits only.
VC Summary
Graphs and data displayed for the Virtual Circuit (VC) Summary view vary for each view, based on the ASE type and version configured for the network. Table 6-33 shows how the VC Summary view displays data for ATM single-ended circuits, and for ATM-to-ATM and ATM-to-Frame Relay end-to-end circuits for ASEs.
Note
Figure 6-34 shows the VC Summary View for an ATM ASE to ATM ASE circuit.
Figure 6-34 VC Summary View—ATM ASE to ATM ASE Circuit
Opening the VC Summary View (ATM-to-ATM)
Step 1
Step 2
Table 6-33 describes the contents of the VC summary graphs in the resulting view.
Opening the VC Summary View (ATM-to-Frame Relay or Frame Relay-to-ATM)
Step 1
Step 2
See Table 6-33 for VC Summary graph contents.
Table 6-33 VC Summary View Displayed Data for ASEs
Single-ended
non-AAL-5 ATM ASE
VC Throughput: (Graph) Throughput (kbps), PCR, and SCR.
% Alarmed Seconds: (Graph) Percentage of available time during which Alarm Indication Signals (AISs) and Remote Defect Indicators (RDIs) were present on the network. An AIS notifies the receiving ASE that it is receiving corrupted data. An RDI notifies the originating ASE that data sent did not arrive intact.
Note
ATM ASE (AAL-5 type only)
VC AAL-5 Throughput: (Graph) VC AAL-5 throughput data by protocol to the network. This does not show PCR and SCR.1 , 2
VC Throughput: (Graph) Total traffic throughput from the network in kilobits per second.
Top Talkers: (Bar Chart) Circuits having the most activity by host name or address, showing the percentage of total utilization of the ASE to the network.
Verify Connectivity: Click to test connectivity of the ATM circuit.2
ATM-to-ATM
ATM ASE to ATM ASE (AAL-5 type only)
VC AAL-5 Throughput: (Graph) VC AAL-5 throughput data by protocol to the network. This does not show PCR and SCR.1, 2
Top Talkers: (Bar Chart) Circuits having the most activity by host name or address, showing the percentage of total utilization of the ASE to the network.
Verify Connectivity: Click to test connectivity of the ATM circuit.
Single-ended
non-AAL-5 ATM ASE
VC Throughput: (Graph) Throughput (kbps), PCR, and SCR.
% Alarmed Seconds: (Graph) Percentage of available time during which Alarm Indication Signals (AISs) and Remote Defect Indicators (RDIs) were present on the network. An AIS notifies the receiving ASE that it is receiving corrupted data. An RDI notifies the originating ASE that data sent did not arrive intact.
Note
1 These protocols are selected for the ASEs during network configuration. (See "Configuring ASEs" section.)
2 Available for AAL-5 circuits only.
VC Protocols
The VC Protocols view shows throughput and distribution by configured protocols for AAL-5-type ATM circuits. Protocols tracked are those configured for the ASE in the Network Configuration window. Table 6-34 explains how the VC Protocols view displays data for each combination of end-to-end circuit (ATM-to-ATM, ATM-to-Frame Relay) and ATM single-ended circuit for ASEs.
Note
Figure 6-35 shows the VC Protocols View for an ATM ASE to ATM ASE Circuit.
Figure 6-35 VC Protocols View— ATM ASE to- ATM ASE Circuit
Viewing a VC Protocols View
Step 1
Step 2
Table 6-34 VC Protocols View Displayed Data for ASE Versions
Single-ended (ATM ASE1 )
VC AAL-5 Throughput: (Graph) VC AAL-5 throughput data by protocol to the network.2
Protocol Distribution: (Pie Chart) Protocol distribution in terms of total percentage throughput to the network.
VC Throughput: (Graph) Throughput (kbps) to the network.
Verify Connectivity: Click to test connectivity of the ATM circuit.
ATM-to-ATM (ATM ASE to ATM ASE)
VC AAL-5 Throughput: (Graph) VC AAL-5 throughput data by protocol to the network for each ASE.
Protocol Distribution: (Pie Chart) Protocol distribution in terms of total percentage throughput to the network for each ASE.
Verify Connectivity: Click to test connectivity of the ATM circuit.
ATM-to-Frame Relay
VC AAL-5 Throughput: (Graph) VC AAL-5 throughput data by protocol to the network for the ATM circuit end.
PVC Throughput: (Graph) PVC throughput by protocol for the Frame Relay circuit end to the network.
Protocol Distribution: (Pie Chart) Protocol distribution in terms of total percentage throughput to the network for the ASEs.
Verify Connectivity: Click to test connectivity of the ATM circuit.
1 Available for AAL-5 circuits only.
2 These protocols are selected for the ASEs during network configuration. (See "Configuring ASEs" section.)
VC Congestion
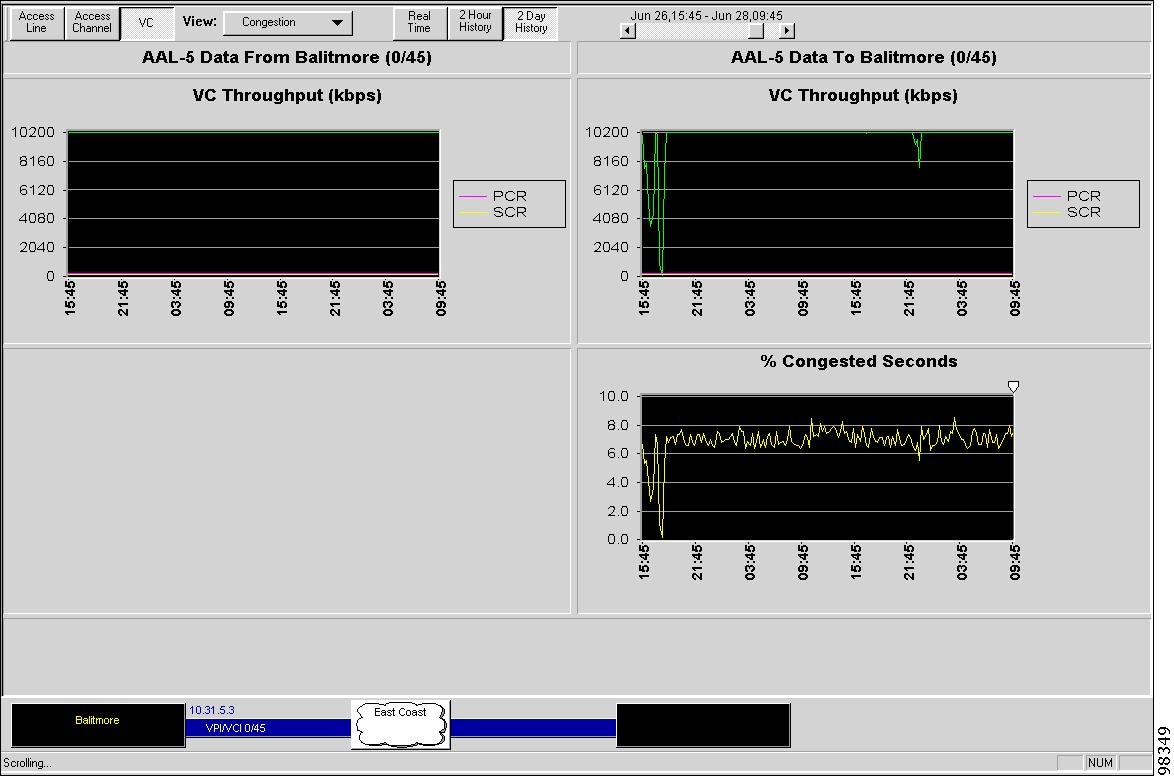
The VC Congestion view displays network traffic congestion information for an ATM circuit. For ATM, congestion is defined as the presence of the explicit forward congestion indicator (EFCI) detected in traffic coming in from the network. An ATM network sets the EFCI in the header of any passing ATM cell when it detects congestion. For a Virtual Path, congestion is defined as the detection of the presence of the EFCI for any VC in the path. Round Trip Delay is not available for the ATM VC Congestion view.
Table 6-35 shows how the VC Congestion view displays data for each combination of end-to-end circuit (ATM-to-ATM, ATM-to-Frame Relay) and ATM single-ended circuit for ASEs.
Note
Figure 6-36 shows the VC Congestion View for a single-ended ATM ASE circuit.
Figure 6-36 VC Congestion View: Single-ended ATM ASE Circuit
Opening a VC Congestion View
Step 1
Step 2
Table 6-35 VC Congestion View Displayed Data for ASE s
ATM-to-Frame Relay (ATM ASE)
Graph: VC throughput data by protocol for the ATM and Frame Relay circuit ends to the network.1
Graph: Congestion (to the network) as a percentage of seconds for the ATM circuit end of the circuit.
PVC Congestion: (Graph) Percentage of seconds of traffic to the network where the FECN bit was set to positive for the Frame Relay circuit end of the circuit.
Verify Connectivity: Click to test connectivity of the ATM circuit.
single-ended (ATM ASE)
VC Throughput: (Graphs) VC throughput data by protocol to and from the network.1
% Congested Seconds: (Graph) Percentage of seconds EFCI detected in traffic from the network.
Verify Connectivity: Click to test connectivity of the ATM circuit.
ATM-to-ATM (ATM ASE to ATM ASE)
VC Throughput: (Graphs) VC throughput data by protocol for the near-end and far-end of the circuit to the network.1
% Congested Seconds: (Graphs) Percentage of seconds EFCI detected in traffic going to the network for the near-end and far-end of the circuit.
Verify Connectivity: Click to test connectivity of the ATM circuit.
1 These protocols are selected for the ASEs during network configuration. (See "Configuring ASEs" section.)
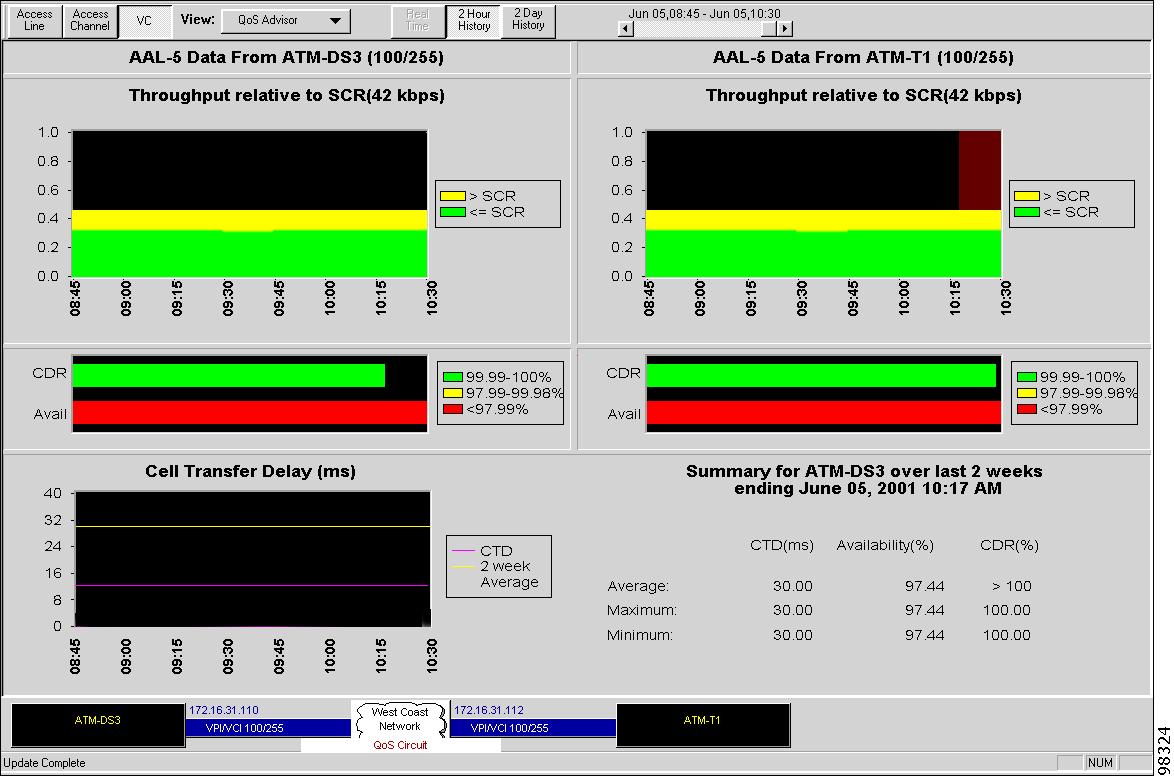
VC QoS Advisor
The VC QoS (Quality of Service) Advisor view is available for 2-hour and 2-day history time frame perspectives, and for ATM-to-ATM circuits on supported partner devices only.
The view contains five panes. A graph in the upper left shows circuit throughput relative to Sustained Cell Rate (SCR). A histogram shows percentage Cell Delivery Ratio (CDR) and the percentage circuit availability for the near-end ATM site. The graph and histogram are repeated for the far-end ATM site in the top two panes on the right.
Figure 6-37 VC QoS Advisor View
Throughput graphs show circuit throughput as a percentage of SCR to the network for each circuit end. The graphs also show the percentage throughput above SCR (in yellow) and below SCR (in green) over the time interval you choose using the historical scroll bar. You set the SCR in cells per second for the circuit under Service Parameters in the VPI/VCI Configuration window in Network Configuration (see "Configuring VPI/VCIs and Paths" section). SCR is converted on the graph to kilobits per second.
The histograms have two indicators: one showing the percentage CDR between 99.99 and 100 percent in green, or 97.99 and 99.98 percent in yellow; another showing the percentage of circuit availability below 97.99 percent in red. The indicators reference the time frame you choose using the historical scroll bar, as shown in the x-axis of the Throughput graphs above.
The lower part of the view shows Cell Transfer Delay (CTD) in milliseconds over the time interval you choose using the historical scroll bar. The graph also displays the last two-week average CTD (in yellow) as a reference. The y-axis of the graph automatically scales to the two week average so it always displays this reference parameter.
The lower right part of the view displays the last 2-week summary information (average, minimum, and maximum) for CTD (ms), availability (%), and CDR (%).
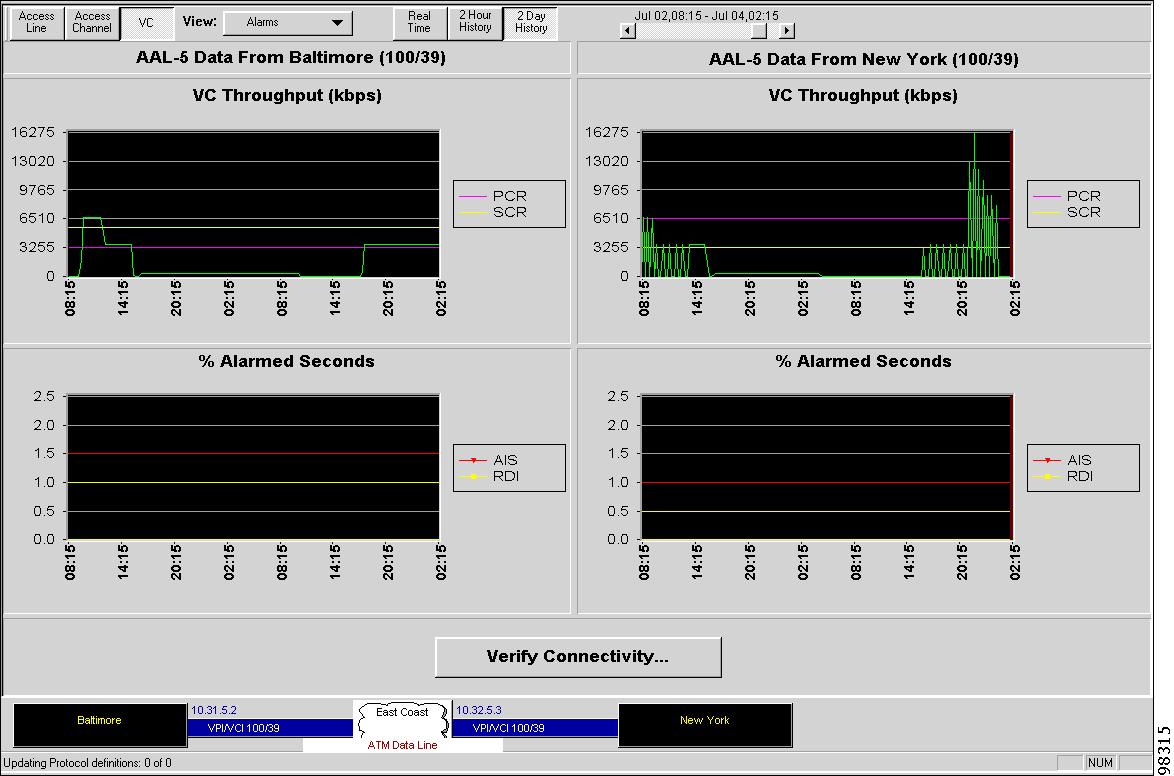
VC Alarms
The VC Alarms view is available for single-ended ATM, ATM-to-Frame Relay, or ATM-to-ATM circuits using ATM ASEs and supported partner devices. The ATM part of the circuit must use adaptation layer type AAL-5.
For an ATM-to-ATM circuit, graphs show VC throughput in kilobits per second) for the near-end and far-end of the circuit to the network, with Peak Cell Rate (PCR) and Sustained Cell Rate (SCR) as a reference. SCR and PCR are set for the circuit under Service Parameters in the VPI/VCI Configuration window in the Network Configuration window (see the "Configuring VPI/VCIs and Paths" section).
A second set of graphs plots the percentage of alarmed seconds that occurred for the ATM circuit, with Alarm Indication Signal (AIS) and Remote Defect Indication (RDI) as a reference.
For single-ended circuits, the view shows VC Throughput and % Alarmed Seconds graphs to the network on the left and from the network on the right.
For an ATM-to-Frame Relay circuit, the view shows VC throughput and % Alarmed Seconds for the ATM near-end of the circuit as described above, and PVC throughput by protocol for the Frame Relay circuit end (the lower right portion of the view is blank).
Figure 6-38 VC Alarms View—ATM AAL-5 End-to-End Circuit
Click the Verify Connectivity button to test the connectivity of the ATM circuit. For more information see "Verifying Connectivity" section.
Opening a VC Alarms View
Step 1
The VC must be configured to an ATM ASE or supported partner device.
Step 2
Table 6-36 describes the statistics displayed in the resulting view.
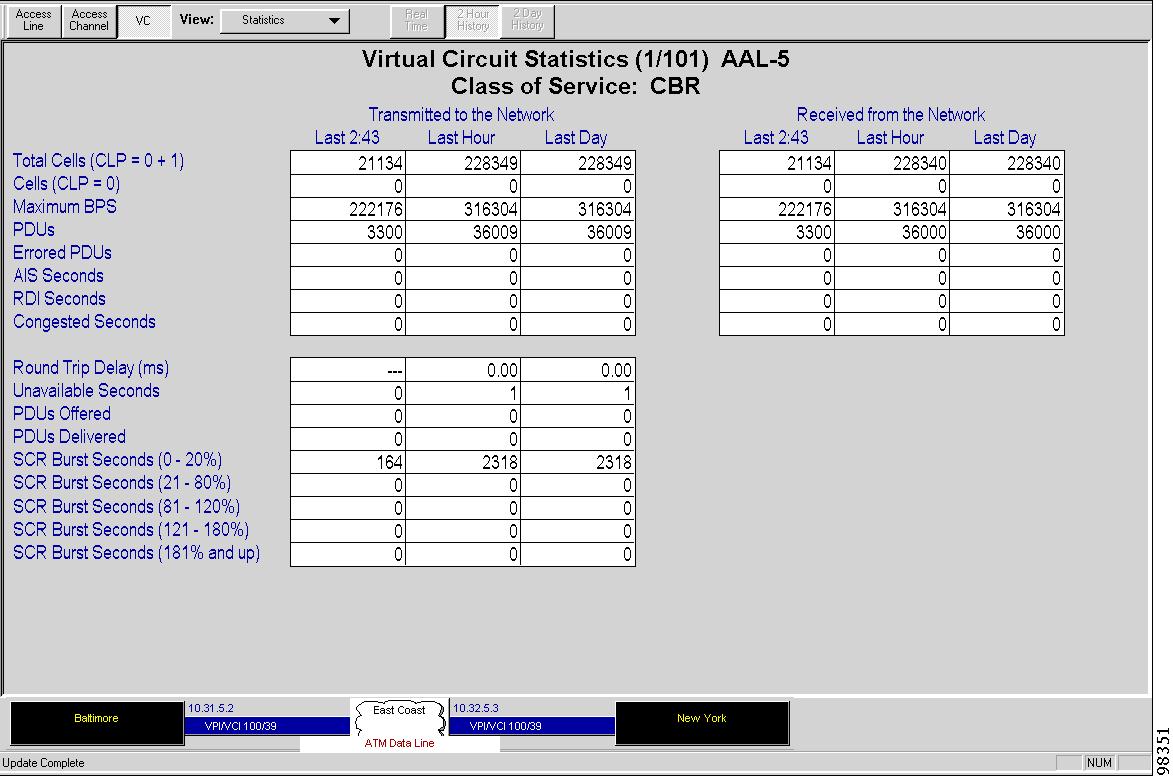
VC Statistics
The VC Statistics view presents circuit throughput and error conditions in data tables.
The view heading indicates whether the circuit is configured as an AAL-1, AAL-2, AAL-5 VC, or as a Virtual Path. The VC Statistics view contains three tables: the upper left shows statistics to the network, the upper right shows statistics from the network, and the lower table shows circuit analysis statistics, such as SCR/PCR Burst Seconds and Round Trip Delay. Available statistics depend on the type of ASE or supported partner device. For example, statistics, PDUs, Errored PDUs, PDUs Offered, and PDUs Delivered are available only for AAL-5 ATM circuits.
Figure 6-39 VC Statistics View for ATM AAL-5 End-to-End Circuit
CoS is specified when applicable (ATM to ATM and supported partner devices only).
Note
The To and From Network statistics tables contain three columns covering different time periods. The first column shows real-time statistics, which accumulate for 15 minutes and are reset to zero at the end of each 15-minute interval. The second column rolls statistic counts from the first column for the last hour. The third column rolls statistic counts from the second column for the last day.
For an ATM-to-ATM circuit where both circuit ends employ ATM ASEs or supported partner devices, burst statistics depend on the configured ATM class of service setting (see the "Configuring ATM Class of Service" section). When CoS is CBR, burst seconds are relative to PCR, and burst second ranges are:
•
•
•
•
For other (non-CBR) CoS, burst seconds are relative to SCR, and the burst second ranges are:
•
•
•
•
•
Custom defined CoS settings (available for partner devices) can determine whether the Burst Seconds is referenced to PCR or SCR.
Opening a VC Statistics View
Step 1
Step 2
Table 6-36 describes the statistics displayed in the resulting view.
Table 6-36 Circuit Statistics View—ATM VC
Total Cells (CLP = 0+1)
Total number of valid ATM cells seen on the virtual circuit (VC), including both CLP=0 and CLP=1 cells. Does not include idle cells.
Cells (CLP=0)
(Cell loss priority) Number of cells with CLP=0 seen on the VC. The cells are marked to be dropped in the event of network congestion.
Maximum BPS
Maximum throughput in bits per second for this VC during the measurement interval (derived from Total Cells).
PDUs1
Total number of AAL-5 Protocol Data Units (PDUs) detected on the VC during reassembly. Includes errored and non-errored PDUs.
Errored PDUs1
Number of errored AAL-5 PDUs detected on the VC during reassembly.
AIS Seconds
Number of seconds during the measurement interval for which Alarm Indication Signal (AIS) cells have been detected on this VC.
RDI Seconds
Number of seconds during the measurement interval for which Remote Defect Indicator (RDI) cells have been detected on this VC.
Congested Seconds
Number of seconds during the measurement interval in which cells with the congestion indication bit set have been detected on this VC.
Round Trip Delay
Number of milliseconds for a packet to travel to the far end and back in this end-to-end VC. Only valid RTD measurements are averaged, while invalid measurements are ignored. When this value is "---", no measurement has been taken.
Unavailable Seconds
Number of seconds the VC is unavailable.
Offered PDUs1
Number of PDUs offered on this VC during the measurement interval. When this value is 0, no statistic is available.
Delivered PDUs1
Number of PDUs delivered during the same measurement interval that Offered PDUs is counted. When this value is 0, no statistic is available.
Total Cells (CLP = 0+1)
Total number of valid ATM cells seen on the virtual circuit (VC), including both CLP=0 and CLP=1 cells. Does not include idle cells.
1 Available only for AAL-5 VCs.
Viewing Multi-Protocol HDLC Protocol Data
Cisco WAPMS provides the following views of HDLC protocol usage:
HDLC Protocol Summary
The Protocol Summary view shows a graphical view of throughput and utilization patterns for an HDLC link.
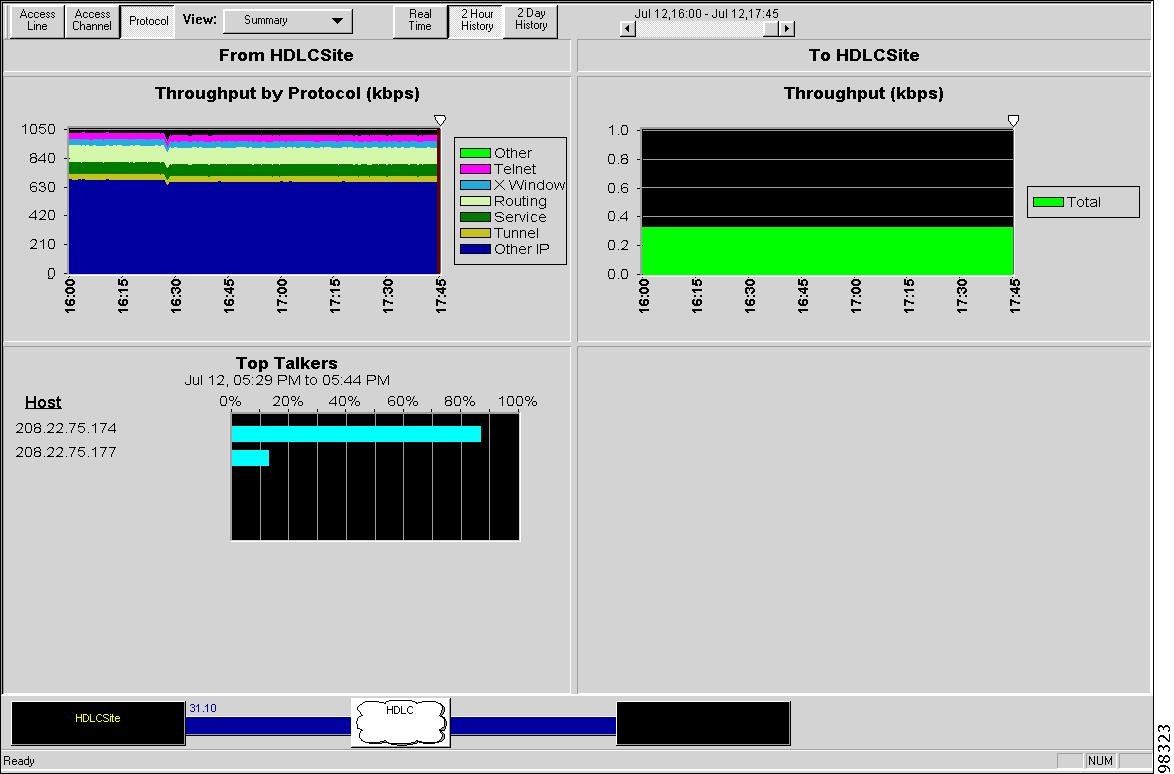
For an end-to-end HDLC circuit, the upper left graph shows throughput by protocol according to line speed (in kilobits per second) divided by protocol to the network of the near-end circuit. The lower left bar chart shows the Top Talker hosts—the top five most active hosts—by host name or address to the network. The measurement interval in the Top Talkers list title corresponds to the time selected by using the time cursor in the throughput graphs, or by using the Historical Scroll Bar, when in 2-hour or 2-day historical mode.
These graphs are repeated on the right to the network for the far-end of the circuit. Listed protocols were selected for the ASEs during Network Configuration. (See the "Configuring ASEs" section).
Top Talkers percentages are the number of octets transmitted by a host compared to the total number of octets transmitted. Cisco WAPMS attempts to resolve IP addresses to ASCII descriptors, using Domain Name Servers (DNS). Occasionally, the information needed to resolve an address is unavailable from the network. Such IP addresses are displayed in dotted-decimal notation. NetWare addresses are resolved to show the vendor-names portion of the MAC address.
When the HDLC circuit is single-ended, the left half of the view displays Throughput by Protocol and Top Talkers to the network as described above; the right half displays only total circuit throughput from the network. (See Figure 6-40.)
Figure 6-40 HDLC Protocol Summary View—Single-ended Circuit
Opening the Protocol Summary View for HDLC
Step 1
Step 2
HDLC Protocols
The HDLC Protocols view presents a graphical view of throughput and protocol distribution for an HDLC link.
For an end-to-end HDLC circuit, the upper left graph shows Throughput by Protocol according to line speed (in kilobits per second) by protocol to the network for the near-end circuit. The pie chart in the lower left shows protocol distribution in terms of total percentage to the network. These graphs are repeated on the right to the network for the far-end of the circuit. Protocols listed are those selected for the ASEs in the Network Configuration window. (See the "Configuring ASEs" task.)
When your HDLC circuit is single-ended, the upper left graph shows Throughput by Protocol and Protocol Distribution to the network as described above; the upper right graph shows only total circuit throughput from the network.
Opening the HDLC Protocol View
Step 1
Step 2
HDLC Protocol Statistics
The Protocol Statistics view presents HDLC circuit utilization by protocol in data tables. Protocols listed were selected for the ASEs during Network Configuration.
The Protocol Statistics view contains a single three-column table of statistics collected from the near-end ASE for different time periods. The first column shows real-time statistics, which accumulate for 15 minutes and are reset to zero at the end of each 15-minute interval. The second column rolls statistic counts from the first column for the last hour. The third column rolls statistic counts from the second column for the last day. Each statistic indicates the number of octets per protocol.
Opening a Protocol Statistics View for HDLC
Step 1
Step 2
Viewing Burst Data
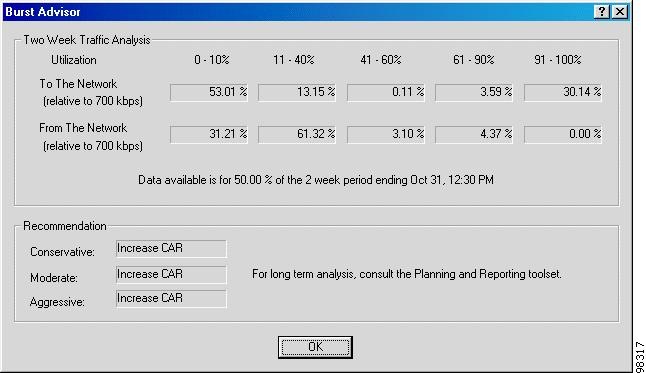
Use Burst views to analyze historical trends of network utilization so you can plan future network needs. The Troubleshooting Toolset provides Burst views for:
•
•
Burst views help you make accurate decisions about sizing channel speeds, Committed Information Rate (CIR) for PVCs, Committed Access Rate (CAR) for IP access channels, and Sustained Cell Rate (SCR) or Peak Cell Rate (PCR) settings for VCs and VPs. These settings critically affect circuit burst capability. They are available only for 2-hour and 2-day history modes, and represent utilization data with one-second granularity.
Data for all Burst view graphs and charts is displayed for 15-minute intervals you choose using the historical scroll bar or the time cursor in the Analysis of Utilization graphs. All Burst views display burst data in one-second granularity in 15-minute summaries.
Note
In both types of graphs, colors can range from green (indicating minimal utilization) to red (indicating high utilization).
Viewing Access Channel Burst Data
The Access Channel Burst view contains two types of utilization graphs indicating channel utilization for the near-end access channel. A stacked bar chart shows channel utilization relative to line speed for each second, and a pie chart displays how channel utilization is distributed in percentages (see Figure 6-41). Graphs on the left show burst data to the network; graphs on the right are repeated for the near-end access channel from the network.
The Access Channel Burst view presents data in terms of 0 to 100 percent of the total port speed.
Note
Figure 6-41 Access Channel Burst Analysis—IP Transport ASE
Viewing Circuit Burst Data
At the circuit level, Burst view graphs and bar charts are repeated; however, utilization analysis is relative to CIR (for PVC), or relative to SCR or PCR (for a VC or VP). The display of SCR or PCR is determined by the CoS setting you choose when you create the far-end mapping for an ATM-to-ATM circuit. See the "Configuring ATM Class of Service" section. For a single-ended ATM circuit or ATM-to-Frame Relay circuit, the graph is relative to SCR for AAL-5 circuits, and relative to PCR for non-AAL-5 circuits. The Burst Analysis view is not available for IP circuits, it is available only at the access channel.
To obtain a burst analysis view, click the Burst Advisor button.
Figure 6-42 VC Burst Analysis—ATM to- ATM Circuit
For ATM-to-ATM, Frame Relay-to-Frame Relay, or mixed ATM/Frame Relay circuits, the circuit level Burst views display both types of utilization charts to the network for each circuit end (near-end data on the left, far-end data on the right). For singled-ended circuits, the circuit Burst views show utilization data to the network only.
Using the Burst Advisor
The Burst Advisor analyzes traffic patterns and recommends actions for optimal network utilization. Based on your network configuration, it shows bandwidth, CIR for Frame Relay, CAR for IP, or SCR/PCR utilization statistics for ATM collected during the past two weeks. It also recommends bandwidth allocations based on this data.
To open the Burst Advisor, click the Burst Advisor button at the lower part of any Burst view. The Burst Advisor window is displayed.
Figure 6-43 Burst Advisor Results for IP
The Burst Advisor window has two panes:
Two Week Traffic Analysis—displays utilization to and from the network for five percentage segments over the past two weeks.
•
•
Recommendations—based on burst data, the Burst Advisor recommends increasing, decreasing, or not changing your bandwidth, CIR, CAR, SCR, or PCR. Recommendations are given in a conservative, moderate, and aggressive bandwidth utilization planning context.
•
•
•
When the circuit is configured as ATM-to-ATM using ASEs or supported partner devices, the Burst Advisor may recommend changing the SCR or PCR (based on the class of service setting you choose when you create the far-end mapping for the circuit. See the "Configuring ATM Class of Service" section).
When calculating utilization for the Burst Advisor in either Access Channel or Virtual Circuits, the bottom bucket of least utilized data is discarded.
Note
Performing Burst Analysis
Step 1
Step 2
Step 3
Viewing Service Advisor Data
The Troubleshooting Toolset provides Service Advisor views for Frame Relay PVCs, ATM VCs, and for each class of service on IP Circuits. Service Advisor views help you analyze historical trends of network performance against the following Service Level Agreement (SLA) metrics:
•
–
–
–
•
•
•
Service Advisor views contain the following SLA graphs:
•
-OR-
Throughput Relative to Policing Threshold (Kbps)—(IP Transport ASEs) the graph uses two color-coded areas which, when combined, indicate the total throughput in kilobits per second during a 15-minute interval. The yellow area (>Threshold) above the color area (<=Threshold) indicates the throughput above the threshold for the given class of service.
-OR-
Throughput Relative to SCR—(ATM ASEs) the graph uses two color-coded areas which, when combined, indicate the total throughput in kbps during a 15-minute interval. The yellow area (>SCR) above the green area (<=SCR or SCR=0) indicates the throughput above SCR. When no data is available, the area appears brown.
•
-OR-
PDR and Availability—(IP Transport ASEs) Packet delivery ratio (PDR) and availability are measured for each class of service.
•
Note
For an end-to-end circuit, the left-side graph displays throughput from the near-end ASE to the network and the right-side displays throughput from the far-end ASE to the network. When the two ASEs have different software versions (when one is Frame Relay and one is ATM, or when the ASE is not on an end-to-end circuit) the left and right-side graphs vary accordingly. Graphs can be viewed in 2-hour or 2-day increments, but are not available in real-time mode.
Figure 6-44 Service Advisor—Frame Relay
The lower right pane of the view provides summary SLA statistics—average, minimum, and maximum RTD (ms), availability (percent), and FDR (%)—for the near-end ASE. Summary statistics cover the two-week period ending at the same time the graphed data period ends (according to the time selected in the historical scroll bar). FDR or PDR values can exceed 100 percent due to small timing variations between sending data and receiving responses across the 15-minute sampling interval boundaries. When that occurs, the statistics are displayed as >100 percent.
The statistics reflect only the intervals when data was collected. When no data could be collected for a specific interval, that interval is dropped from the calculation.
Performing SLA Analysis
Step 1
Step 2
Step 3
Viewing Round Trip Delay Information
Round Trip Delay (RTD) measures the portion of total application delay attributable to the network. An ASE must be present on both ends of the circuit to make RTD measurements. The Round Trip Delay window displays the status of delay sampling activity and delay analysis activity in terms of percentage of completion.
The Round Trip Delay button, when supported, is available in the following end-to-end circuit views:
•
•
•
•
Note
Figure 6-45 Round Trip Delay Window—Frame Relay
Note
When you click Round Trip Delay, Cisco WAPMS monitors and analyzes traffic on both ends of the circuit, then derives delay measurement results. The Status message in the window indicates the RTD measurement completes successfully (Measurement Complete). An error message appears when the circuit has insufficient data or when the ASEs cannot synchronize the data on both ends. Reattempting the test often results in a successful measurement.
Verifying Connectivity
You can verify connectivity using the on-demand connectivity test for Frame Relay, IP, and ATM circuits. In this test, Cisco WAPMS sends a test packet to the far end of the PVC or VC and back, and measures the response time, so you can verify circuit continuity and latency. An ASE must be present on both ends of the circuit to verify connectivity; however, the far-end ASE does not have to be configured in the network performance database. Neither ASE can be a passive probe.
In general, this feature is available for end-to-end configured circuits when both ends have echo capability, regardless of link type. For Frame Relay circuits, the Verify Connectivity button is available in the following views, when active:
•
•
•
•
For IP Transport ASEs, Verify Connectivity is available on the following views:
•
•
•
For ATM ASEs and supported partner devices (AAL-5 type only), Verify Connectivity is available from the following windows:
•
•
•
•
In the Verify Connectivity window, the status message "Unable to start Connectivity Test" indicates one of the following conditions:
•
•
If the test stalls due to a network traffic problem or a faulty ASE, you can cancel the test by clicking Cancel. Figure 6-46 describes the information in the response windows for executing a connectivity test for Frame Relay. Figure 6-47 describes the information in the response windows for executing a connectivity test for ATM circuits.
Figure 6-46 Verify Connectivity Response Window—Frame Relay Circuit
Note
Figure 6-47 Verify Connectivity Response Window—ATM Circuit
Note
Using the Loopback Option
Many Frame Relay ASEs have a Loopback feature, which allows the ASE to be set in loopback mode for line testing purposes. Loopbacks are useful in determining whether an access line is functioning properly. Use the Loopback option in the PAC's Troubleshooting Toolset to have an ASE perform the Network Line loopback.
When the Loopback option on the Troubleshooting menu is unavailable, either the ASE does not support the feature or your user ID does not have permission to initiate loopback mode. Permission to use the Loopback option is granted in PAM Administration. Contact your PAM administrator.
Note
Once the ASE is in loopback mode, you can test the line using diagnostic equipment or another ASE's traffic capture feature at a remote DLCI. (The results do not appear in the PAC's Troubleshooting window.) The option is included in the Troubleshooting Toolset to provide easy remote access to this ASE feature.
Once you initiate loopback mode, it continues until the loopback timer on the ASE expires. You cannot stop loopback mode from the PAC once it is started. The loopback timer, called the Loopback Watchdog Timer, is set on the ASE through the administrative LOOP command.
Note
The PAC's Loopback option corresponds to specific LOOP commands available through the ASE's administrative port (see Table 6-37). When the PAC's Loopback option is activated, it replaces any other LOOP parameter for the same option that may be in progress. However, the PAC's Loopback option has no effect on other LOOP options and parameters set in the ASE.
Table 6-37 ASE LOOP Command Equivalents
T1 CSU/DSU
T1 Network: Line
DDS (56k/64k) CSU/DSU
DDS Port: CSU
X.21, V.35, and HSSI inline
Network Port: Network
Initiating Network Line Loopback
Step 1
You are notified when the near-end ASE does not support this option.
Step 2
Step 3
The window clocks how long the ASE is in loopback mode.
Step 4
Loopback continues until the loopback timer on the ASE expires.