Statistics Collection Manager
Available Languages
Table Of Contents
New Features for Release 11 of CWM SCM
Launching the Statistics Collection Manager
Edit Current Connection Parameters
SCM Primary/Secondary/Tertiary
SCM Dual Collectors for Legacy Nodes
Statistics Collection Manager
The Statistics Collection Manager (SCM) for Release 11 of CWM features two types of Statistics Collection Management. One type of SCM is an integrated SCM that is installed as part of the CWM Server installation on the CWM server workstation, and the other type is a stand-alone SCM that is installed and run from a separate workstation. Both of these SCM feature types are described in this chapter.
New Features for Release 11 of CWM SCM
Statistics Collection Manager for Release 11 of CWM provides the following features:
SCM Standalone Collector, SCM Standalone Parser and SCM Standalone Collector and Parser; ftp enable/collection for NBSM; new statistics format; separate Enable with collection from SCM GUI; card statistics dual collection.
Timed Stats Collection—Using tftp to retrieve statistics data files is available for BPX, IGX, MGX 8850 Release 1, MGX 8230, and MGX 8250 nodes, as well as MGX 8220 shelves.
Trap Stats Collection—Using ftp to retrieve statistics files, ScmCollSvr waits for a file ready trap message from the switch to start ftp. Trap Stats Collection is used only for MGX 8850 Release 2 nodes.
Both Time Stats Collection and Trap Stats Collection are node based. However, the statistics files from AXSM cards in MGX 8850 Release 2 nodes are card based.
Separate SCM Installation—Install the Statistics Collection Manager software after installing CWM software on the same workstation.
QBin stats and virtual port stats for BPX have been included.
WingZ provides an adhoc statistics report.
Launching the Statistics Collection Manager
To launch the Statistics Collection Manager application, click on the Statistics Collection Manager icon, which is found on the Network Topology tool bar, or select the Statistics Collection Manager application from the Apps pull-down menu located on the main menu bar.
Main Window
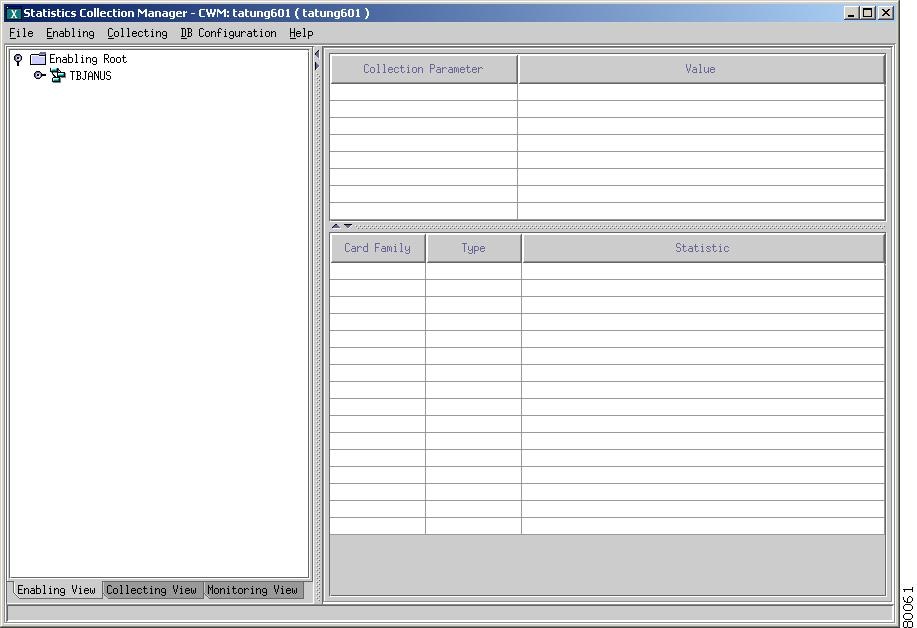
After launching the Statistics Collection Manager application for the first time, you will see a root node called the Enabling Root in the left panel of the window, as shown in Figure 8-1.
Figure 8-1 Statistics Collection Manager Main Window

Click on the eye glass to the left of the Enabling Root to display the Collection Server for the SCM Root, as shown in Figure 8-2.
Figure 8-2 Collection Server
Click on the eye glass to the left of the Collection Server in order to view network nodes, as shown in Figure 8-3.
Figure 8-3 Expanded View of Network Nodes
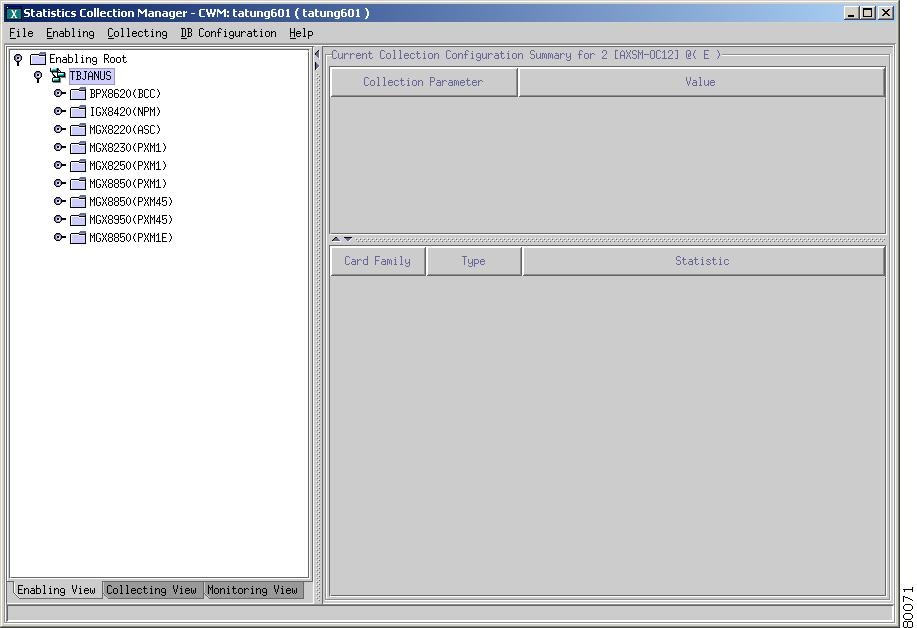
Click on network nodes in the left panel of the SCM main window in order to view additional network elements, as shown in Figure 8-4.
Figure 8-4 Expanded View of Network Elements

Select the File pull-down menu from the SCM GUI main menu bar contains a New SCM GUI option which allows you to launch a new instance of the SCM GUI; a Close option for closing the current instance of the SCM GUI; and an Exit option for exiting all instances of SCM, as shown in Figure 8-5
Figure 8-5 File Menu

Select the Enabling pull-down menu from the SCM GUI main menu bar in order to Edit Current Collection Parameters, Edit with Default Parameters, Edit with Template, Disable Collection Statistics, or Delete Template, as shown in Figure 8-6.
Figure 8-6 Enabling Menu

The Enabling submenus are defined as follows:
•
Edit Current Collection Parameters—Allows current collection parameters to be edited.
•
•
•
•
Select the Collecting pull-down menu from the SCM GUI main menu bar in order to Start Collection or Stop Collection of statistics, as shown in Figure 8-7.
Figure 8-7 Collecting Menu

The Collecting submenus are defined as follows:
•
•

Note
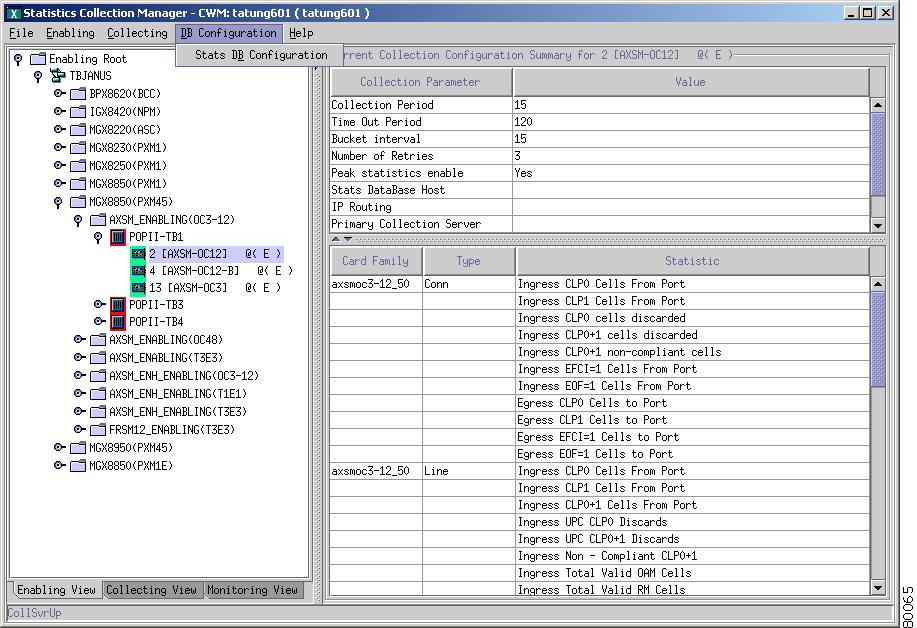
Select the DB Configuration pull-down menu from the SCM GUI main menu bar, as shown in Figure 8-8, in order to launch the Stats DB Host Configuration Dialog window where you can view and apply SCM statistics database configurations.
Figure 8-8 DB Configuration Menu
The DB Configuration submenu is defined as follows:
•
From the DB Configuration submenu, click on the Stats DB Configuration option in order to launch the Stats DB Host Configuration Dialog windows shown in Figure 8-9.
Figure 8-9 Stats DB Host Configuration Dialog
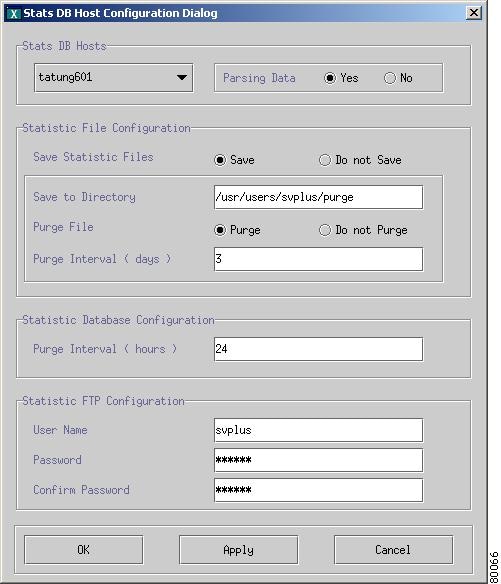
When you are finished configuring parameters for the selected Stats DB Host, click Apply and then OK. A "Successful Configure" message will appear in the lower left hand corner of the SCM main window.
Statistics File Configuration
The statistics file configuration information is explained in the following sections:
Save Statistic Files Button
This toggle controls the ability to save files as they are parsed from the statistics parser. You set it to Do not Save to avoid placing files to the /usr/users/svplus/purge directory. The default is Save.
Save to Directory
You specify the name of the file directory used to store incoming files to be parsed.
Purge File Button
This button controls the ability to purge files as they are parsed from the statistics parser. You set it to Do not Purge to avoid deleting files from the /usr/users/svplus/purge directory. We recommend you delete old files. The default is Purge.
Purge Interval (days)
You specify the value (in days) used to determine which old files are purged from the /usr/users/svplus/purge directory when space in your hard disk's Incoming partition drops below twenty megabytes. The files with a date `N' days older than today's date are purged. (0 = no purging is done.) The default is 3 days.
Purge Interval (hours)
You specify the value (in hours) used to determine how long the data is maintained by the CWM database. The default retention period is 24 hours. The maximum retention period is 8784 hours (1 year).
Note
Statistics FTP Configuration
The statistics FTP configuration information is explained in the following sections:
Username
You specify the FTP username. The default is svplus.
Password
Enter the FTP password. The screen will display asterisks.
Confirm Password
Reenter your FTP password in this field. Once again, the screen will display asterisks.
SCM Statistics Disable
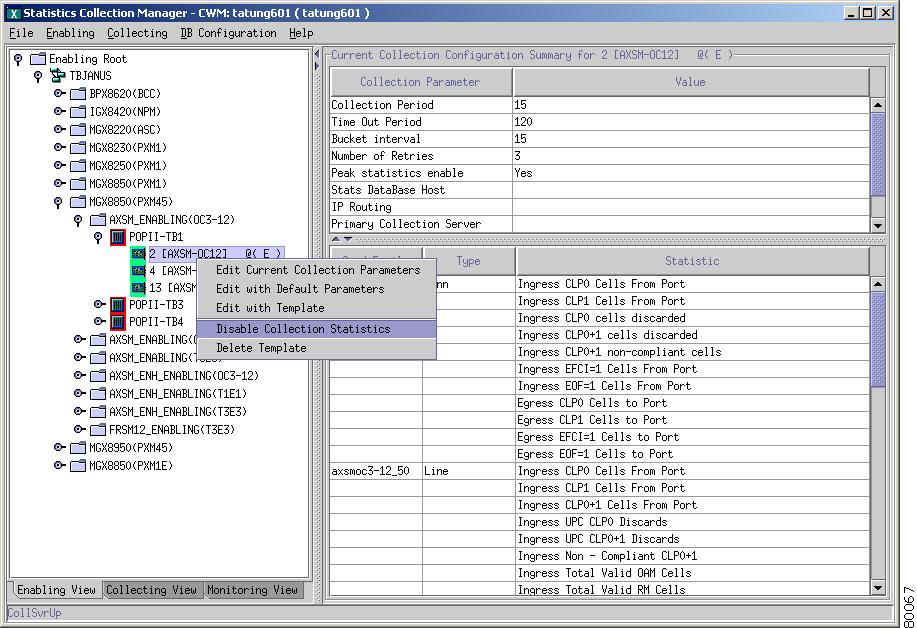
The Disable Collection Statistics pop-up menu is accessed by right clicking on a node in the left panel of the SCM main window. These same options are found under the Enabling pull-down menu and include Edit Current Collection Parameters, Edit with Default Parameters, Edit with Template, Disable Collection Statistics and Delete Template options, as shown in Figure 8-10.
Figure 8-10 Disable Collection Statistics Menu
A confirmation dialog window asks you if you really want to disable statistics, as shown in Figure 8-11.
Figure 8-11 Statistics Disabling Confirmation

Delete Template
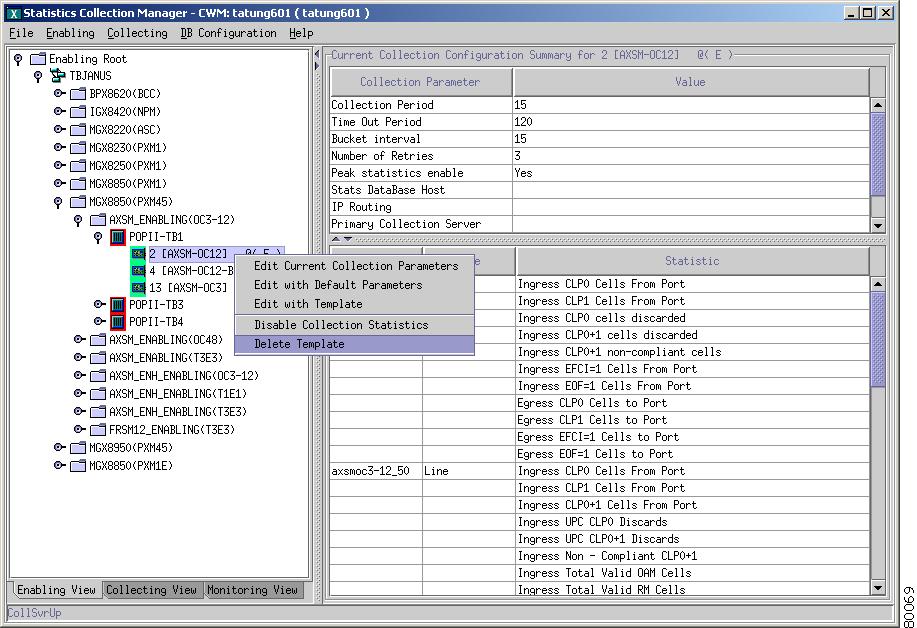
The Delete Template menu option is shown in Figure 8-12. Use this feature to delete a template.
Figure 8-12 Delete Template Menu
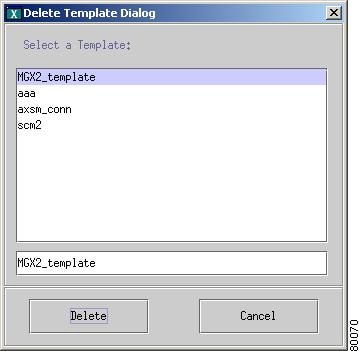
The Delete Template Dialog window is shown in Figure 8-13. Select the template you want to delete from the list of templates, and then click on the Delete button.
Figure 8-13 Delete Template Dialog
Edit Current Connection Parameters
The Edit Current Connection Parameters pop-up menu is accessed by right clicking on a node in the left panel of the SCM main window, as shown in Figure 8-14. This same option is found under the Enabling pull-down menu.
Figure 8-14 Edit Current Connection Parameters

SCM Statistics Enable
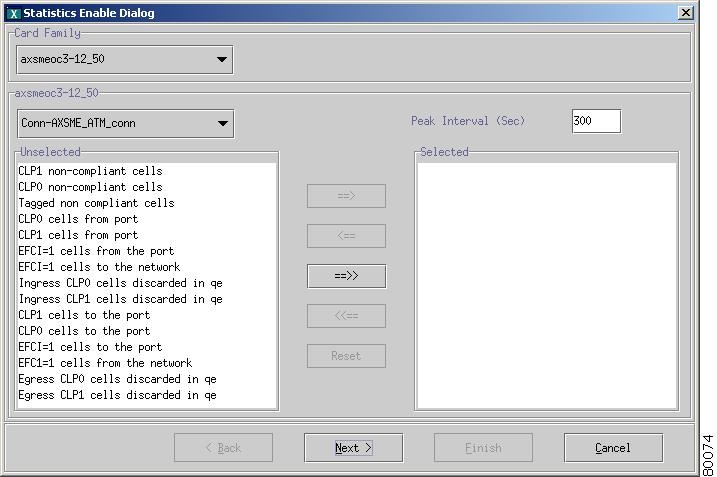
Figure 8-15 shows the Statistics Enable Dialog window containing selected and unselected parameters for a selected connection.
Figure 8-15 Statistics Enable Dialog
Note
After selecting and unselecting parameters needed for the given connection in the previous Statistics Enable Dialog window, click on the Next button to view the next Statistics Enable Dialog window shown in Figure 8-16.
This window allows you to set the collection period in minutes, the time out period in minutes, the bucket interval in minutes, the number of retries, and the peak statistics enable. The last drop-down in this dialog box asks whether you would like to use your selected settings as a default template. Click on the Save button, and then the Finish button and the switch will implement these selected values and send a confirmation back to the SCM Controller Server.
Figure 8-16 Next Statistics Enable Dialog

Table 8-1 presents the modifiable statistics collection parameters and descriptions.
Figure 8-17 shows the Update Stats enabling information window which appears after the parameters in the Statistics Enable dialog box have been set.
Figure 8-17 Update Stats enabling information

SCM Statistics Collection
Figure 8-18 shows the Start Collection option that is accessed by right clicking on a card in the left panel of the SCM main window. Figure 8-19 shows the Start Collection Dialog window that appears after the Start Collection option has been selected.
Figure 8-18 Start Statistics Collection

Figure 8-19 Start Collection Dialog
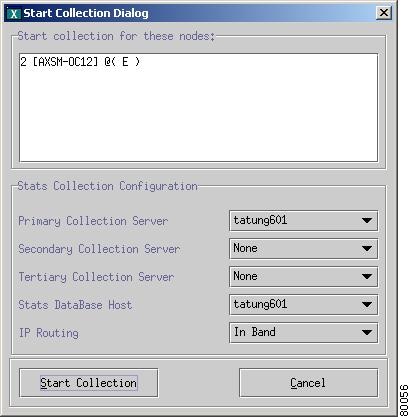
Figure 8-20 shows the Collecting View window of the SCM main window with current collection configurations for statistics being collected.
Figure 8-20 Collecting View Window

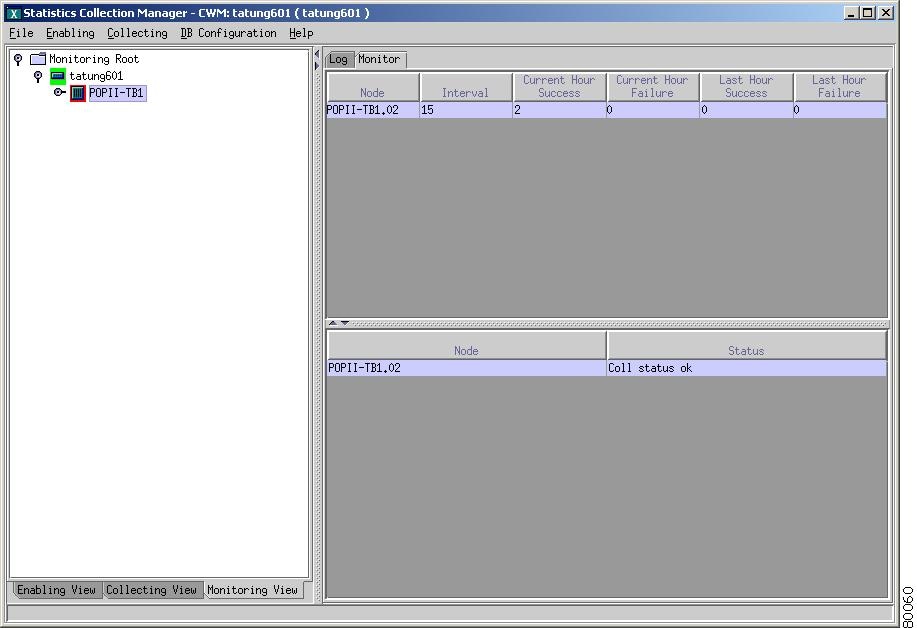
You can monitor statistics collection through the Monitoring View tab which is found at the bottom left hand side of the SCM main window. Figure 8-21 also shows that the Monitor view has been selected from the upper right panel of the SCM main window.
Figure 8-21 Monitoring View and Log Information

Figure 8-22 shows that the Monitor view has been selected from the upper right panel of the SCM main window.
Figure 8-22 Monitoring View and Monitor Information
Launching the Standalone SCM
The following sections explain how to launch the SCM Standalone Collector:
SCM Standalone Collector
The Statistics Collection Manager (SCM) for Release 11 of CWM has a new standalone collector that allows a separate SCM collection server in both installation and statistics collection, and is installed and run from a client CWM workstation. This new feature allows you to control and manage statistics collection through a standalone application. The Statistics Controller Server, Statistics Collection Server, and Statistics Parser Server provide statistics applicable to the different cards and nodes.
Note
Launch SCM Standalone Collector through an xterm window by issuing the SCM command at the command line. Figure 8-23 shows an xterm window displayed with SCM typed at the command line:
Figure 8-23 SCM Stand Alone initialization

Figure 8-24 shows an xterm window displayed with Start SCM core, Stop SCM core and Exit menu options.
Figure 8-24 SCM start core, stop core, and exit options

Note
SCM Primary/Secondary/Tertiary
SCM Primary/Secondary/Tertiary GUIs provide distributed collection and statistics collection redundancy. SCM redundancy means that the secondary and tertiary SCM collection servers still continue to collect statistics when the primary SCM collection server is not reachable or completely shut down. Distributed collection means that you can distribute statistics collection from all switch nodes to different SCM collection servers.
For example, if the connection to the Primary SCM is shut down for any reason, whether the FTP or TFTP connection has been disrupted, or if the Primary SCM shuts down, then the Secondary SCM can take over the statistics collection processes. If the Secondary SCM shuts down for any reason, the Tertiary SCM can take over the statistics collection processes.
P/S/T is always dependant upon the assignment of the collection server. You can use the cnfcollsvr command to redirect collectors to a CWM host.
The Start Collection Dialog allows collection configuration for the Primary, Secondary, and Tertiary collection servers. Also, the statistics database host can be set, and IP Routing can be designated as inband or out-of-band as seen in Figure 8-19.
Peer-to-Peer Communications
Release 11 of Cisco WAN Manager has been designed to enable multiple CWM workstations to manage a network with improved network synchronization and scalability. The architecture uses a server-client structure for communications between the CWM server and client processes.
CWM workstations use Peer-to-Peer Communications to synchronize user data with each other. When user data is provisioned or changed, the CWM workstations will propagate the new data to the other CWM workstations. The user is able to continue the provisioning of network data, even when communications between a Primary CWM and Secondary CWM have been interrupted. If for any reason the communications between CWM servers are interrupted, the provisioning of the user data will be suspended on the Secondary CWM, but not on the Primary CWM as user data provisioning will continue on the Primary CWM. During that time, the provisioning of user data and monitoring of the network are not impacted.
In a given wide area network managed by Release 11 of CWM, the first CWM workstation to begin operation will assume the role of Primary CWM. As other CWM workstations become active, they will take on Secondary CWM workstation roles. The only difference in function between Primary and Secondary CWM workstations is that the Primary CWM workstation would provide the Secondary CWM workstations with user data when the Secondary CWM workstation launches.
Priority numbers of all Secondaries are assigned by the Primary at the time a Secondary registers with the Primary. It is based on "first-come-first-serve" logic. All the Secondaries have the same privilege except that the Secondary with priority 1 will take over as the Primary if the Primary shuts down.
SCM CWM-CWM Gateway Support
Statistics collection is populated from the Primary SCM to the Secondary SCM. Primary gateways save enabling information and forward data to the Secondary host via the Stats Master.
Time Sync
Timing in SCM is qualified by the node time and a sequence to connect from Primary to Secondary with a set maximum amount of retries.
SCM Inband and Out-of-band
TFTP and FTP are used to transfer files using the network IP address for inband communications, and the LAN IP address for out-of-band communications.
SCM Dual Collectors for Legacy Nodes
Dual collectors for Legacy Nodes include the following: BPX, IPX, IGX, Axis, MGX 8850 Release 1; single collector for MGX 8850 Release 2.
SES Nodes include MGX 8850 Release 2, and BPX/SES.
SCM History Files Collection
The default for History Files Collection in stand alone SCM is No History Files Collection. History Files collection can be set from one to a maximum of three files for collection.
Group Nodes by Platform
The following sections describe the node view and the window fresh option.
Node View
The node view provides a hierarchical view of network elements. The node panel enables you to do the following operations:
•
•
•
•
Window Refresh
SCM provides a refresh option that displays all changes made to node configurations. To refresh the SCM window you must collapse the expanded SCM tree by double clicking on the root node, and then re-expanding the tree to see the new configuration. This refresh option applies to Primary, Secondary, and Tertiary configurations.
SCM Proxy
ScmProxy is an interface to the Statistics Collection Manager application that allows you to enable and disable statistics, and stop and start collecting statistics on multiple nodes. The ScmProxy interface is an alternative to the SCM GUI.
To use ScmProxy, a Node-List file must be formed. The Node-List file contains the statistics template, collection server and Stats parser host names and node list. If a template other than the standard platform template is to be used, it should be formed first using the SCM GUI.
To start ScmProxy, type scmproxy <filename>. The filename is the name of the input file containing the template, hosts and node information. The format of the input file MUST be as shown below:
<CollParam:<template_name><collectionhostname><parserhostname><routinginfo>>
node_name
node_name
..
..
<CollParam:<template_name><collectionhostname><parserhostname><routinginfo>>
node_name
..
..
The template_name is the name of the template applicable to all nodes listed after the parameters. The collection hostname is the name of the host that does ftp/tftp of files. The parser hostname is the host that stores the files. The routing info value must be either 0 or 1. A value of 0 indicates In band routing and a value of 1 indicates out of band routing.
To start Scm Proxy, type the scmproxy <nodelist_filename> command in the CWM host name.
The filename is the name of the input file containing template, hosts and node information; when the scmproxy is started with the correct input file, the following interface is displayed:
Welcome to SCM ProxyMENU---------1) Enable Statistics2) Disable Statistics3) Start Collection4) Stop Collectionx) ExitEnter number or x to exit.This section explains each field in the Node List File.
template_name: This is the name of the template applicable to the node. Stats templates can be created from the SCM GUI. The templates are saved in StrataCom database.
collectionhostname: This is the name of the collection server host. The collection server can be on a CWM host or in a standalone SCM.
parserhostname: This is the name of the parser host name. Stats parser can be on a CWM host or in a standalone SCM.
routinginfo: This field can take strings "inband" or "outband". The field depends on the routing method to the node.
Note
Card Families
The following is a list of card families mapped to the cards they support. The list is organized by platform, with card families and the card(s) it supports listed after each platform.
NODE_IPX
========
ait_91
AIT
cdp_91
CDP
sdp_91
SDP
LDP
fastpad_91
FTC
uxm_91
UXM
uxm_92
UXM
uxm_93
UXM
frp_91
FRP
ntc_91
NTC
NODE_IGX
========
btm_91
BTM, ALM-A, ALM-B
cdp_91
CDP
UVM
sdp_91
SDP
LDP
fastpad_91
FTC
uxm_91
UXM
uxm_92
UXM
uxm_93
UXM
urm_93
URM
frp_91
FRP
UFM
UFM-U
ntc_91
NTC
NODE_BPX
========
asi-t3_91
ASI_T3_2
ASI0_E3
ASI0_T3
asi-e3_91
ASI_E3_2
asi-oc3_91
ASI_OC3
asi-t3_92
ASI_T3_2
ASI0_E3
ASI0_T3
asi-e3_92
ASI_E3_2
asi-oc3_92
ASI_OC3
asi-t3_93
ASI_T3_2
ASI0_E3
ASI0_T3
asi-e3_93
ASI_E3_2
asi-oc3_93
ASI_OC3
bxm_t3_91
BXM_T3_8_SMF
BXM_T3_8_MMF
BXM_T3_8_SMFLR
BXM_T3_8_SNM
BXM_T3_12_SMF
BXM_T3_12_MMF
BXM_T3_12_SMFLR
BXM_T3_12_SNM
bxm_t3_92
BXM_T3_8_SMF
BXM_T3_8_MMF
BXM_T3_8_SMFLR
BXM_T3_8_SNM
BXM_T3_12_SMF
BXM_T3_12_MMF
BXM_T3_12_SMFLR
BXM_T3_12_SNM
bxme_t3_92
BXM_T3_12 (Enhanced)
bxm_t3_93
BXM_T3_8_SMF
BXM_T3_8_MMF
BXM_T3_8_SMFLR
BXM_T3_8_SNM
BXM_T3_12_SMF
BXM_T3_12_MMF
BXM_T3_12_SMFLR
BXM_T3_12_SNM
bxme_t3_93
BXM_T3_12 (Enhanced)
bxm_e3_91
BXM_E3_8_SMF
BXM_E3_8_MMF
BXM_E3_8_SMFLR
BXM_E3_8_SNM
BXM_E3_12_SMF
BXM_E3_12_MMF
BXM_E3_12_SMFLR
BXM_E3_12_SNM
bxm_e3_92
BXM_E3_8_SMF
BXM_E3_8_MMF
BXM_E3_8_SMFLR
BXM_E3_8_SNM
BXM_E3_12_SMF
BXM_E3_12_MMF
BXM_E3_12_SMFLR
BXM_E3_12_SNM
bxme_e3_92
BXM_E3_12 (Enhanced)
bxm_e3_93
BXM_E3_8_SMF
BXM_E3_8_MMF
BXM_E3_8_SMFLR
BXM_E3_8_SNM
BXM_E3_12_SMF
BXM_E3_12_MMF
BXM_E3_12_SMFLR
BXM_E3_12_SNM
bxme_e3_93
BXM_E3_12 (Enhanced)
bxm_oc3_91
BXM_OC3_4_SMF
BXM_OC3_4_MMF
BXM_OC3_4_SMFLR
BXM_OC3_4_SNM
BXM_OC3_8_SMF
BXM_OC3_8_MMF
BXM_OC3_8_SMFLR
BXM_OC3_8_SNM
BXM_OC3_4_STM1E
BXM_OC3_8_STM1E
BXM_OC3_4_XLR
BXM_OC3_8_XLR
BPX_MNCH
bxm_oc3_92
BXM_OC3_4_SMF
BXM_OC3_4_MMF
BXM_OC3_4_SMFLR
BXM_OC3_4_SNM
BXM_OC3_8_SMF
BXM_OC3_8_MMF
BXM_OC3_8_SMFLR
BXM_OC3_8_SNM
BXM_OC3_4_STM1E
BXM_OC3_8_STM1E
BXM_OC3_4_XLR
BXM_OC3_8_XLR
BPX_MNCH
bxm_oc3_93
BXM_OC3_4_SMF
BXM_OC3_4_MMF
BXM_OC3_4_SMFLR
BXM_OC3_4_SNM
BXM_OC3_8_SMF
BXM_OC3_8_MMF
BXM_OC3_8_SMFLR
BXM_OC3_8_SNM
BXM_OC3_4_STM1E
BXM_OC3_8_STM1E
BXM_OC3_4_XLR
BXM_OC3_8_XLR
BPX_MNCH
bxm_oc12_91
BXM_OC12_1_SMF
BXM_OC12_1_MMF
BXM_OC12_1_SMFLR
BXM_OC12_1_SNM
BXM_OC12_2_SMF
BXM_OC12_2_MMF
BXM_OC12_2_SMFLR
BXM_OC12_2_SNM
BME_OC12_1_SMF
BME_OC12_1_MMF
BME_OC12_1_SMFLR
BME_OC12_1_SNM
BME_OC12_2_SMF
BME_OC12_2_MMF
BME_OC12_2_SMFLR
BME_OC12_2_SNM
BXM_OC12_1_XLR
BXM_OC12_2_XLR
bxm_oc12_92
BXM_OC12_1_SMF
BXM_OC12_1_MMF
BXM_OC12_1_SMFLR
BXM_OC12_1_SNM
BXM_OC12_2_SMF
BXM_OC12_2_MMF
BXM_OC12_2_SMFLR
BXM_OC12_2_SNM
BME_OC12_1_SMF
BME_OC12_1_MMF
BME_OC12_1_SMFLR
BME_OC12_1_SNM
BME_OC12_2_SMF
BME_OC12_2_MMF
BME_OC12_2_SMFLR
BME_OC12_2_SNM
BXM_OC12_1_XLR
BXM_OC12_2_XLR
bxm_oc12_93
BXM_OC12_1_SMF
BXM_OC12_1_MMF
BXM_OC12_1_SMFLR
BXM_OC12_1_SNM
BXM_OC12_2_SMF
BXM_OC12_2_MMF
BXM_OC12_2_SMFLR
BXM_OC12_2_SNM
BME_OC12_1_SMF
BME_OC12_1_MMF
BME_OC12_1_SMFLR
BME_OC12_1_SNM
BME_OC12_2_SMF
BME_OC12_2_MMF
BME_OC12_2_SMFLR
BME_OC12_2_SNM
BXM_OC12_1_XLR
BXM_OC12_2_XLR
bxme_oc3_92(Enhanced Cards)
BXM_OC3_4_SMF
BXM_OC3_4_MMF
BXM_OC3_4_SMFLR
BXM_OC3_8_SMF
BXM_OC3_8_MMF
BXM_OC3_8_SMFLR
BXM_OC3_4_STM1E
BXM_OC3_8_STM1E
BXM_OC3_4_XLR
BXM_OC3_8_XLR
bxme_oc3_93(Enhanced Cards)
BXM_OC3_4_SMF
BXM_OC3_4_MMF
BXM_OC3_4_SMFLR
BXM_OC3_8_SMF
BXM_OC3_8_MMF
BXM_OC3_8_SMFLR
BXM_OC3_4_STM1E
BXM_OC3_8_STM1E
BXM_OC3_4_XLR
BXM_OC3_8_XLR
BXM_OC12_1_SMF
bxme_oc12_92(Enhanced Cards)
BXM_OC12_1_MMF
BXM_OC12_1_SMFLR
BXM_OC12_2_SMF
BXM_OC12_2_MMF
BXM_OC12_2_SMFLR
BME_OC12_1_SMF
BME_OC12_2_SMF
BME_OC12_2_SMFLR
BME_OC12_2_SNM
BXM_OC12_1_XLR
BXM_OC12_2_XLR
bxme_oc12_93(Enhanced Cards)
BXM_OC12_1_MMF
BXM_OC12_1_SMFLR
BXM_OC12_2_SMF
BXM_OC12_2_MMF
BXM_OC12_2_SMFLR
BME_OC12_1_SMF
BME_OC12_2_SMF
BME_OC12_2_SMFLR
BME_OC12_2_SNM
BXM_OC12_1_XLR
BXM_OC12_2_XLR
bni-t3_91
BNI_T3
bni-t3_92
BNI_T3
bni-t3_93
BNI_T3
bni-e3_91
BNI_E3
bni-e3_92
BNI_E3
bni-e3_93
BNI_E3
bni-oc3_91
BNI_OC3
bni-oc3_92
BNI_OC3
bni-oc3_93
BNI_OC3
AXIS NODE
========
frsm_40
FRSM_4T1
FRSM_4E1
FRSM_4T1_C
FRSM_4E1_C
FRSM_HS1
FRSM_HS1_B
FRSM_8T1
FRSM_8E1
FRSM_2CT3
FRSM_2T3
FRSM_2E3
FRSM_2HS2
ausm_40
AUSM_4T1
AUSM_4E1
AUSM_8T1
AUSM_8E1
AUSM_B_8T1
AUSM_B_8E1
cesm_40
CESM_4T1
CESM_4E1
CESM_8T1
CESM_8E1
CESM_T3
CESM_E3
bnm-t3_40
BNM_T3
bnm-e3_40
BNM_E3
bnm-155_40
BNM_155
POPEYE Release 1
===============
frsm_40
FRSM_4T1
FRSM_4E1
FRSM_4T1_C
FRSM_4E1_C
FRSM_HS1
FRSM_HS1_B
FRSM_8T1
FRSM_8E1
FRSM_2CT3
FRSM_2T3
FRSM_2E3
FRSM_2HS2
ausm_40
AUSM_4T1
AUSM_4E1
AUSM_8T1
AUSM_8E1
AUSM_B_8T1
AUSM_B_8E1
cesm_40
CESM_4T1
CESM_4E1
CESM_8T1
CESM_8E1
CESM_T3
CESM_E3
pxm_1_40
PXM_1
PXM_OC3
PXM_OC12
PXM_T3E3
srm-t3_92
SRM_3T3
SRME
srm-SONET_92
SRME_1OC3
SRME_1STS3
POPEYE II
===========
axsmt3e3_50
AXSM16_T3E3
AXSM16_T3E3_B(AXSM B)
axsmoc3-12_50
AXSM8_OC3
AXSM16_OC3
AXSM16_OC3_B(axsm B)
AXSM4_OC12
AXSM4_OC12_B(axsm B)
axsmoc48_50
AXSM1_OC48
AXSM1_OC48_B(axsm B)
axsmet3e3_50
AXSM16_T3E3_E
axsmeoc3-12_50
AXSM8_OC3_E
AXSM2_OC12_E
AXSM8_STM1_E
axsmet1e1_50
axsme-t1/e1
pxm1e_50
pxm1e(all flavors)
frsm-12t3e3_50
frsm t3e3
How Statistics Are Used
Statistics are used to show network performance. Raw data can be used for monitoring nodes in your network, and for customer billing purposes. The Wingz Reports application provides statistics collection reporting.
 Feedback
Contact Cisco
- Open a Support Case

- (Requires a Cisco Service Contract)
This Document Applies to These Products
- Collaboration Endpoints - Retired Products
- Conferencing - Retired Products
- Contact Center - Retired Products
- Optical Networking - Retired Products
- Routers - Retired Products
- Security - Retired Products
- Servers - Unified Computing (UCS) Retired Products
- Storage Networking Retired Products
- Switches - Retired Products
- Video - Retired Products
- Wireless - Retired Products