Feedback
Table Of Contents
Writing Embedded Event Manager Policies Using the Cisco IOS CLI
Prerequisites for Writing EEM Policies Using the Cisco IOS CLI
Information About Writing EEM Policies Using the Cisco IOS CLI
Embedded Event Manager Policies
EEM Event Detectors Available by Cisco IOS Release
EEM Actions Available by Cisco IOS Release
Embedded Event Manager Built-In Environment Variables Used in EEM Applets
How to Write EEM Policies Using the Cisco IOS CLI
Registering and Defining an Embedded Event Manager Applet
Alphabetical Order of EEM Action Labels
Registering and Defining an Embedded Event Manager Policy to Run Manually
Unregistering Embedded Event Manager Policies
Suspending Embedded Event Manager Policy Execution
Configuring and Tracking a Stub Object Using Embedded Event Manager
Displaying Embedded Event Manager History Data
Displaying Embedded Event Manager Registered Policies
Configuration Examples for Writing EEM Policies Using the Cisco IOS CLI
Embedded Event Manager Applet Configuration: Examples
Embedded Event Manager Manual Policy Execution: Examples
Configuring and Tracking a Stub Object Using Embedded Event Manager: Example
Embedded Event Manager Watchdog System Monitor (Cisco IOS) Event Detector Configuration: Example
Feature Information for Writing EEM Policies Using the Cisco IOS CLI
Writing Embedded Event Manager Policies Using the Cisco IOS CLI
First Published: October 31, 2005Last Updated: October 9, 2007This module describes how to write Embedded Event Manager (EEM) policies using Cisco IOS command-line interface (CLI) applets to handle Cisco IOS software faults and events. EEM is a distributed and customized approach to event detection and recovery offered directly in a Cisco IOS device. EEM offers the ability to monitor events and take informational, corrective, or any desired action when the monitored events occur or when a threshold is reached. The EEM policy engine receives notifications when faults and other events occur. EEM policies implement recovery on the basis of the current state of the system and the actions specified in the policy for a given event. Recovery actions are triggered when the policy is run.
Finding Feature Information in This Module
Your Cisco IOS software release may not support all of the features documented in this module. To reach links to specific feature documentation in this module and to see a list of the releases in which each feature is supported, use the "Feature Information for Writing EEM Policies Using the Cisco IOS CLI" section.
Finding Support Information for Platforms and Cisco IOS and Catalyst OS Software Images
Use Cisco Feature Navigator to find information about platform support and Cisco IOS and Catalyst OS software image support. To access Cisco Feature Navigator, go to http://www.cisco.com/go/cfn. An account on Cisco.com is not required.
Contents
•
Prerequisites for Writing EEM Policies Using the Cisco IOS CLI
•
•
•
•
Prerequisites for Writing EEM Policies Using the Cisco IOS CLI
•
•
•
•
Information About Writing EEM Policies Using the Cisco IOS CLI
To write EEM policies using the Cisco IOS CLI, you should understand the following concepts:
•
•
•
•
Embedded Event Manager Policies
EEM offers the ability to monitor events and take informational or corrective action when the monitored events occur or a threshold is reached. An EEM policy is an entity that defines an event and the actions to be taken when that event occurs. There are two types of EEM policies: an applet or a script. An applet is a simple form of policy that is defined within the CLI configuration. A script is a form of policy that is written in Tool Command Language (Tcl).
EEM Applet
An EEM applet is a concise method for defining event screening criteria and the actions to be taken when that event occurs. In applet configuration mode, three types of configuration statements are supported. The event commands are used to specify the event criteria to trigger the applet to run, the action commands are used to specify an action to perform when the EEM applet is triggered, and the set command is used to set the value of an EEM applet variable. Currently only the _exit_status variable is supported for the set command.
Only one event configuration command is allowed within an applet configuration. When applet configuration mode is exited and no event command is present, a warning is displayed stating that no event is associated with this applet. If no event is specified, this applet is not considered registered. When no action is associated with this applet, events are still triggered but no actions are performed. Multiple action configuration commands are allowed within an applet configuration. Use the show event manager policy registered command to display a list of registered applets.
Before modifying an EEM applet, be aware that the existing applet is not replaced until you exit applet configuration mode. While you are in applet configuration mode modifying the applet, the existing applet may be executing. It is safe to modify the applet without unregistering it. When you exit applet configuration mode, the old applet is unregistered and the new version is registered.
The action configuration commands are uniquely identified using the label argument, which can be any string value. Actions are sorted in ascending alphanumeric key sequence using the label argument as the sort key, and they are run using this sequence.
The Embedded Event Manager schedules and runs policies on the basis of an event specification that is contained within the policy itself. When applet configuration mode is exited, EEM examines the event and action commands that are entered and registers the applet to be run when a specified event occurs.
EEM Script
Scripts are defined off the networking device using an ASCII editor. The script is then copied to the networking device and registered with EEM. Tcl scripts are supported by EEM.
EEM allows you to write and implement your own policies using Tcl. Writing an EEM policy involves:
•
•
•
Cisco provides enhancements to Tcl in the form of keyword extensions that facilitate the development of EEM policies. The main categories of keywords identify the detected event, the subsequent action, utility information, counter values, and system information. For more details about writing EEM policies using Tcl, see the "Writing Embedded Event Manager Policies Using Tcl" module.
EEM Event Detectors Available by Cisco IOS Release
EEM uses software programs known as event detectors to determine when an EEM event occurs. Some event detectors are available on every Cisco IOS release, but most event detectors have been introduced in a specific release. Use Table 1 to determine which event detectors are available in your specific Cisco IOS release. A blank entry (—) indicates that the event detector is not available: the text "Yes" indicates that the event detector is available. The event detectors shown in Table 1 are supported in later releases of the same Cisco IOS release train. For more details on each event detector, see the Event Detectors concept in the "Embedded Event Manager Overview" module.
EEM Actions Available by Cisco IOS Release
The CLI-based corrective actions that are taken when event detectors report events enable a powerful on-device event management mechanism. Some actions are available in every Cisco IOS release, but most actions have been introduced in a specific release. Use Table 2 to determine which actions are available in your specific Cisco IOS release. A blank entry (—) indicates that the action is not available; the text "Yes" indicates that the action is available. The actions shown in Table 2 are supported in later releases of the same Cisco IOS release train. For more details on each action, see the Embedded Event Manager Actions concept in the "Embedded Event Manager Overview" module.
Embedded Event Manager Built-In Environment Variables Used in EEM Applets
EEM built-in environment variables are a subset of the Cisco-defined environment variables and the built-in variables are available to EEM applets only. The built-in variables can be read-only or can be read and write and these variables may apply to one specific event detector or to all event detectors. Table 3 lists the Cisco built-in environment variables that are read-only alphabetically by event detector and subevent.
How to Write EEM Policies Using the Cisco IOS CLI
This section contains the following tasks:
•
•
•
•
•
•
•
Registering and Defining an Embedded Event Manager Applet
Perform this task to register an applet with Embedded Event Manager and to define the EEM applet using the Cisco IOS CLI event and action commands. Only one event command is allowed in an EEM applet. Multiple action commands are permitted. If no event and no action commands are specified, the applet is removed when you exit configuration mode.
The SNMP event detector and the syslog action commands used in this task are just representing any event detector and action commands. For examples using other event detectors and action commands, see the "Embedded Event Manager Applet Configuration: Examples" section.
EEM Environment Variables
EEM environment variables for EEM policies are defined using the EEM event manager environment configuration command. By convention, all Cisco EEM environment variables begin with "_". In order to avoid future conflict, customers are urged not to define new variables that start with "_".
You can display the EEM environment variables set on your system by using the show event manager environment privileged EXEC command.
For example, you can create EEM policies that can send e-mails when an event occurs. Table 4 describes the e-mail-specific environment variables that can be used in EEM policies.
Alphabetical Order of EEM Action Labels
An EEM action label is a unique identifier that can be any string value. Actions are sorted and run in ascending alphanumeric (lexicographical) key sequence using the label as the sort key. If you are using numbers as labels be aware that alphanumerical sorting will sort 10.0 after 1.0, but before 2.0, and in this situation we recommend that you use numbers such as 01.0, 02.0, and so on, or use an initial letter followed by numbers.
SUMMARY STEPS
1.
2.
3.
4.
5.
6.
7.
8.
9.
10.
11.
DETAILED STEPS
Step 1
enable
Example:Router> enable
Enables privileged EXEC mode.
•
Step 2
show event manager environment [all | variable-name]
Example:Router# show event manager environment all
(Optional) Displays the name and value of EEM environment variables.
•
•
Step 3
configure terminal
Example:Router# configure terminal
Enters global configuration mode.
Step 4
event manager environment variable-name string
Example:Router(config)# event manager environment _email_to engineering@example.com
Configures the value of the specified EEM environment variable.
•
Step 5
Repeat Step 4 for all the required environment variables.
Repeat Step 4 to configure all the environment variables required by the policy to be registered in Step 6.
Step 6
event manager applet applet-name
Example:Router(config)# event manager applet memory-fail
Registers the applet with the Embedded Event Manager (EEM) and enters applet configuration mode.
Step 7
event snmp oid oid-value get-type {exact | next} entry-op operator entry-val entry-value [exit-comb {or | and}] [exit-op operator] [exit-val exit-value] [exit-time exit-time-value] poll-interval poll-int-value
Example:Router(config-applet)# event snmp oid 1.3.6.1.4.1.9.9.48.1.1.1.6.1 get-type exact entry-op lt entry-val 5120000 poll-interval 90
Specifies the event criteria that cause the EEM applet to run.
•
•
Step 8
action label syslog [priority priority-level] msg msg-text
Example:Router(config-applet)# action 1.0 syslog priority critical msg "Memory exhausted; current available memory is $_snmp_oid_val bytes"
Specifies the action to be taken when an EEM applet is triggered.
•
•
•
Step 9
action label mail server server-address to to-address from from-address [cc cc-address] subject subject body body-text
Example:Router(config-applet)# action 2.0 mail server 192.168.1.10 to engineering@example.com from devtest@example.com subject "Memory failure" body "Memory exhausted; current available memory is $_snmp_oid_val bytes"
Specifies the action of sending a short e-mail when an EEM applet is triggered.
•
•
•
•
•
Step 10
Add more action commands as required.
—
Step 11
end
Example:Router(config-applet)# end
Exits applet configuration mode and returns to privileged EXEC mode.
Troubleshooting Tips
Use the debug event manager command in privileged EXEC mode to troubleshoot EEM command operations. Use any debugging command with caution as the volume of generated output can slow or stop the router operations. We recommend that this command be used only under the supervision of a Cisco engineer.
Registering and Defining an Embedded Event Manager Policy to Run Manually
There are two ways to manually run an EEM policy. EEM usually schedules and runs policies on the basis of an event specification that is contained within the policy itself. The event none command allows EEM to identify an EEM policy that can be manually triggered. To run the policy, use either the action policy command in applet configuration mode or the event manager run command in privileged EXEC mode.
Perform this task to register an EEM policy to be run manually using the event manager run command. For an example of how to manually run a policy using the action policy command, see the "Embedded Event Manager Manual Policy Execution: Examples" section.
SUMMARY STEPS
1.
2.
3.
4.
5.
6.
7.
DETAILED STEPS
Unregistering Embedded Event Manager Policies
Perform this task to remove an EEM policy from the running configuration file. Execution of the policy is canceled.
SUMMARY STEPS
1.
2.
3.
4.
5.
6.
DETAILED STEPS
Step 1
enable
Example:Router> enable
Enables privileged EXEC mode.
•
Step 2
show event manager policy registered [event-type event-name] [system | user] [time-ordered | name-ordered]
Example:Router# show event manager policy registered
(Optional) Displays the EEM policies that are currently registered.
•
•
Step 3
configure terminal
Example:Router# configure terminal
Enters global configuration mode.
Step 4
no event manager policy policy-filename
Example:Router(config)# no event manager policy IPSLAping1
Removes the EEM policy from the configuration, causing the policy to be unregistered.
Step 5
exit
Example:Router(config)# exit
Exits global configuration mode and returns to privileged EXEC mode.
Step 6
Repeat Step 2 to ensure that the policy has been removed.
Example:Router# show event manager policy registered
—
Examples
In the following example, the show event manager policy registered privileged EXEC command is used to display the two EEM applets that are currently registered:
Router# show event manager policy registeredNo. Class Type Event Type Trap Time Registered Name1 applet system snmp Off Fri Aug 12 17:42:52 2005 IPSLAping1oid {1.3.6.1.4.1.9.9.42.1.2.9.1.6.4} get-type exact entry-op eq entry-val {1}exit-op eq exit-val {2} poll-interval 90.000action 1.0 syslog priority critical msg "Server IPecho Failed: OID=$_snmp_oid_val"action 1.1 snmp-trap strdata "EEM detected server reachability failure to 10.1.88.9"action 1.2 publish-event sub-system 88000101 type 1 arg1 "10.1.88.9" arg2 "IPSLAEcho"arg3 "fail"action 1.3 counter name _IPSLA1F op inc value 12 applet system snmp Off Thu Sep 15 05:57:16 2005 memory-failoid {1.3.6.1.4.1.9.9.48.1.1.1.6.1} get-type exact entry-op lt entry-val {5120000} poll-interval 90action 1.0 syslog priority critical msg Memory exhausted; current available memory is $_snmp_oid_val bytesaction 2.0 force-switchoverIn the following example, the show event manager policy registered privileged EXEC command is used to show that applet IPSLAping1 has been removed after entering the no event manager policy command:
Router# show event manager policy registeredNo. Class Type Event Type Trap Time Registered Name1 applet system snmp Off Thu Sep 15 05:57:16 2005 memory-failoid {1.3.6.1.4.1.9.9.48.1.1.1.6.1} get-type exact entry-op lt entry-val {5120000} poll-interval 90action 1.0 syslog priority critical msg Memory exhausted; current available memory is $_snmp_oid_val bytesaction 2.0 force-switchoverSuspending Embedded Event Manager Policy Execution
Perform this task to immediately suspend the execution of all EEM policies. Suspending policies, instead of unregistering them might be necessary for reasons of temporary performance or security.
SUMMARY STEPS
1.
2.
3.
4.
5.
DETAILED STEPS
Configuring and Tracking a Stub Object Using Embedded Event Manager
Perform this task to create a stub object, set the state of the stub object, and configure an EEM applet to be run when the tracked object changes. Actions are specified within the EEM applet to both set and read the state of the object. This task allows EEM to define an enhanced object tracking (EOT) object that may be manipulated by other EOT clients. An EEM policy can be a trigger for any EOT object including objects defined for other EOT clients or for an object defined by EEM.
Enhanced Object Tracking
Object tracking was first introduced into the Hot Standby Router Protocol (HSRP) as a simple tracking mechanism that allowed you to track the interface line-protocol state only. Enhanced object tracking provides complete separation between the objects to be tracked and the action to be taken by a client when a tracked object changes. Thus, several clients such as EEM, VRRP, or GLBP can register their interest with the tracking process, track the same object, and each take different action when the object changes.
Each tracked object is identified by a unique number that is specified on the tracking command-line interface (CLI). Client processes use this number to track a specific object. The tracking process periodically polls the tracked objects and notes any change of value. The changes in the tracked object are communicated to interested client processes, either immediately or after a specified delay. The object values are reported as either up or down.
The EOT event detector publishes an event when the tracked object changes.
SUMMARY STEPS
1.
2.
3.
4.
5.
6.
7.
8.
9.
10.
11.
DETAILED STEPS
Examples
In the following example, the show track privileged EXEC command is used to display information about tracked object number 2.
Router# show track 2Track 2Stub-objectState is Up1 change, last change 00:00:04, by UndefinedDisplaying Embedded Event Manager History Data
Perform this optional task to change the size of the history tables and to display EEM history data.
SUMMARY STEPS
1.
2.
3.
4.
5.
6.
DETAILED STEPS
Step 1
Enables privileged EXEC mode. Enter your password if prompted.
Router> enableStep 2
Enters global configuration mode.
Router# configure terminalStep 3
Use this command to change the size of the EEM event history table or the size of the EEM SNMP trap history table. In the following example, the size of the EEM event history table is changed to 30 entries:
Router(config)# event manager history size events 30Step 4
Exits global configuration mode and returns to privileged EXEC mode.
Router(config)# exitStep 5
Use this command to display detailed information about each EEM event, for example:
Router# show event manager history eventsNo. Time of Event Event Type Name1 Fri Aug13 21:42:57 2004 snmp applet: SAAping12 Fri Aug13 22:20:29 2004 snmp applet: SAAping13 Wed Aug18 21:54:48 2004 snmp applet: SAAping14 Wed Aug18 22:06:38 2004 snmp applet: SAAping15 Wed Aug18 22:30:58 2004 snmp applet: SAAping16 Wed Aug18 22:34:58 2004 snmp applet: SAAping17 Wed Aug18 22:51:18 2004 snmp applet: SAAping18 Wed Aug18 22:51:18 2004 application applet: CustApp1Step 6
Use this command to display the EEM SNMP traps that have been sent either from the EEM server or from an EEM policy. In the following example, the EEM SNMP traps that were triggered from within an EEM policy are displayed.
Router# show event manager history traps policyNo. Time Trap Type Name1 Wed Aug18 22:30:58 2004 policy EEM Policy Director2 Wed Aug18 22:34:58 2004 policy EEM Policy Director3 Wed Aug18 22:51:18 2004 policy EEM Policy Director
Displaying Embedded Event Manager Registered Policies
Perform this optional task to display registered EEM policies.
SUMMARY STEPS
1.
2.
DETAILED STEPS
Step 1
Enables privileged EXEC mode. Enter your password if prompted.
Router> enableStep 2
Use this command with the time-ordered keyword to display information about currently registered policies sorted by time, for example:
Router# show event manager policy registered time-orderedNo. Type Event Type Time Registered Name1 applet snmp Thu May30 05:57:16 2004 memory-failoid {1.3.6.1.4.1.9.9.48.1.1.1.6.1} get-type exact entry-op lt entry-val {5120000} poll-interval 90action 1.0 syslog priority critical msg "Memory exhausted; current available memory is $_snmp_oid_val bytes"action 2.0 force-switchover2 applet syslog Wed Jul16 00:05:17 2004 intf-downpattern {.*UPDOWN.*Ethernet1/0.*}action 1.0 cns-event msg "Interface state change: $_syslog_msg"Use this command with the name-ordered keyword to display information about currently registered policies sorted by name, for example:
Router# show event manager policy registered name-orderedNo. Type Event Type Time Registered Name1 applet syslog Wed Jul16 00:05:17 2004 intf-downpattern {.*UPDOWN.*Ethernet1/0.*}action 1.0 cns-event msg "Interface state change: $_syslog_msg"2 applet snmp Thu May30 05:57:16 2004 memory-failoid {1.3.6.1.4.1.9.9.48.1.1.1.6.1} get-type exact entry-op lt entry-val {5120000} poll-interval 90action 1.0 syslog priority critical msg "Memory exhausted; current available memory is $_snmp_oid_val bytes"action 2.0 force-switchoverUse this command with the event-type keyword to display information about currently registered policies for the event type specified in the event-name argument, for example:
Router# show event manager policy registered event-type syslogNo. Type Event Type Time Registered Name1 applet syslog Wed Jul16 00:05:17 2004 intf-downpattern {.*UPDOWN.*Ethernet1/0.*}action 1.0 cns-event msg "Interface state change: $_syslog_msg"
Configuration Examples for Writing EEM Policies Using the Cisco IOS CLI
This section contains the following configuration examples:
•
•
•
•
Embedded Event Manager Applet Configuration: Examples
The following examples show how to create an EEM applet for some of the EEM event detectors. These examples follow steps outlined in the "Registering and Defining an Embedded Event Manager Applet" section.
Application-Specific Event Detector
The following example shows how a policy named EventPublish_A runs every 20 seconds and publishes an event type numbered 1 to an EEM subsystem numbered 798. The subsystem value of 798 specifies that a publish event has occurred from an EEM policy. A second policy named EventPublish_B is registered to run when the EEM event type 1 occurs with subsystem 798. When the EventPublish_B policy runs, it sends a message to syslog containing data passed as an argument from the EventPublish_A policy.
event manager applet EventPublish_Aevent timer watchdog time 20.0action 1.0 syslog msg "Applet EventPublish_A"action 2.0 publish-event sub-system 798 type 1 arg1 twentyexitevent manager applet EventPublish_Bevent application sub-system 798 type 1action 1.0 syslog msg "Applet EventPublish_B arg1 $_application_data1"CLI Event Detector
The following example shows how to specify an EEM applet to run when the Cisco IOS write memory CLI command is run. The applet provides a notification that this event has occurred via a syslog message. In the example, the sync keyword is configured with the yes argument, and this means that the event detector is notified when this policy completes running. The exit status of the policy determines whether the CLI command will be executed. In this example, the policy exit status is set to one and the CLI command runs.
event manager applet cli-matchevent cli pattern "write mem.*" sync yesaction 1.0 syslog msg "$_cli_msg Command Executed"set 2.0 _exit_status 1Counter Event Detector and Timer Event Detector
The following example shows that the EventCounter_A policy is configured to run once a minute and to increment a well-known counter called critical_errors. A second policy—EventCounter_B—is registered to be triggered when the well-known counter called critical_errors exceeds a threshold of 3. When the EventCounter_B policy runs, it resets the counter to 0.
event manager applet EventCounter_Aevent timer watchdog time 60.0action 1.0 syslog msg "EventCounter_A"action 2.0 counter name critical_errors op inc value 1exitevent manager applet EventCounter_Bevent counter name critical_errors entry-op gt entry-val 3 exit-op lt exit-val 3action 1.0 syslog msg "EventCounter_B"action 2.0 counter name critical_errors op set value 0Interface Counter Event Detector
The following example shows how a policy named EventInterface is triggered every time the receive_throttle counter for Fast Ethernet interface 0/0 is incremented by 5. The polling interval to check the counter is specified to run once every 90 seconds.
event manager applet EventInterfaceevent interface name FastEthernet0/0 parameter receive_throttle entry-op ge entry-val 5entry-val-is-increment true poll-interval 90action 1.0 syslog msg "Applet EventInterface"Resource Event Detector
The following example shows how to specify event criteria based on an ERM event report for a policy defined to report high CPU usage:
event manager applet policy-oneevent resource policy cpu-highaction 1.0 syslog msg "CPU high at $_resource_current_value percent"RF Event Detector
The RF event detector is only available on networking devices that contain dual Route Processors (RPs). The following example shows how to specify event criteria based on an RF state change notification:
event manager applet start-rfevent rf event rf_prog_initializationaction 1.0 syslog msg "rf state rf_prog_initialization reached"Syslog Event Detector
The following example shows how to specify an EEM applet to run when syslog identifies that Ethernet interface 1/0 is down. The applet sends a message about the interface to syslog.
event manager applet interface-downevent syslog pattern ".*UPDOWN.*Ethernet1/0.*" occurs 4action 1.0 syslog msg "Ethernet interface 1/0 changed state 4 times"SNMP Event Detector
The following example shows how to specify an EEM applet to run when the CPU usage is greater than 75 percent. When the EEM applet runs, the CLI commands enable and show cpu processes are run, and an e-mail containing the result of the show cpu processes command is sent to an engineer.
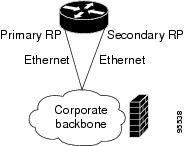
event manager applet snmpcpuge75event snmp oid 1.3.6.1.4.1.9.9.109.1.1.1.1.3.1 get-type exact entry-op ge entry-val 75 poll-interval 10action 1.0 cli command "enable"action 2.0 cli command "show process cpu"action 3.0 mail server "192.168.1.146" to "engineer@cisco.com" from "devtest@cisco.com" subject "B25 PBX Alert" body "$_cli_result"The next example is more complex and shows how to configure an EEM applet that causes a switch to the secondary (redundant) Route Processor (RP) when the primary RP runs low on memory.
This example illustrates a method for taking preventative action against a software fault that causes a memory leak. The action taken here is designed to reduce downtime by switching over to a redundant RP when a possible memory leak is detected.
Figure 1 Dual RP Topology
The commands used to register the policy are shown below.
event manager applet memory-demoevent snmp oid 1.3.6.1.4.1.9.9.48.1.1.1.6.1 get-type exact entry-op lt entry-val 5120000 poll-interval 90action 1.0 syslog priority critical msg "Memory exhausted; current available memory is $_snmp_oid_val bytes"action 2.0 force-switchoverThe registered applet is displayed using the show event manager policy registered command:
Router# show event manager policy registeredNo. Type Event Type Time Registered Name1 applet snmp Thu Jan30 05:57:16 2003 memory-demooid {1.3.6.1.4.1.9.9.48.1.1.1.6.1} get-type exact entry-op lt entry-val {5120000} poll-interval 90action 1.0 syslog priority critical msg "Memory exhausted; current available memory is $_snmp_oid_val bytes"action 2.0 force-switchoverFor the purpose of this example, a memory depletion is forced on the router, and a series of show memory commands are executed to watch the memory deplete:
Router# show memoryHead Total(b) Used(b) Free(b) Lowest(b) Largest(b)Processor 53585260 212348444 119523060 92825384 92825384 92365916Fast 53565260 131080 70360 60720 60720 60668Router# show memoryHead Total(b) Used(b) Free(b) Lowest(b) Largest(b)Processor 53585260 212364664 164509492 47855172 47855172 47169340Fast 53565260 131080 70360 60720 60720 60668Router# show memoryHead Total(b) Used(b) Free(b) Lowest(b) Largest(b)Processor 53585260 212369492 179488300 32881192 32881192 32127556Fast 53565260 131080 70360 60720 60720 60668When the threshold is reached, an EEM event is triggered. The applet named memory-demo runs, causing a syslog message to be written to the console and a switch to be made to the secondary RP. The following messages are logged:
00:08:31: %HA_EM-2-LOG: memory-demo: Memory exhausted; current available memory is
4484196 bytes
00:08:31: %HA_EM-6-FMS_SWITCH_HARDWARE: fh_io_msg: Policy has requested a hardware switchoverThe following is partial output from the show running-config command on both the primary RP and the secondary (redundant) RP:
redundancymode sso...!event manager applet memory-demoevent snmp oid 1.3.6.1.4.1.9.9.48.1.1.1.6.1 get-type exact entry-op lt entry-val 5120000 poll-interval 90action 1.0 syslog priority critical msg "Memory exhausted; current available memory is $_snmp_oid_val bytes"action 2.0 force-switchoverEmbedded Event Manager Manual Policy Execution: Examples
The following examples show how to use the none event detector to configure an EEM policy (applet or script) to be run manually.
Using the event manager run Command
This example shows how to run a policy manually using the event manager run command. The policy is registered using the event none command under applet configuration mode and then run from global configuration mode using the event manager run command.
event manager applet manual-policyevent noneaction 1.0 syslog msg "Manual-policy triggered"end!event manager run manual-policyUsing the action policy Command
This example shows how to run a policy manually using the action policy command. The policy is registered using the event none command under applet configuration mode, and then the policy is executed using the action policy command in applet configuration mode.
event manager applet manual-policyevent noneaction 1.0 syslog msg "Manual-policy triggered"exit!event manager applet manual-policy-twoevent noneaction 1.0 policy manual-policyend!event manager run manual-policy-twoConfiguring and Tracking a Stub Object Using Embedded Event Manager: Example
This example shows how to create a stub object, set the state of the stub object, and configure an EEM applet to be run when the tracked object changes. The enhanced object tracking (EOT) event detector is used, and actions are specified to both set and read the state of the object. This example allows EEM to define an EOT object that may be manipulated by other EOT clients. An EEM policy can be a trigger for any EOT object including objects defined for other EOT clients or for an object defined by EEM.
track 10 stub-objectdefault-state down!event manager applet track-tenevent track 10 state anyaction 1.0 track set 10 state upaction 2.0 track read 10Embedded Event Manager Watchdog System Monitor (Cisco IOS) Event Detector Configuration: Example
The following example shows how to configure three EEM applets to demonstrate how the Cisco IOS watchdog system monitor (IOSWDSysMon) event detector works.
Watchdog System Monitor Sample1 Policy
The first policy triggers an applet when the average CPU usage for the process named IP Input is greater than or equal to 1 percent for 10 seconds:
event manager applet IOSWD_Sample1event ioswdsysmon sub1 cpu-proc taskname "IP Input" op ge val 1 period 10action 1.0 syslog msg "IOSWD_Sample1 Policy Triggered"Watchdog System Monitor Sample2 Policy
The second policy triggers an applet when the total amount of memory used by the process named Net Input is greater than 100 kb:
event manager applet IOSWD_Sample2event ioswdsysmon sub1 mem-proc taskname "Net Input" op gt val 100 is-percent falseaction 1.0 syslog msg "IOSWD_Sample2 Policy Triggered"Watchdog System Monitor Sample3 Policy
The third policy triggers an applet when the total amount of memory used by the process named IP RIB Update has increased by more than 50 percent over the sample period of 60 seconds:
event manager applet IOSWD_Sample3event ioswdsysmon sub1 mem-proc taskname "IP RIB Update" op gt val 50 is-percent true period 60action 1.0 syslog msg "IOSWD_Sample3 Policy Triggered"The three policies are configured, and then repetitive large pings are made to the networking device from several workstations, causing the networking device to register some usage. This will trigger policies 1 and 2, and the console will display the following messages:
00:42:23: %HA_EM-6-LOG: IOSWD_Sample1: IOSWD_Sample1 Policy Triggered00:42:47: %HA_EM-6-LOG: IOSWD_Sample2: IOSWD_Sample2 Policy TriggeredTo view the policies that are registered, use the show event manager policy registered command:
Router# show event manager policy registeredNo. Class Type Event Type Trap Time Registered Name1 applet system ioswdsysmon Off Fri Jul 23 02:27:28 2004 IOSWD_Sample1sub1 cpu_util {taskname {IP Input} op ge val 1 period 10.000 }action 1.0 syslog msg "IOSWD_Sample1 Policy Triggered"2 applet system ioswdsysmon Off Fri Jul 23 02:23:52 2004 IOSWD_Sample2sub1 mem_used {taskname {Net Input} op gt val 100 is_percent FALSE}action 1.0 syslog msg "IOSWD_Sample2 Policy Triggered"3 applet system ioswdsysmon Off Fri Jul 23 03:07:38 2004 IOSWD_Sample3sub1 mem_used {taskname {IP RIB Update} op gt val 50 is_percent TRUE period 60.000 }action 1.0 syslog msg "IOSWD_Sample3 Policy Triggered"Where to Go Next
•
•
Additional References
The following sections provide references related to writing EEM policies Using the Cisco IOS CLI.
Related Documents
Software Modularity commands (including EEM commands): complete command syntax, defaults, command mode, command history, usage guidelines, and examples
Cisco IOS Software Modularity Command Reference, Release 12.2(18)SXF4
Network Management commands (including EEM commands): complete command syntax, defaults, command mode, command history, usage guidelines, and examples
•
•
•
Embedded Event Manager technical overview
Embedded Event Manager policy writing using Tcl
Configuration of other network management technologies
Cisco IOS Network Management Configuration Guide, Release 12.4T.
Embedded Resource Manager
"Embedded Resource Manager" module
Configuring enhanced object tracking
CNS event agent
CNS Event Agent feature document, Release 12.2(2)T
CNS configuration engine
Cisco CNS Configuration Registrar: Installing and Configuring the IE2100
Standards
No new or modified standards are supported, and support for existing standards has not been modified.
—
MIBs
CISCO-EMBEDDED-EVENT-MGR-MIB
To locate and download MIBs for selected platforms, Cisco IOS releases, and feature sets, use Cisco MIB Locator found at the following URL:
RFCs
No new or modified RFCs are supported, and support for existing RFCs has not been modified.
—
Technical Assistance
Feature Information for Writing EEM Policies Using the Cisco IOS CLI
Table 5 lists the features in this module and provides links to specific configuration information. Only features that were introduced or modified in Cisco IOS Releases 12.3(14)T, 12.2(25)S, 12.0(26)S, 12.2(18)SXF4, 12.2(28)SB, 12.2(33)SRA, or a later release appear in the table.
Not all commands may be available in your Cisco IOS software release. For release information about a specific command, see the command reference documentation.
Use Cisco Feature Navigator to find information about platform support and software image support. Cisco Feature Navigator enables you to determine which Cisco IOS and Catalyst OS software images support a specific software release, feature set, or platform. To access Cisco Feature Navigator, go to http://www.cisco.com/go/cfn. An account on Cisco.com is not required.
Note
Table 5 Feature Information for Writing EEM Policies Using the Cisco IOS CLI
Embedded Event Manager 1.0
12.0(26)S
12.3(4)TEEM 1.0 introduced Embedded Event Manager applet creation with the SNMP and syslog event detectors. EEM 1.0 also introduced the following actions: generating prioritized syslog messages, generating a CNS event for upstream processing by Cisco CNS devices, reloading the Cisco IOS software, and switching to a secondary processor in a fully redundant hardware configuration.
The following sections provide information about this feature:
•
•
•
•
•
The following commands were introduced by this feature: action cns-event, action force-switchover, action reload, action syslog, debug event manager, event manager applet, event snmp, event syslog, show event manager policy registered.
Embedded Event Manager 2.0
12.2(25)S
EEM 2.0 introduced the application-specific event detector, the counter event detector, the interface counter event detector, the timer event detector, and the watchdog event detector. New actions included modifying a named counter, publishing an application-specific event, and generating an SNMP trap. The ability to define environment variables and to run EEM policies written using Tcl was introduced, and two sample policies were included with the software.
The following sections provide information about this feature:
•
•
•
•
•
•
•
•
•
The following commands were introduced by this feature: action counter, action publish-event, action snmp-trap, event application, event counter, event interface, event ioswdsysmon, event manager environment, event manager history size, event manager policy, event manager scheduler suspend, event timer, show event manager environment, show event manager history events, show event manager history traps, show event manager policy available, show event manager policy pending.
Embedded Event Manager 2.1
12.3(14)T 12.2(18)SXF5
12.2(28)SB
12.2(33)SRAEEM 2.1 introduced some new event detectors and actions with new functionality to allow EEM policies to be run manually and the ability to run multiple concurrent policies. Support for Simple Network Management Protocol (SNMP) event detector rate-based events was provided as was the ability to create policies using Tool Command Language (Tcl).
The following sections provide information about this feature:
•
•
•
•
•
The following commands were introduced or modified by this feature: action cli, action counter, action info, action mail, action policy, debug event manager, event cli, event manager directory user, event manager policy, event manager run, event manager scheduler script, event manager session cli username, event none, event oir, event snmp, event syslog, set (EEM), show event manager directory user, show event manager policy registered, show event manager session cli username.
Embedded Event Manager 2.1 (Software Modularity)
12.2(18)SXF4Cisco IOS Software Modularity images
EEM 2.1 for Software Modularity images introduced the GOLD, system manager, and WDSysMon (Cisco IOS Software Modularity watchdog) event detectors, and the ability to display Cisco IOS Software Modularity processes and process metrics.
The following sections provide information about this, feature:
•
•
•
•
The following commands were introduced by this feature: event gold, event process, show event manager metric process.
Note
Embedded Event Manager 2.2
12.4(2)T
12.2(31)SB3
12.2(33)SRBEEM 2.2 introduced the enhanced object tracking, resource, and RF event detectors. The actions of reading and setting the state of a tracked object were also introduced.
The following sections provide information about this feature:
•
•
•
•
•
The following commands were introduced or modified by this feature: action track read, action track set, default-state, event resource, event rf, event track, show track, track stub-object.
SNMP event detector delta environment variable1
12.4(11)T
A new SNMP event detector environment variable, __snmp_old_delta_val, was introduced.
Embedded Event Manager 2.3
12.2(33)SXH
EEM 2.3 introduced some new features relative to the Generic Online Diagnostics (GOLD) Event Detector on the Cisco Catalyst 6500 Series switches. The event gold command was enhanced to provide improved reaction to GOLD test failures and conditions.
The following section was updated to describe the enhanced functionality of the event gold command:
•
Read-only variables were added under the GOLD Event Detector category to provide access to platform-wide and test-specific GOLD event detector information for a detected event.
1 This is a minor enhancement. Minor enhancements are not typically listed in Feature Navigator.
Any Internet Protocol (IP) addresses used in this document are not intended to be actual addresses. Any examples, command display output, and figures included in the document are shown for illustrative purposes only. Any use of actual IP addresses in illustrative content is unintentional and coincidental.
© 2006-2007 Cisco Systems, Inc. All rights reserved.