Release Notes for Cisco Aironet Site Survey Utility 1.2
Available Languages
Table Of Contents
Release Notes for Cisco Aironet Site Survey Utility 1.2
Installing the Site Survey Utility
Opening the Site Survey Utility
Using the Associated AP Status Tab
Viewing the Access Point's Status
Generating an AP Scan Log File
Viewing an Accumulation of Access Points
Configuring the Proximity Beeper
Entering a Comment in the Threshold Log File
Viewing the Threshold Log File
Deleting the Threshold Log File
Finding the Version of the Site Survey Utility
Exiting the Site Survey Utility
Getting Bug Information on Cisco.com
Obtaining Documentation and Submitting a Service Request
Release Notes for Cisco Aironet Site Survey Utility 1.2
Contents
This document contains the following sections:
•
Installing the Site Survey Utility
•
•
•
•
•
•
Introduction
Cisco Aironet Site Survey Utility 1.2 is designed for use by people responsible for conducting a site survey with the CB21AG client adapter. It is useful in determining the best placement of infrastructure devices within a wireless network. The utility is a stand-alone application that runs from an executable file.

Note
System Requirements
You need the following in order to install and use Cisco Aironet Site Survey Utility 1.2:
•
Note
•
Note
•
Overview
The site survey utility can assist you in conducting a site survey. The utility operates at the RF level and is used to determine the best placement and coverage (overlap) for your network's infrastructure devices. During a site survey, the current status of the network is read from the client adapter, and the status display is updated four times per second so you can accurately gauge network performance. The feedback that you receive can help you to eliminate areas of low RF signal levels that can result in a loss of connection between the client adapter and its associated access point (or other infrastructure device).
The site survey utility operates in a passive mode. That is, it does not initiate any RF network traffic; it simply listens to the traffic that the client adapter hears and displays the results.
Guidelines
Keep the following guidelines in mind when preparing to perform a site survey:
•
•
Additional Information
Also consider the following operating and environmental conditions when performing a site survey:
•
•
•
•
•
Note
Installing the Site Survey Utility
Note
Follow these steps to install Cisco Aironet Site Survey Utility 1.2 on a computer running Windows 2000 or XP.
Step 1
http://www.cisco.com/cisco/web/download/index.html
Step 2
Step 3
Step 4
Note
Step 5
Step 6
Step 7
Step 8
Step 9
Step 10
Step 11
Step 12
Step 13
Step 14
Step 15
Step 16
Note
Step 17
Note
Step 18
The Setup Status window appears as the installation process begins.
Step 19
Opening the Site Survey Utility
To open the site survey utility, choose Start > Programs > Cisco Systems > Aironet Site Survey Utility.
Note
Selecting the Client Adapter
When the site survey utility starts, it scans for client adapters. If only one adapter is detected, it is selected automatically. However, if the utility detects multiple adapters or no adapters, the Select Adapter window appears (see Figure 1).
Note
Figure 1 Site Survey Utility - Select Adapter Window
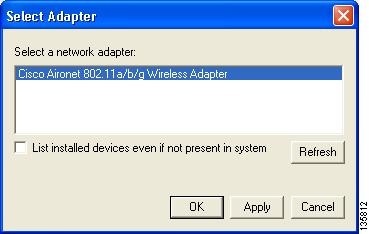
Follow these steps to select the desired client adapter.
Step 1
Step 2
Note
Step 3
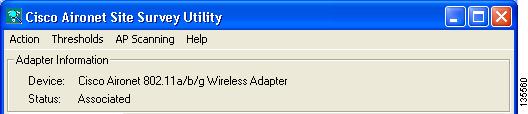
Figure 2 Site Survey Utility - Top of Main Window
Using the Associated AP Status Tab
You can perform these functions from the Associated AP Status tab:
•
•
Follow the instructions below to perform these functions.
Specifying Display Units
The Display in percent check box at the bottom of the Associated AP Status tab enables you to specify how display units are shown.
•
•
Viewing the Access Point's Status
The Associated AP Status tab shows the status of the access point to which your client adapter is associated. Figure 3 shows the tab with display units shown in dBm, and Figure 4 shows the tab with display units shown as a percentage.
Figure 3 Site Survey Utility - Associated AP Status Tab (with Display Units in dBm)
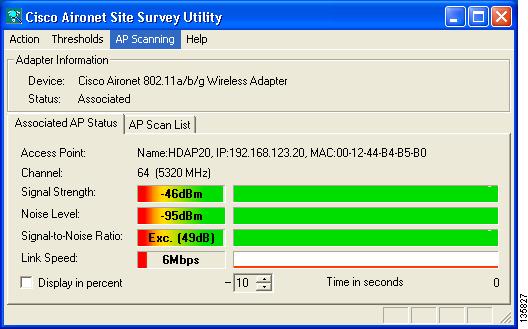
Figure 4 Site Survey Utility - Associated AP Status Tab (with Display Units as a Percentage)
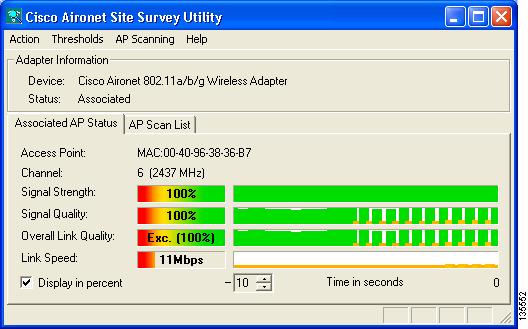
Table 1 interprets the information that is displayed on the Associated AP Status tab.
Note
Using the AP Scan List Tab
You can perform these functions from the AP Scan List tab:
•
•
•
•
•
Follow the instructions on the pages indicated to perform these functions.
Viewing the AP Scan List
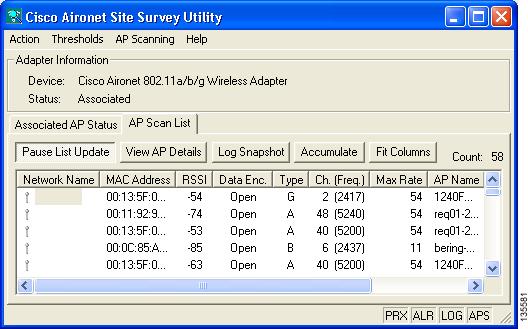
Your client adapter can detect nearby access points by the beacon signals that the access points continually transmit. The AP scan list displays a continuously updated list of the access points detected by your client adapter as well as the information contained in their beacons.
To view the AP scan list, click the AP Scan List tab. The AP scan list appears (see Figure 5).
Figure 5 Site Survey Utility - AP Scan List
To view the entire list of access points and all their information, perform one of the following:
•

•
•
Note
Table 2 interprets the information that is displayed in the AP scan list.
Note
Note
Table 2 Site Survey Utility - AP Scan List
Count
The number of rows, or access points, in the scan list.
Note
Network Name
The network name, or service set identifier (SSID), indicates the name of an available wireless network. The icon to the left of the SSID provides information on link status.

An available wireless network.

The wireless network to which your client adapter is currently associated.
Note
MAC Address
The access point's MAC address.
Note
RSSI
The received signal strength indicator (RSSI) is a measure of signal strength in decibels with respect to milliwatts (dBm).
Time of Day
The date and time when the signal strength of each access point was at its maximum. They appear in this format: 2005-07-20 16:13:09.
Note
Note
Data Encryption
Indicates whether the data exchanged with this access point is encrypted.
Value: Secure or Open
Secure
The data exchanged with this access point is encrypted.
Open
The data exchanged with this access point is unencrypted.
Type
The IEEE 802.11 standard that describes the access point's radio band.
Value: A, B, or GChannel (Frequency)
The channel and radio frequency (in MHz) that the access point is currently using for communications.
Value: Dependent on radio band and regulatory domainMax Rate
The maximum rate at which the client adapter can transfer data with an access point. The supported rates of both the client adapter and the access point are examined, and the highest rate that they have in common is the one that is used.
AP Name
The access point's name. It is shown only if the access point was configured with a name, Aironet Extensions are enabled (on access points running Cisco IOS Release 12.2(4)JA or later), and the access point transmits this information.
Note
Load
The access point's channel utilization in terms of traffic and throughput.
Value: 0 to 100%Note
CCX
The version of Cisco Compatible Extensions (CCX) supported by the access point. It is shown only if the access point transmits this information.
Value: 1, 2, 3, or 4Other Information
A list of miscellaneous values that may appear depending on the access point's current status and the information that it transmits.
Values: See table below.
Ad-Hoc
Indicates that the device is not an access point but another client adapter operating in ad hoc mode.
CAC
Indicates that the access point is using distributed call admission control (CAC).
CEC
Indicates that the access point is using Cisco extended capabilities (CEC).
Power
Indicates that the access point can limit the transmitting power of the client adapter. The power limit is shown in milliwatts (mW).
Qos
Indicates that the access point is using quality of service (QoS). QoS on wireless LANs (WLAN) provides prioritization of traffic from the access point over the WLAN based on traffic classification.
RM-Normal RM-APScan RM-CliWlk
Indicates that the access point is using radio management. RM-Normal indicates normal status, RM-APScan indicates AP radio scan, and RM-CliWlk indicates client walkabout. Any unrecognized value appears as RM-State?.
Ssidl
Indicates that the access point is using the SSID List feature. The number of hidden SSIDs is shown as a number (for example, Ssidl:2).
WMM
Indicates that the access point is using Wi-Fi Multimedia (WMM), a component of the IEEE 802.11e wireless LAN standard for quality of service (QoS).
WPA
Indicates that the access point is using Wi-Fi Protected Access (WPA), a standards-based security solution from the Wi-Fi Alliance that provides data protection and access control for wireless LAN systems. It is compatible with the IEEE 802.11i standard but was implemented prior to the standard's ratification. WPA uses TKIP and MIC for data protection and 802.1X for authenticated key management.
WPA2
Indicates that the access point is using Wi-Fi Protected Access 2 (WPA2), the next generation of Wi-Fi security. It is the Wi-Fi Alliance's implementation of the ratified IEEE 802.11i standard. WPA2 uses AES-CCMP for data protection and 802.1X for authenticated key management.
Pausing the AP Scan List
The AP scan list is updated continually. To pause the current list, click Pause List Update above the AP scan list.
Note
Note
Viewing AP Details
To view details for a particular access point in the AP scan list, select the desired network name in the scan list and click View AP Details. The AP Detailed Information window appears (see Figure 6).
Note
Figure 6 Site Survey Utility - AP Detailed Information Window
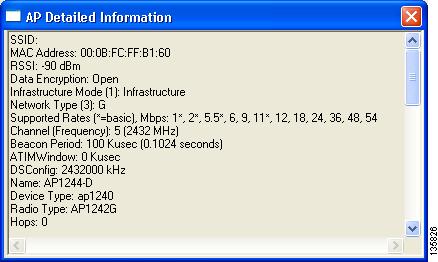
Table 3 interprets the information that is displayed in the AP Detailed Information window.
Note
Note
Generating an AP Scan Log File
To enter the current contents of the AP scan list into a log file, click Log Snapshot. The "Logged current AP Scan List" message appears below the scan list, and the log file is saved. The default filename is SST_APScanLog.txt, and the default location is the directory where the site survey utility is installed.
Note
If the AP scan list is paused when you click Log Snapshot, the currently displayed data (not the latest available data) is added to the log. Each time you click Log Snapshot, the new scan list is written at the end of the existing log file.
To view the log file, choose View AP Scan Log from the AP Scanning drop-down menu. The log file opens in the configured viewer (see Figure 7).
Note
Figure 7 Site Survey Utility - AP Scan Log File
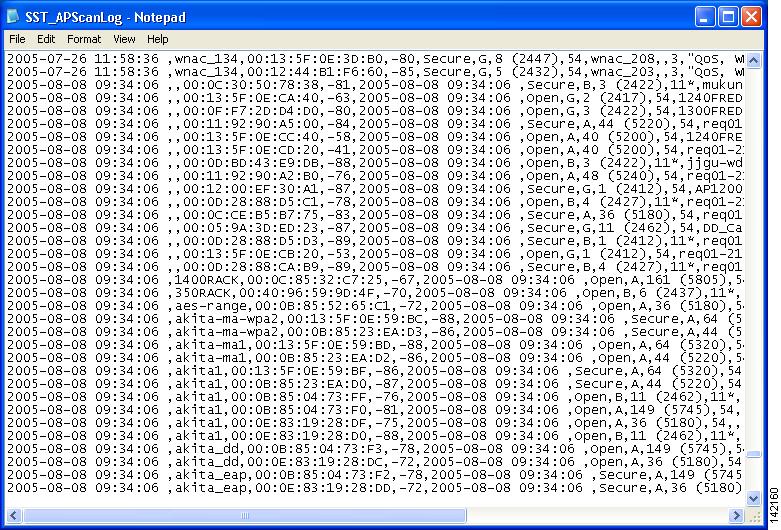
The log entries are time-stamped and appear in ASCII text. Each line typically represents a different access point.
Note
Note
Viewing an Accumulation of Access Points
Clicking the Accumulate button changes the behavior of the AP scan list. Instead of displaying only the current AP scan list, the list includes all of the access points (based on MAC address) that have appeared in the scan list since the Accumulate button was last clicked.
After a scan line is added to the list, it is never removed nor updated with new scan information unless the signal strength (RSSI) of the latest scan is greater than or equal to any detected previously from that access point. The Time of Day field, which appears only in Accumulate mode, indicates the date and time when the signal strength of each access point was at its maximum.
The Accumulate mode provides a convenient way to list all access points within a facility, not just those that may be visible at one time from a particular location. By using the information in the Time of Day field with a site map and a wristwatch, you may be able to determine the approximate location of each access point in the list.
Note
Note
Using the Proximity Beeper
You can use the site survey utility's proximity beeper to identify areas where wireless coverage is good or weak based on the client adapter's proximity to access points within a particular area. The beeper can be set to sound as the client adapter approaches or moves farther away from an access point.
Configuring the Proximity Beeper
Follow these steps to configure the proximity beeper.
Step 1
Figure 8 Site Survey Utility - Options Window
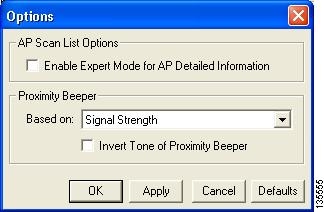
Step 2
Step 3
•
•
Step 4
Step 5
Enabling the Proximity Beeper
To enable the proximity beeper, choose Enable Proximity Beeper from the Action drop-down menu or press F6. When the beeper is enabled, a check mark appears next to the Enable Proximity Beeper menu option, and PRX appears in the site survey utility's status bar.
Note
Using Thresholds
You can perform these threshold-related functions:
•
•
•
•
•
Follow the instructions on the pages indicated to perform these functions.
Configuring Threshold Values
Follow these steps to configure threshold values that trigger audible alerts, entries in the threshold log file, or both.
Step 1
Figure 9 Site Survey Utility - Threshold Logging Configuration Window
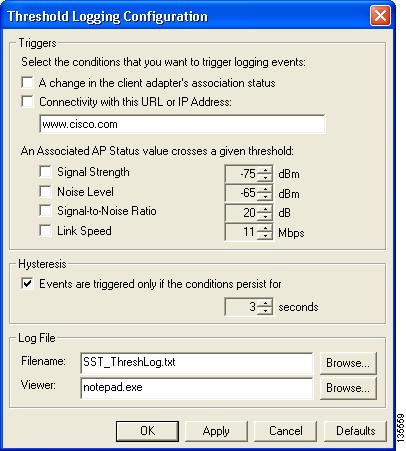
Step 2
Note
Step 3
Range: 1 to 10 secondsDefault: Checked; 3 seconds
Note
Step 4
Default Name: SST_ThreshLog.txtDefault Location: The directory where the site survey utility is installedStep 5
Default Program: Notepad.exeStep 6
Step 7
Enabling Threshold Triggers
In the previous section, you specified the conditions under which threshold triggers are generated, provided those triggers are enabled.
To enable audible alerts when a threshold condition occurs, choose Enable Threshold Alerts from the Thresholds drop-down menu or press F7. When threshold alerts are enabled, a check mark appears next to the Enable Threshold Alerts menu option, and ALR appears in the site survey utility's status bar.
To enable the logging of text messages to the threshold log file when a threshold condition occurs, choose Enable Threshold Logging from the Thresholds drop-down menu or press F8. When threshold logging is enabled, a check mark appears next to the Enable Threshold Logging menu option, and LOG appears in the site survey utility's status bar.
Note
Note
Entering a Comment in the Threshold Log File
Follow these steps if you want to enter a comment in the threshold log file.
Step 1
Figure 10 Site Survey Utility - Add Comments to Log File Window

Step 2
Step 3
Note
Viewing the Threshold Log File
Follow these steps to view the threshold log file from within the site survey utility.
Note
Step 1
Note
Note
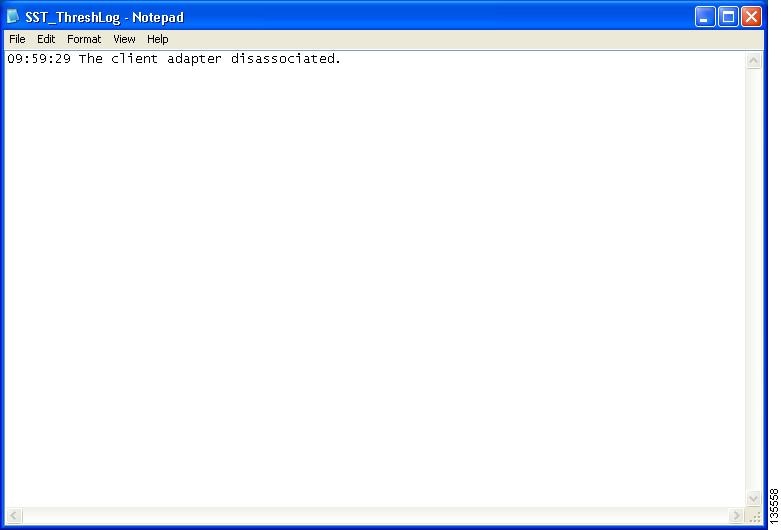
Figure 11 Site Survey Utility - Threshold Log File Window
Step 2
Deleting the Threshold Log File
Follow these steps to delete the threshold log file.
Step 1
Note
Step 2
Using AP Scanning
You can perform these functions related to AP scanning:
•
•
•
•
•
•
Follow the instructions on the pages indicated to perform these functions.
Configuring AP Scan Logging
Follow these steps to configure the site survey utility to automatically copy the contents of the AP scan list to a log file.
Step 1
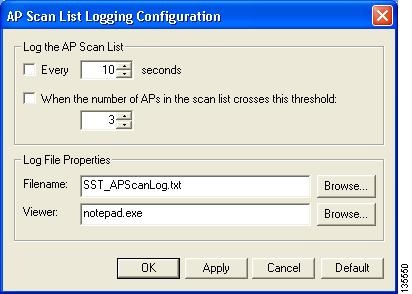
Figure 12 Site Survey Utility - AP Scan List Logging Configuration Window
Step 2
Step 3
Default Name: SST_APScanLog.txtDefault Location: The directory in which the site survey utility is installed
Note
Step 4
Default Program: Notepad.exe
Note
Step 5
Step 6
Enabling AP Scan Logging
To enable the site survey utility to automatically copy the contents of the AP scan list to a log file under the conditions specified above, choose Enable AP Scan Logging from the AP Scanning drop-down menu or press F9. When AP scan logging is enabled, a check mark appears next to the Enable AP Scan Logging menu option, and APS appears in the site survey utility's status bar.
Note
Note
Viewing the AP Scan Log
Follow these steps to view the AP scan log file from within the site survey utility.
Note
Step 1
Note
Note
Figure 13 Site Survey Utility - AP Scan Log File
The log entries are time-stamped and appear in ASCII text. Each line typically represents a different access point.
Note
Note
Step 2
Deleting the AP Scan Log
Follow these steps to delete the AP scan log file.
Step 1
Note
Step 2
Saving the AP Scan List
Follow these steps to save the current contents of the AP scan list to a file.
Step 1
Note
Figure 14 Site Survey Utility - Save As Window
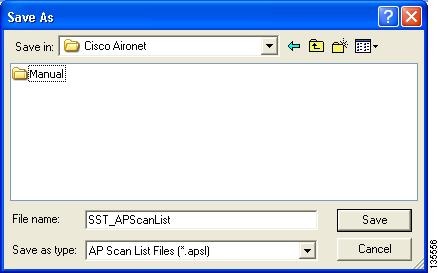
Step 2
Note
Step 3
Step 4
Opening the AP Scan List
Follow these steps to open a saved AP scan list file.
Step 1
Note
Figure 15 Site Survey Utility - Open Window
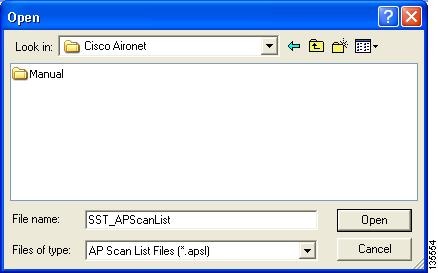
Step 2
Note
Step 3
Step 4
Note
Viewing the Status Bar
The site survey utility's status bar runs along the bottom of the window (see Figure 16).
Figure 16 Site Survey Utility - Status Bar

It consists of three sections:
•
•
•
Status Messages
The left side of the status bar displays status messages from the site survey utility. Table 4 lists and explains the messages that may appear.
Note
Indicators
The right side of the status bar can show up to four indicators:
•
•
•
•
Note
Resize Tab
The resize tab in the right corner of the status bar can be used to change the size of the site survey utility's main window. Simply click the resize tab and drag it until the window reaches the desired size.
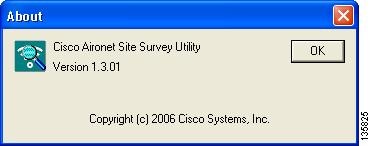
Finding the Version of the Site Survey Utility
To find the current version of the site survey utility, choose About from the Help drop-down menu. The About window appears (see Figure 17).
Figure 17 Site Survey Utility - About Window
Accessing Online Help
To access the site survey utility's online help, choose Contents from the Help drop-down menu.
Exiting the Site Survey Utility
To exit the site survey utility, perform one of the following:
•
•
Getting Bug Information on Cisco.com
If you are a Cisco registered user, you can use the Cisco TAC Software Bug Toolkit, which consists of three tools (Bug Navigator, Bug Watcher, and Search by Bug ID Number) that help you to identify existing bugs (or caveats) in Cisco software products.
Access the TAC Software Bug Toolkit at the following URL:
http://www.cisco.com/cgi-bin/Support/Bugtool/launch_bugtool.pl
Troubleshooting
For the most up-to-date, detailed troubleshooting information, refer to the Cisco TAC website at
http://www.cisco.com/en/US/support/index.html
Click Product Support > Wireless. Then choose your product and Troubleshooting to find information on the problem you are experiencing.
Obtaining Documentation and Submitting a Service Request
For information on obtaining documentation, submitting a service request, and gathering additional information, see the monthly What's New in Cisco Product Documentation, which also lists all new and revised Cisco technical documentation, at:
http://www.cisco.com/en/US/docs/general/whatsnew/whatsnew.html
Subscribe to the What's New in Cisco Product Documentation as a Really Simple Syndication (RSS) feed and set content to be delivered directly to your desktop using a reader application. The RSS feeds are a free service and Cisco currently supports RSS Version 2.0.
Cisco and the Cisco Logo are trademarks of Cisco Systems, Inc. and/or its affiliates in the U.S. and other countries. A listing of Cisco's trademarks can be found at www.cisco.com/go/trademarks. Third party trademarks mentioned are the property of their respective owners. The use of the word partner does not imply a partnership relationship between Cisco and any other company. (1005R)
Copyright © 2005 Cisco Systems, Inc.
All rights reserved.
 Feedback
Contact Cisco
- Open a Support Case

- (Requires a Cisco Service Contract)