- Preface
- Chapter 1 - Product Overview
- Chapter 2 - Preparing for Installation
- Chapter 3 - Installing the Client Adapter
- Chapter 4 - Using the Profile Manager
- Chapter 5 - Configuring the Client Adapter
- Chapter 6 - Using EAP Authentication
- Chapter 7 - Performing Diagnostics
- Chapter 8 - Routine Procedures
- Chapter 9 - Troubleshooting
- Appendix A - Technical Specifications
- Appendix B - Translated Safety Warnings
- Appendix C - Declarations of Conformity and Regulatory Information
- Appendix D - Channels, Power Levels, and Antenna Gains
- Appendix E - Configuring the Client Adapter through Windows CE .NET
- Appendix F - Performing a Site Survey
- Glossary
- Index
Cisco Aironet Wireless LAN Client Adapters Installation and Configuration Guide for Windows CE, OL-1375-04
Bias-Free Language
The documentation set for this product strives to use bias-free language. For the purposes of this documentation set, bias-free is defined as language that does not imply discrimination based on age, disability, gender, racial identity, ethnic identity, sexual orientation, socioeconomic status, and intersectionality. Exceptions may be present in the documentation due to language that is hardcoded in the user interfaces of the product software, language used based on RFP documentation, or language that is used by a referenced third-party product. Learn more about how Cisco is using Inclusive Language.
- Updated:
- May 4, 2007
Chapter: Appendix F - Performing a Site Survey
Performing a Site Survey
This appendix explains how ACU can be used when conducting a site survey.
The following topics are covered in this appendix:
•![]() Setting Signal Strength Display Units
Setting Signal Strength Display Units
•![]() Forcing the Client Adapter to Reassociate
Forcing the Client Adapter to Reassociate
Overview

Note ![]() This appendix applies only to people who are responsible for conducting a site survey to determine the best placement of infrastructure devices within a wireless network.
This appendix applies only to people who are responsible for conducting a site survey to determine the best placement of infrastructure devices within a wireless network.
ACU's site survey tool can assist you in conducting a site survey. The tool operates at the RF level and is used to determine the best placement and coverage (overlap) for your network's infrastructure devices. During a site survey, the current status of the network is read from the client adapter and displayed four times per second so you can accurately gauge network performance. The feedback that you receive can help you to eliminate areas of low RF signal levels that can result in a loss of connection between the client adapter and its associated access point (or other infrastructure device).
The site survey tool can be operated in two modes:
•![]() Passive Mode - This is the default site survey mode. It does not initiate any RF network traffic; it simply listens to the traffic that the client adapter hears and displays the results. Follow the instructions in the "Using Passive Mode" section to activate the passive mode.
Passive Mode - This is the default site survey mode. It does not initiate any RF network traffic; it simply listens to the traffic that the client adapter hears and displays the results. Follow the instructions in the "Using Passive Mode" section to activate the passive mode.
•![]() Active Mode - This mode causes the client adapter to actively send or receive low-level RF packets to or from its associated access point and provides information on the success rate. It also enables you to set parameters governing how the site survey is performed (such as the data rate). Follow the instructions in the "Using Active Mode" section to activate the active mode.
Active Mode - This mode causes the client adapter to actively send or receive low-level RF packets to or from its associated access point and provides information on the success rate. It also enables you to set parameters governing how the site survey is performed (such as the data rate). Follow the instructions in the "Using Active Mode" section to activate the active mode.
Guidelines
Keep the following guidelines in mind when preparing to perform a site survey:
•![]() Perform the site survey when the RF link is functioning with all other systems and noise sources operational.
Perform the site survey when the RF link is functioning with all other systems and noise sources operational.
•![]() Execute the site survey entirely from the mobile station.
Execute the site survey entirely from the mobile station.
•![]() When using the active mode, conduct the site survey with all variables set to operational values.
When using the active mode, conduct the site survey with all variables set to operational values.
Additional Information
Also consider the following operating and environmental conditions when performing a site survey:
•![]() Data rates - Sensitivity and range are inversely proportional to data bit rates. Therefore, the maximum radio range is achieved at the lowest workable data rate, and a decrease in receiver threshold sensitivity occurs as the radio data increases.
Data rates - Sensitivity and range are inversely proportional to data bit rates. Therefore, the maximum radio range is achieved at the lowest workable data rate, and a decrease in receiver threshold sensitivity occurs as the radio data increases.
•![]() Antenna type and placement - Proper antenna configuration is a critical factor in maximizing radio range. As a general rule, range increases in proportion to antenna height.
Antenna type and placement - Proper antenna configuration is a critical factor in maximizing radio range. As a general rule, range increases in proportion to antenna height.
•![]() Physical environment - Clear or open areas provide better radio range than closed or filled areas. Also, the less cluttered the work environment, the greater the range.
Physical environment - Clear or open areas provide better radio range than closed or filled areas. Also, the less cluttered the work environment, the greater the range.
•![]() Obstructions - A physical obstruction such as metal shelving or a steel pillar can hinder the performance of wireless devices. Avoid placing these devices in a location where a metal barrier is between the sending and receiving antennas.
Obstructions - A physical obstruction such as metal shelving or a steel pillar can hinder the performance of wireless devices. Avoid placing these devices in a location where a metal barrier is between the sending and receiving antennas.
•![]() Building materials - Radio penetration is greatly influenced by the building material used in construction. For example, drywall construction allows greater range than concrete blocks, and metal or steel construction is a barrier to radio signals.
Building materials - Radio penetration is greatly influenced by the building material used in construction. For example, drywall construction allows greater range than concrete blocks, and metal or steel construction is a barrier to radio signals.
Note ![]() Refer to the hardware installation guide for your infrastructure device for additional information on factors affecting placement.
Refer to the hardware installation guide for your infrastructure device for additional information on factors affecting placement.
Setting Signal Strength Display Units
Follow these steps to specify the units used to display signal strength on the Survey screen.
Step 1 ![]() Double-tap the ACU icon or select Start > Programs > Cisco > ACU. The Profiles screen appears.
Double-tap the ACU icon or select Start > Programs > Cisco > ACU. The Profiles screen appears.
Step 2 ![]() Tap the Options button. The ACU Options screen appears (see Figure F-1).
Tap the Options button. The ACU Options screen appears (see Figure F-1).
Figure F-1 ACU Options screen
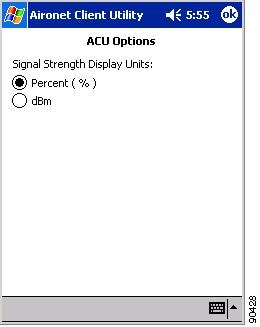
Step 3 ![]() Select one of the following options for Signal Strength Display Units:
Select one of the following options for Signal Strength Display Units:
•![]() Percent (%)—Displays the signal strength as a percentage. This is the default setting.
Percent (%)—Displays the signal strength as a percentage. This is the default setting.
•![]() dBm—Displays the signal strength in decibels with respect to milliwatts.
dBm—Displays the signal strength in decibels with respect to milliwatts.
Step 4 ![]() Tap OK to save your changes.
Tap OK to save your changes.
Using Passive Mode
Follow these steps to activate the site survey passive mode and obtain current information about RF network traffic.
Step 1 ![]() From the Profiles screen, tap the Survey tab. The Site Survey - Passive screen appears (see Figure F-2), provided a client adapter is installed in the Windows CE device and is running.
From the Profiles screen, tap the Survey tab. The Site Survey - Passive screen appears (see Figure F-2), provided a client adapter is installed in the Windows CE device and is running.
Figure F-2 shows the Site Survey - Passive Mode screen with the signal strength values displayed as percentages, and Figure F-3 shows the same screen with the signal strength values displayed in dBm.
Figure F-2 Site Survey - Passive Screen (with Signal Strength as a Percentage)
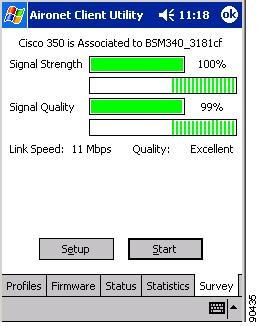
Figure F-3 Site Survey - Passive Screen (with Signal Strength in dBm)
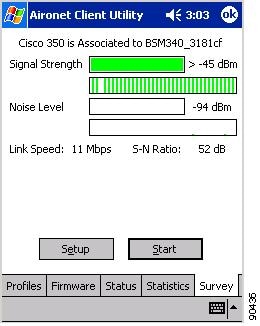
Table F-1 interprets the information that is displayed on the Site Survey - Passive screen.
|
|
|
|---|---|
The first line of the Site Survey - Passive screen |
Indicates the operational mode of your client adapter and the name or MAC address of any associated access point. Value: Not Associated, Associated, Authenticated, or Note |
Signal Strength |
The signal strength for all received packets. The higher the value and the more green the bar graph is, the stronger the signal. The histogram below the bar graph provides a visual interpretation of the current signal strength. Differences in signal strength are indicated by the following colors: green (strongest), yellow (middle of the range), and red (weakest). Range: 0 to 100% or -95 to -45 dBm |
Signal Quality |
The signal quality for all received packets. The higher the value and the more green the bar graph is, the clearer the signal. The histogram below the bar graph provides a visual interpretation of the current signal quality. Differences in signal quality are indicated by the following colors: green (highest quality), yellow (average), and red (lowest quality). Range: 0 to 100% Note |
Noise Level |
The level of background radio frequency energy in the 2.4-GHz band. The lower the value and the more green the bar graph is, the less background noise present. The histogram below the bar graph provides a visual interpretation of the current level of background noise. Differences in background noise level are indicated by the following colors: green (low noise), yellow (middle of the range), and red (high noise). Range: -100 to -45 dBm Note |
Link Speed |
In passive mode, the site survey tool monitors transmitted network traffic, and the data rate reflects the rate at which the packets are being transmitted. Value: 1, 2, 5.5, or 11 Mbps |
Quality |
The client adapter's ability to communicate with the access point. Value: Not Associated, Poor, Fair, Good, Excellent Note |
Signal to Noise (S-N) Ratio |
The difference between the signal strength and the noise level. The higher the value, the better the client adapter's ability to communicate with the access point. Range: 0 to 90 dB Note |
Step 2 ![]() If you want to activate the site survey active mode, go to the "Using Active Mode" section below. Otherwise, tap OK to exit the site survey tool.
If you want to activate the site survey active mode, go to the "Using Active Mode" section below. Otherwise, tap OK to exit the site survey tool.
Using Active Mode
Follow these steps to activate the site survey active mode and obtain current information about your client adapter's ability to transmit and receive RF packets.
Step 1 ![]() From the Site Survey - Passive screen (see Figure F-2), tap the Setup button. The Active Mode Setup screen appears (see Figure F-4).
From the Site Survey - Passive screen (see Figure F-2), tap the Setup button. The Active Mode Setup screen appears (see Figure F-4).
Figure F-4 Active Mode Setup Screen
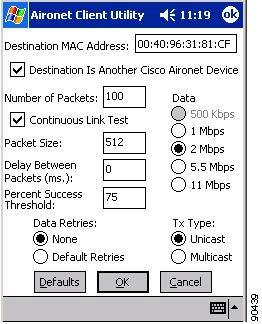
Table F-2 lists and describes the parameters that affect how the site survey is performed. Follow the instructions in the table to set any parameters.
Step 2 ![]() After setting any parameters, tap OK to save your settings. The Site Survey - Passive screen appears (see Figure F-2).
After setting any parameters, tap OK to save your settings. The Site Survey - Passive screen appears (see Figure F-2).
Step 3 ![]() Tap the Start button to run the site survey test. The Site Survey - Active screen appears.
Tap the Start button to run the site survey test. The Site Survey - Active screen appears.
Figure F-5 shows the Site Survey - Active screen with the signal strength values displayed as percentages, and Figure F-6 shows the same screen with the signal strength values displayed in dBm.
Figure F-5 Site Survey - Active Screen (with Signal Strength as a Percentage)

Figure F-6 Site Survey - Active Screen (with Signal Strength in dBm)
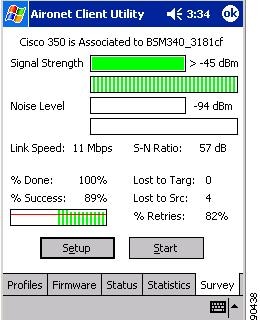
Table F-3 interprets the information that is displayed on the Site Survey - Active screen while the site survey test is running.
|
|
|
|---|---|
The first line of the Site Survey - Active screen |
Indicates the operational mode of your client adapter and the name or MAC address of any associated access point. Value: Not Associated, Associated, Authenticated, or Note |
Signal Strength |
The signal strength for all received packets. The higher the value and the more green the bar graph is, the stronger the signal. The histogram below the bar graph provides a visual interpretation of the current signal strength. Differences in signal strength are indicated by the following colors: green (strongest), yellow (middle of the range), and red (weakest). Range: 0 to 100% or -95 to -45 dBm |
Signal Quality |
The signal quality for all received packets. The higher the value and the more green the bar graph is, the clearer the signal. The histogram below the bar graph provides a visual interpretation of the current signal quality. Differences in signal quality are indicated by the following colors: green (highest quality), yellow (average), and red (lowest quality). Range: 0 to 100% Note |
Noise Level |
The level of background radio frequency energy in the 2.4-GHz band. The lower the value and the more green the bar graph is, the less background noise present. The histogram below the bar graph provides a visual interpretation of the current level of background noise. Differences in background noise level are indicated by the following colors: green (low noise), yellow (middle of the range), and red (high noise). Range: -100 to -45 dBm Note |
Link Speed |
The rate at which your client adapter is transmitting packets to or from its associated access point. Value: 1, 2, 5.5, or 11 Mbps |
Quality |
The client adapter's ability to communicate with the access point. Value: Not Associated, Poor, Fair, Good, Excellent Note |
Signal to Noise (S-N) Ratio |
The difference between the signal strength and the noise level. The higher the value, the better the client adapter's ability to communicate with the access point. Range: 0 to 90 dB Note |
Percent Done |
The percentage of packets that have been transmitted based on the number specified in the Number of Packets field. |
Percent Successful |
The percentage of packets that were transmitted successfully. The Percent Successful histogram provides a visual interpretation of the percentage of packets that are not lost. The value you set for the Percent Success Threshold is indicated by the red line. Percentages greater than or equal to this value are displayed as green bars; percentages below this value are displayed as yellow bars. Note |
Lost To Target |
The number of packets that were not transmitted successfully to the access point. |
Lost To Source |
The number of packets that were not received successfully from the access point. |
Percent Retries |
The percentage of packets that were retried for transmission. Note |
Step 4 ![]() When you tap the Stop button or when the Percent Complete reaches 100%, the active mode changes back to the passive mode.
When you tap the Stop button or when the Percent Complete reaches 100%, the active mode changes back to the passive mode.
Step 5 ![]() Tap OK to exit the site survey tool.
Tap OK to exit the site survey tool.
Forcing the Client Adapter to Reassociate
The client adapter will attempt to maintain its association to an access point for as long as it can. Therefore if you are on a fringe area while conducting a site survey, you may want to reinitialize (or restart) the client adapter in an attempt to force it to disassociate from the access point to which it is currently associated and reassociate to another access point.
Follow these steps to attempt to force the client adapter to disassociate from its current access point and reassociate to another during a site survey.
Step 1 ![]() Tap the Profiles tab.
Tap the Profiles tab.
Step 2 ![]() Perform one of the following:
Perform one of the following:
•![]() Change the active profile and then select it again.
Change the active profile and then select it again.
•![]() Select the active profile in the Manage Profiles box, tap the Edit button, and tap OK.
Select the active profile in the Manage Profiles box, tap the Edit button, and tap OK.
Step 3 ![]() Tap the Survey tab to return to the Site Survey screen. The first line of the Site Survey screen displays Not Associated while the client adapter disassociates from its current access point and then displays Associated once the adapter is reassociated to an access point.
Tap the Survey tab to return to the Site Survey screen. The first line of the Site Survey screen displays Not Associated while the client adapter disassociates from its current access point and then displays Associated once the adapter is reassociated to an access point.
 Feedback