- Preface
- Chapter 1: Overview
- Chapter 2: Adding and Deleting Mobility Services Engines Licenses
- Chapter 3: Synchronizing Mobility Services Engines
- Chapter 4: Configuring high Availability
- Chapter 5: MSE Delivery Modes
- Chapter 6: Configuring and Viewing System Properties
- Chapter 7: Managing Users and Groups
- Chapter 8 (wIPS) : Configuring wIPS and Profile
- Chapter 10: Monitoring the System and Services
- Chapter 11: MSAP
- Chapter 12: Performing Maintenance Operations
- Appendix A: wIPS Policy Alarm Encyclopedia
- Appendix B (wIPS): Rogue Management
- Appendix C (wIPS) : Radio Resource Management
- wIPS_Index
Cisco Adaptive Wireless Intrusion Prevention System Configuration Guide, Release 7.2.103.0
Bias-Free Language
The documentation set for this product strives to use bias-free language. For the purposes of this documentation set, bias-free is defined as language that does not imply discrimination based on age, disability, gender, racial identity, ethnic identity, sexual orientation, socioeconomic status, and intersectionality. Exceptions may be present in the documentation due to language that is hardcoded in the user interfaces of the product software, language used based on RFP documentation, or language that is used by a referenced third-party product. Learn more about how Cisco is using Inclusive Language.
- Updated:
- March 17, 2015
Chapter: Chapter 10: Monitoring the System and Services
Monitoring the System and Services
This chapter describes how to monitor the mobility services engine by configuring and viewing alarms, events, and logs as well as how to generate reports on system use and element counts (tags, clients, rogue clients, interferers, and access points).
It also describes how to use the NCS to monitor clients (wired and wireless), tags, chokepoints, and Wi-Fi TDOA receivers.
This chapter contains the following sections:
Working with Alarms
This section describes how to view, assign, and clear alarms and events on a mobility services engine using the NCS. It also describes how to define alarm notifications (all, critical, major, minor, warning) and detail how to e-mail those alarm notifications.
This section contains the following topics:
•![]() Viewing the MSE Alarm Details
Viewing the MSE Alarm Details
•![]() Assigning and Unassigning Alarms
Assigning and Unassigning Alarms
•![]() E-mailing Alarm Notifications
E-mailing Alarm Notifications
Guidelines and Limitations
Once the severity is Cleared, the alarm is deleted from the NCS after 30 days.
Viewing Alarms
To view mobility services engine alarms, follow these steps:
Step 1 ![]() Choose Monitor > Alarms.
Choose Monitor > Alarms.
Step 2 ![]() Click the Advanced Search link in the navigation bar. A configurable search dialog box for alarms appears.
Click the Advanced Search link in the navigation bar. A configurable search dialog box for alarms appears.
Step 3 ![]() Choose Alarms from the Search Category drop-down list.
Choose Alarms from the Search Category drop-down list.
Step 4 ![]() Choose the Severity of Alarms from the Severity drop-down list to display. The options are All Severities, Critical, Major, Minor, Warning, or Clear.
Choose the Severity of Alarms from the Severity drop-down list to display. The options are All Severities, Critical, Major, Minor, Warning, or Clear.
Step 5 ![]() Choose Mobility Service from the Alarm Category drop-down list.
Choose Mobility Service from the Alarm Category drop-down list.
Step 6 ![]() Choose the Condition from the Condition combo box. Alternatively, you can also enter the condition in the Condition in the combo box.
Choose the Condition from the Condition combo box. Alternatively, you can also enter the condition in the Condition in the combo box.
Step 7 ![]() From the Time Period drop-down list, choose the time frame for which you want to review alarms.
From the Time Period drop-down list, choose the time frame for which you want to review alarms.
The options range from minutes (5, 15, and 30) to hours (1 and 8) to days (1 and 7). To display all, choose Any time.
Step 8 ![]() Select the Acknowledged State check box to exclude the acknowledged alarms and their count in the Alarm Summary page.
Select the Acknowledged State check box to exclude the acknowledged alarms and their count in the Alarm Summary page.
Step 9 ![]() Select the Assigned State check box to exclude the assigned alarms and their count in the Alarm Summary page.
Select the Assigned State check box to exclude the assigned alarms and their count in the Alarm Summary page.
Step 10 ![]() From the Items per page drop-down list, choose the number of alarms to display in each page.
From the Items per page drop-down list, choose the number of alarms to display in each page.
Step 11 ![]() To save the search criteria for later use, select the Save Search check box and enter a name for the search.
To save the search criteria for later use, select the Save Search check box and enter a name for the search.

Note ![]() You can initiate the search thereafter by clicking the Saved Search link.
You can initiate the search thereafter by clicking the Saved Search link.
Step 12 ![]() Click Go. The alarms summary dialog box appears with search results.
Click Go. The alarms summary dialog box appears with search results.
Note ![]() Click the column headings (Severity, Failure Source, Owner, Date/Time, Message, and Acknowledged) to sort alarms.
Click the column headings (Severity, Failure Source, Owner, Date/Time, Message, and Acknowledged) to sort alarms.
Step 13 ![]() Repeat Step 2 to Step 12 to see Context-Aware Service notifications for the mobility services engine. Enter Context Aware Notifications as the alarm category in Step 5.
Repeat Step 2 to Step 12 to see Context-Aware Service notifications for the mobility services engine. Enter Context Aware Notifications as the alarm category in Step 5.
Viewing the MSE Alarm Details
To view MSE alarm details, follow these steps:
Step 1 ![]() Choose Monitor > Alarms.
Choose Monitor > Alarms.
Step 2 ![]() Click an MSE in the Failure Source column to access the alarms details for a particular MSE.
Click an MSE in the Failure Source column to access the alarms details for a particular MSE.
Alternatively, you can choose the Services > Services > MSE Name > System > Status > NCS Alarms page and click a particular MSE item in the Failure Source column to access the alarms details for a particular MSE (see Figure 9-1).
Figure 9-1 MSE Alarm
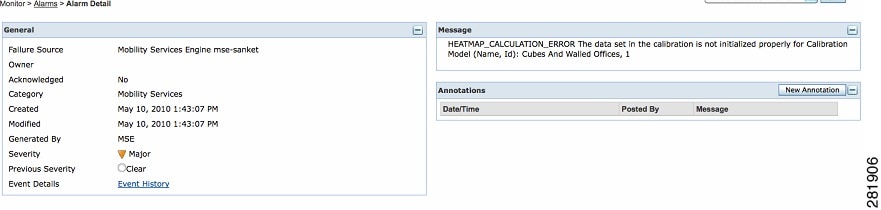
Table 9-1 lists the various fields in the Alarm Detail page for an MSE.
Note ![]() The General information may vary depending on the type of alarm. For example, some alarm details may include location and switch port tracing information.
The General information may vary depending on the type of alarm. For example, some alarm details may include location and switch port tracing information.
•![]() Annotations—Enter any new notes in this text box and click Add to update the alarm. Notes appear in the Annotations display page.
Annotations—Enter any new notes in this text box and click Add to update the alarm. Notes appear in the Annotations display page.
•![]() Messages—Shows information about the alarm.
Messages—Shows information about the alarm.
•![]() Audit Report—Click to view config audit alarm details. This report is only available for Config Audit alarms.
Audit Report—Click to view config audit alarm details. This report is only available for Config Audit alarms.
Configuration audit alarms are generated when audit discrepancies are enforced on config groups.
Note ![]() If enforcement fails, a critical alarm is generated on the config group. If enforcement succeeds, a minor alarm is generated on the config group.
If enforcement fails, a critical alarm is generated on the config group. If enforcement succeeds, a minor alarm is generated on the config group.
The alarms have links to the audit report where you can view a list of discrepancies for each controller.
•![]() Event History—Opens the MSE Alarm Events page to view events for this alarm. When there are multiple alarm page, the page numbers appear at the top of the page with a scroll arrow on each side. Use these scroll arrows to view additional alarms.
Event History—Opens the MSE Alarm Events page to view events for this alarm. When there are multiple alarm page, the page numbers appear at the top of the page with a scroll arrow on each side. Use these scroll arrows to view additional alarms.
The Select a command drop-down list provides access to the following functions:
•![]() Assign to me—Assign the selected alarm(s) to the current user.
Assign to me—Assign the selected alarm(s) to the current user.
•![]() Unassign—Unassign the selected alarm(s).
Unassign—Unassign the selected alarm(s).
•![]() Delete—Delete the selected alarm(s).
Delete—Delete the selected alarm(s).
•![]() Clear—Clear the selected alarm(s).
Clear—Clear the selected alarm(s).
Note ![]() Once the severity is Clear, the alarm is deleted from the NCS after 30 days.
Once the severity is Clear, the alarm is deleted from the NCS after 30 days.
•![]() Acknowledge—You can acknowledge the alarm to prevent it from showing up in the Alarm Summary page. The alarm remains in the NCS and you can search for all Acknowledged alarms using the alarm search functionality.
Acknowledge—You can acknowledge the alarm to prevent it from showing up in the Alarm Summary page. The alarm remains in the NCS and you can search for all Acknowledged alarms using the alarm search functionality.
•![]() Unacknowledge—You can choose to unacknowledge an already acknowledged alarm.
Unacknowledge—You can choose to unacknowledge an already acknowledged alarm.
•![]() Email Notification—Opens the All Alarms > Email Notification page to view and configure e-mail notifications.
Email Notification—Opens the All Alarms > Email Notification page to view and configure e-mail notifications.
•![]() Event History—Opens the Monitor > Events page to view events for this alarm.
Event History—Opens the Monitor > Events page to view events for this alarm.
Assigning and Unassigning Alarms
To assign and unassign an alarms, follow these steps:
Step 1 ![]() Choose Monitors > Alarms to display the Alarms page.
Choose Monitors > Alarms to display the Alarms page.
Step 2 ![]() Select the alarms that you want to assign to yourself by selecting their corresponding check boxes.
Select the alarms that you want to assign to yourself by selecting their corresponding check boxes.
Note ![]() To unassign an alarm assigned to you, unselect the box next to the appropriate alarm. You cannot unassign alarms assigned to others.
To unassign an alarm assigned to you, unselect the box next to the appropriate alarm. You cannot unassign alarms assigned to others.
Step 3 ![]() From the Select a command drop-down list, choose Assign to Me (or Unassign). Click Go.
From the Select a command drop-down list, choose Assign to Me (or Unassign). Click Go.
Deleting and Clearing Alarms
If you delete an alarm, the NCS removes it from its database. If you clear an alarm, it remains in the NCS database, but in the Clear state. You should clear an alarm when the condition that caused it no longer exists.
To delete or clear an alarm from a mobility services engine, follow these steps:
Step 1 ![]() Choose Monitors > Alarms to display the Alarms page.
Choose Monitors > Alarms to display the Alarms page.
Step 2 ![]() Select the alarms that you want to delete or clear by selecting their corresponding check boxes.
Select the alarms that you want to delete or clear by selecting their corresponding check boxes.
Step 3 ![]() From the Select a command drop-down list, choose Delete or Clear. Click Go.
From the Select a command drop-down list, choose Delete or Clear. Click Go.
E-mailing Alarm Notifications
The NCS lets you send alarm notifications to a specific e-mail address. Sending notifications through e-mail enables you to take prompt action when needed.
You can choose the alarm severity types (critical, major, minor, and warning) to have e-mailed to you.
To send alarm notifications, follow these steps:
Step 1 ![]() Choose Monitor > Alarms.
Choose Monitor > Alarms.
Step 2 ![]() From the Select a command drop-down list, choose Email Notification. Click Go. The Email Notification page appears (see Figure 9-2).
From the Select a command drop-down list, choose Email Notification. Click Go. The Email Notification page appears (see Figure 9-2).
Figure 9-2 All Alarms > Email Notification Page
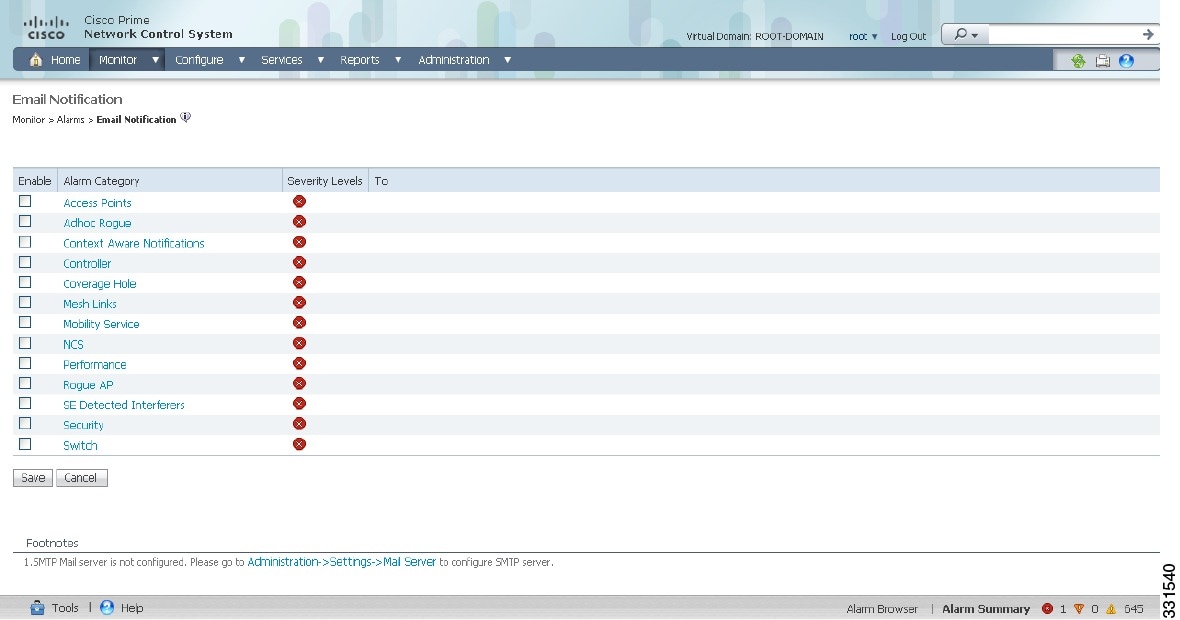
Note ![]() An SMTP mail server must be defined before you enter target e-mail addresses for e-mail notification. Choose Administration > Settings > Mail Server Configuration to enter the appropriate information.
An SMTP mail server must be defined before you enter target e-mail addresses for e-mail notification. Choose Administration > Settings > Mail Server Configuration to enter the appropriate information.
Step 3 ![]() Select the Enabled check box next to the Mobility Service.
Select the Enabled check box next to the Mobility Service.
Note ![]() Enabling the Mobility Service alarm category sends all alarms related to mobility services engine and the location appliance to the defined e-mail address.
Enabling the Mobility Service alarm category sends all alarms related to mobility services engine and the location appliance to the defined e-mail address.
Step 4 ![]() Click the Mobility Service link. The page for configuring the alarm severity types that are reported for the mobility services engine appears.
Click the Mobility Service link. The page for configuring the alarm severity types that are reported for the mobility services engine appears.
Step 5 ![]() Select the check box next to all the alarm severity types for which you want e-mail notifications sent.
Select the check box next to all the alarm severity types for which you want e-mail notifications sent.
Step 6 ![]() In the To text box, enter the e-mail address or addresses to which you want the e-mail notifications sent. Separate e-mail addresses by commas.
In the To text box, enter the e-mail address or addresses to which you want the e-mail notifications sent. Separate e-mail addresses by commas.
Step 7 ![]() Click OK.
Click OK.
You are returned to the Alarms > Notification page. The changes to the reported alarm severity levels and the recipient e-mail address for e-mail notifications are displayed.
Working with Events
You can use the NCS to view the mobility services engine and location notification events. You can search and display events based on their severity (critical, major, minor, warning, clear, and info) and event category.
Displaying Location Notification Events
To display location notification events, follow these steps:
Step 1 ![]() Choose Monitor > Events.
Choose Monitor > Events.
Step 2 ![]() In the Events page, you can perform the following:
In the Events page, you can perform the following:
•![]() If you want to display the events for a specific element, and you know its IP address, name, WLAN SSID, or MAC address, enter that value in the Search text box of the navigation bar. Click Search.
If you want to display the events for a specific element, and you know its IP address, name, WLAN SSID, or MAC address, enter that value in the Search text box of the navigation bar. Click Search.
•![]() To display events by severity and category, click Advanced Search in the navigation bar and choose the appropriate options from the Severity and Event Category drop-down list boxes. Click Go.
To display events by severity and category, click Advanced Search in the navigation bar and choose the appropriate options from the Severity and Event Category drop-down list boxes. Click Go.
Step 3 ![]() If the NCS finds events that match the search criteria, it shows a list of these events.
If the NCS finds events that match the search criteria, it shows a list of these events.
Note ![]() For more information about an event, click the failure source associated with the event. Additionally, you can sort the events summary by each of the column headings.
For more information about an event, click the failure source associated with the event. Additionally, you can sort the events summary by each of the column headings.
Working with Logs
This section describes how to configure logging options and how to download log files.
This section contains the following topics:
Guidelines and Limitations
•![]() When you are selecting an appropriate option from the logging level, make sure you use Error and Trace only when directed to do so by Cisco TAC personnel.
When you are selecting an appropriate option from the logging level, make sure you use Error and Trace only when directed to do so by Cisco TAC personnel.
•![]() Enable advanced debugging only under the guidance of Cisco TAC personnel because advanced debugging slows the mobility service down.
Enable advanced debugging only under the guidance of Cisco TAC personnel because advanced debugging slows the mobility service down.
Configuring Logging Options
You can use the NCS to specify the logging level and types of messages to log.
To configure logging options, follow these steps:
Step 1 ![]() Choose Services > Mobility Services Engines.
Choose Services > Mobility Services Engines.
Step 2 ![]() Click the name of the mobility services engine that you want to configure.
Click the name of the mobility services engine that you want to configure.
Step 3 ![]() From the System menu, choose Logs. The logging options for the selected mobility services engine appear.
From the System menu, choose Logs. The logging options for the selected mobility services engine appear.
Step 4 ![]() Choose the appropriate options from the Logging Level drop-down list.
Choose the appropriate options from the Logging Level drop-down list.
There are four logging options: Off, Error, Information, and Trace.
All log records with a log level of Error or above are logged to a new error log file locserver-error-%u-%g.log. This is an additional log file maintained along with the location server locserver-%u-%g.log log file. The error log file consists of logs of Error level along with their context information. The contextual information consists of 25 log records prior to the error. You can maintain up to 10 error log files. The maximum size allowed for each log file is 10 MB.

Step 5 ![]() Select the Enable check box next to each element listed in that section to begin logging of its events.
Select the Enable check box next to each element listed in that section to begin logging of its events.
Step 6 ![]() Select the Enable check box under Advanced Parameters to enable advanced debugging. By default, this option is disabled.
Select the Enable check box under Advanced Parameters to enable advanced debugging. By default, this option is disabled.
Step 7 ![]() To download log files from the server, click Download Logs. For more information, see Downloading Log Files.
To download log files from the server, click Download Logs. For more information, see Downloading Log Files.
Step 8 ![]() In the Log File group box, enter the following:
In the Log File group box, enter the following:
•![]() The number of log files to be maintained in the mobility services engine. You can maintain a minimum of 5 log files and a maximum of 20 log files in the mobility services engine.
The number of log files to be maintained in the mobility services engine. You can maintain a minimum of 5 log files and a maximum of 20 log files in the mobility services engine.
•![]() The maximum log file size in MB. The minimum log file size is 10 MB and the maximum is 50 MB.
The maximum log file size in MB. The minimum log file size is 10 MB and the maximum is 50 MB.
Step 9 ![]() In the MAC Address Based Logging page, do the following:
In the MAC Address Based Logging page, do the following:
•![]() Select the Enable check box to enable MAC address logging. By default, this option is disabled.
Select the Enable check box to enable MAC address logging. By default, this option is disabled.
•![]() Add one or more MAC addresses for which you want to enable logging. You can also remove MAC addresses that you have already added by selecting the MAC address from the list and clicking Remove.
Add one or more MAC addresses for which you want to enable logging. You can also remove MAC addresses that you have already added by selecting the MAC address from the list and clicking Remove.
For more information on MAC address-based logging, see "MAC Address-based Logging" section.
Step 10 ![]() Click Save to apply your changes.
Click Save to apply your changes.
MAC Address-based Logging
This feature allows you to create log files that are specific to an entity whose MAC address is specified. The log files are created in the locserver directory under the following path:
/opt/mse/logs/locserver
A maximum of 5 MAC addresses can be logged at a time. The log file format for MAC address aa:bb:cc:dd:ee:ff is:
macaddress-debug-aa-bb-cc-dd-ee-ff.log
You can create a maximum of two log files for a MAC address. The two log files may consist of one main and one back up or rollover log file.
The minimum size of a MAC log file is 10 MB. The maximum size allowed is 20 MB per MAC address. The MAC log files which are not updated for more than 24 hours are pruned.
Downloading Log Files
If you need to analyze mobility services engine log files, you can use the NCS to download them to your system. NCS downloads a .zip file containing the log files.
To download a .zip file containing the log files, follow these steps:
Step 1 ![]() Choose Services > Mobility Services Engines.
Choose Services > Mobility Services Engines.
Step 2 ![]() Click the name of the mobility services engine to view its status.
Click the name of the mobility services engine to view its status.
Step 3 ![]() From the left sidebar menu, choose Logs.
From the left sidebar menu, choose Logs.
Step 4 ![]() Click Download Logs.
Click Download Logs.
Step 5 ![]() Follow the instructions in the File Download dialog box to view the file or save the .zip file to your system.
Follow the instructions in the File Download dialog box to view the file or save the .zip file to your system.
Generating Reports
In the NCS, you can generate various kinds of reports. This section explains how to generate ContextAware reports using the NCS Report Launch Pad. By default, reports are stored on the NCS server.
Once you define the report criteria, you can save the reports for future diagnostic use and run them on either an ad hoc or scheduled basis.
You can define the following criteria for the reports:
•![]() Which mobility services engine or engines to monitor
Which mobility services engine or engines to monitor
•![]() How often the report is generated
How often the report is generated
•![]() How the data is graphed on the charts
How the data is graphed on the charts
•![]() Whether the report is e-mailed or exported to a file
Whether the report is e-mailed or exported to a file
This section contains the following topics:
•![]() Creating a Device Utilization Report
Creating a Device Utilization Report
•![]() Viewing Saved Utilization Reports
Viewing Saved Utilization Reports
•![]() Viewing Scheduled Utilization Runs
Viewing Scheduled Utilization Runs
Creating a Device Utilization Report
To create a device utilization report for the mobility services engine, follow these steps:
Step 1 ![]() Choose Reports > Report Launch Pad.
Choose Reports > Report Launch Pad.
Step 2 ![]() Choose Device > Utilization.
Choose Device > Utilization.
Step 3 ![]() Click New. The Utilization Report Details page appears.
Click New. The Utilization Report Details page appears.
Step 4 ![]() In the Reports Details page, enter the following Settings parameters:
In the Reports Details page, enter the following Settings parameters:
Note ![]() Certain parameters may or may not work depending on the report type.
Certain parameters may or may not work depending on the report type.
•![]() Report Title—If you plan to save this report, enter a report name.
Report Title—If you plan to save this report, enter a report name.
•![]() Report Type—By default, the report type is selected as MSE.
Report Type—By default, the report type is selected as MSE.
•![]() Report By—Choose the appropriate Report By category from the drop-down list. The categories differ for each report. See specific report sections for Report By categories for each report.
Report By—Choose the appropriate Report By category from the drop-down list. The categories differ for each report. See specific report sections for Report By categories for each report.
•![]() Report Criteria—The parameter allows you to sort your results depending on the previous Report By selection made. Click Edit to open the Filter Criteria page.
Report Criteria—The parameter allows you to sort your results depending on the previous Report By selection made. Click Edit to open the Filter Criteria page.
•![]() Connection Protocol—Choose one of these protocols: All Clients, All Wired (802.3), All Wireless (802.11), 802.11a/n, 802.11b/g/n, 802.11a, 802.11b, 802.11g, 802.11n (5-GHz), or 802.11n (2.4-GHz).
Connection Protocol—Choose one of these protocols: All Clients, All Wired (802.3), All Wireless (802.11), 802.11a/n, 802.11b/g/n, 802.11a, 802.11b, 802.11g, 802.11n (5-GHz), or 802.11n (2.4-GHz).
•![]() SSID—All SSIDs is the default value.
SSID—All SSIDs is the default value.
•![]() Reporting Period—You can define the report to collect data hourly, weekly, or at a specific date and time. The selected reporting period type is displayed on the x-axis.
Reporting Period—You can define the report to collect data hourly, weekly, or at a specific date and time. The selected reporting period type is displayed on the x-axis.
Note ![]() The reporting period uses a 24-hour rather than a 12-hour clock. For example, choose hour 13 for 1:00 p.m.
The reporting period uses a 24-hour rather than a 12-hour clock. For example, choose hour 13 for 1:00 p.m.
Step 5 ![]() In the Schedule group box, select the Enable Schedule check box.
In the Schedule group box, select the Enable Schedule check box.
Step 6 ![]() Choose the report format (CSV or PDF) from the Export Report drop-down list.
Choose the report format (CSV or PDF) from the Export Report drop-down list.
Step 7 ![]() Select either File or Email as the destination of the report.
Select either File or Email as the destination of the report.
•![]() If you select the File option, a destination path must first be defined in the Administration > Settings > Report page. Enter the destination path for the files in the Repository Path text box.
If you select the File option, a destination path must first be defined in the Administration > Settings > Report page. Enter the destination path for the files in the Repository Path text box.
•![]() If you select the Email option, an SMTP mail server must be defined prior to entry of target e-mail address. Choose Administrator > Settings > Mail Server Configuration to enter the appropriate information.
If you select the Email option, an SMTP mail server must be defined prior to entry of target e-mail address. Choose Administrator > Settings > Mail Server Configuration to enter the appropriate information.
Step 8 ![]() Enter a start date (MM:DD:YYYY), or click the calendar icon to select a date.
Enter a start date (MM:DD:YYYY), or click the calendar icon to select a date.
Step 9 ![]() Specify a start time using the hour and minute drop-down list boxes.
Specify a start time using the hour and minute drop-down list boxes.
Step 10 ![]() Select the Recurrence radio button to determine how often you want to run the report. The possible values are:
Select the Recurrence radio button to determine how often you want to run the report. The possible values are:
•![]() No Recurrence
No Recurrence
•![]() Hourly
Hourly
•![]() Daily
Daily
•![]() Weekly
Weekly
•![]() Monthly
Monthly
Note ![]() The days of the week appear on the page only when the weekly option is chosen.
The days of the week appear on the page only when the weekly option is chosen.
Step 11 ![]() When finished with Step 1 to Step 10, do one of the following:
When finished with Step 1 to Step 10, do one of the following:
•![]() Click Save to save edits. The report is run at the designated time and the results are either e-mailed or saved to a designated file as defined in the Schedule group box.
Click Save to save edits. The report is run at the designated time and the results are either e-mailed or saved to a designated file as defined in the Schedule group box.
•![]() Click Save and Run to save the changes and run the report now. The report runs regardless of any pending, scheduled run of that report. Results appear at the bottom of the page. The report also runs at the designated time and the results are either e-mailed or saved to a designated file as defined in the Schedule group box.
Click Save and Run to save the changes and run the report now. The report runs regardless of any pending, scheduled run of that report. Results appear at the bottom of the page. The report also runs at the designated time and the results are either e-mailed or saved to a designated file as defined in the Schedule group box.
–![]() In the results page, click Cancel to cancel the defined report.
In the results page, click Cancel to cancel the defined report.
•![]() Click Run Now if you want to run the report immediately and review the results in the NCS page. The report runs regardless of any pending, scheduled run of that report. Results appear at the bottom of the page. Click Save if you want to save the report criteria you entered.
Click Run Now if you want to run the report immediately and review the results in the NCS page. The report runs regardless of any pending, scheduled run of that report. Results appear at the bottom of the page. Click Save if you want to save the report criteria you entered.
Note ![]() You can also click Run Now to check the defined report criteria before saving it or to run reports as necessary.
You can also click Run Now to check the defined report criteria before saving it or to run reports as necessary.
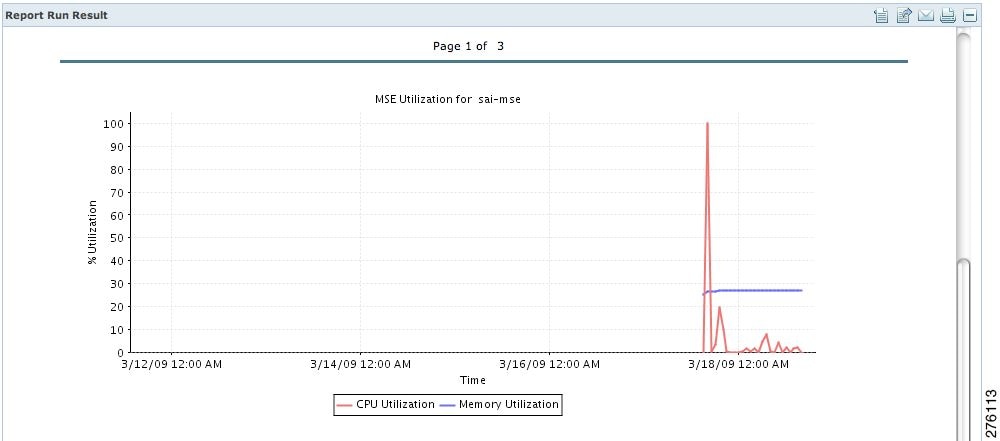
The results appear at the bottom of the page (see Figure 9-3).
Note ![]() Only the CPU and memory utilization reports are shown in the following example (see Figure 9-3).
Only the CPU and memory utilization reports are shown in the following example (see Figure 9-3).
Figure 9-3 Devise > MSE Utilization > Results
Step 12 ![]() If you selected the Save or Save and Run option, choose either Reports > Saved Reports (or Reports > Scheduled Runs if the report has not yet run and is scheduled to run). The Utilization Reports Summary page appears.
If you selected the Save or Save and Run option, choose either Reports > Saved Reports (or Reports > Scheduled Runs if the report has not yet run and is scheduled to run). The Utilization Reports Summary page appears.
If the report is scheduled, it is shown as enabled and the next scheduled run date is noted.
If the report has run and is not scheduled to run again, it is shown as expired.
If the report has run and is scheduled to run again, it is shown as disabled.
Step 13 ![]() To enable, disable, or delete a report, select the check box next to the report title and click the appropriate option.
To enable, disable, or delete a report, select the check box next to the report title and click the appropriate option.
Viewing Saved Utilization Reports
To download a saved report, follow these steps:
Step 1 ![]() Choose Reports > Saved Reports.
Choose Reports > Saved Reports.
Step 2 ![]() Click the Download icon for your report. It is downloaded and saved in the defined directory or e-mailed.
Click the Download icon for your report. It is downloaded and saved in the defined directory or e-mailed.
Viewing Scheduled Utilization Runs
To review status for a scheduled report, follow these steps:
Step 1 ![]() Choose Reports > Scheduled Runs.
Choose Reports > Scheduled Runs.
Step 2 ![]() Click the History icon to see the date of the last report run.
Click the History icon to see the date of the last report run.
Step 3 ![]() Click the Download icon for your report. It is downloaded and saved in the defined directory or e-mailed.
Click the Download icon for your report. It is downloaded and saved in the defined directory or e-mailed.
Security Reports and Alarms for wIPS
You can view, modify, or create a security report or alarm for wIPS.
Note ![]() Security reports do not show the status of autonomous access points.
Security reports do not show the status of autonomous access points.
The choices are as follows:
•![]() Adaptive wIPS Alarms—Alarms reported for wIPS on monitor mode access points.
Adaptive wIPS Alarms—Alarms reported for wIPS on monitor mode access points.
•![]() Adaptive wIPS Top 10 AP—Lists the last 10 events reported for monitor access points.
Adaptive wIPS Top 10 AP—Lists the last 10 events reported for monitor access points.
•![]() Adhoc Rogue Event—Shows all ad hoc events that the NCS has received in the selected timeframe.
Adhoc Rogue Event—Shows all ad hoc events that the NCS has received in the selected timeframe.
•![]() Adhoc Rogues—Shows all ad hocs that have been updated in the selected timeframe.
Adhoc Rogues—Shows all ad hocs that have been updated in the selected timeframe.
•![]() New Rogue APs—Shows in tabular form, all rogues detected in a selected timeframe. It provides which new rogues were detected within a selected time. The created time indicates the time at which the rogue was first detected.
New Rogue APs—Shows in tabular form, all rogues detected in a selected timeframe. It provides which new rogues were detected within a selected time. The created time indicates the time at which the rogue was first detected.
•![]() New Rogue AP Count—Shows in graphical form, all rogues detected in a selected timeframe.
New Rogue AP Count—Shows in graphical form, all rogues detected in a selected timeframe.
•![]() Rogue APs—Shows all rogues that are active in your network and have been updated in the selected timeframe. The NCS receives updated events for rogues that are detected.
Rogue APs—Shows all rogues that are active in your network and have been updated in the selected timeframe. The NCS receives updated events for rogues that are detected.
•![]() Rogue APs Event—Shows all the events received by the NCS. The controller sends updates of detected rogues if any of the attributes change or new rogues are detected.
Rogue APs Event—Shows all the events received by the NCS. The controller sends updates of detected rogues if any of the attributes change or new rogues are detected.
Note ![]() This report was formally called the Rogue Detected by AP.
This report was formally called the Rogue Detected by AP.
•![]() Security Summary—Shows the number of association failures, rogues access points, ad hocs, and access point connections or disconnections over one month.
Security Summary—Shows the number of association failures, rogues access points, ad hocs, and access point connections or disconnections over one month.
•![]() Click Save and Run to save the changes and run the report now. The report runs regardless of any scheduled time associated with the report and is viewable on the Results tab. Additionally, the report is run at the designated time and the results are either e-mailed or saved to a designated file as defined on the Schedule tab.
Click Save and Run to save the changes and run the report now. The report runs regardless of any scheduled time associated with the report and is viewable on the Results tab. Additionally, the report is run at the designated time and the results are either e-mailed or saved to a designated file as defined on the Schedule tab.
–![]() In the results page, you can cancel or delete the report.
In the results page, you can cancel or delete the report.
This section contains the following topics:
•![]() Creating a New wIPS Security or Alarms Report
Creating a New wIPS Security or Alarms Report
•![]() Viewing Scheduled wIPS Report Runs
Viewing Scheduled wIPS Report Runs
Creating a New wIPS Security or Alarms Report
Security reports provide a number of details on access points and rogue access points for wIPS.
To create a new security report, follow these steps:
Note ![]() Some of these steps or options are not required for every report.
Some of these steps or options are not required for every report.
Step 1 ![]() Choose Reports > Report Launch Pad. The Report Launch Pad page appears.
Choose Reports > Report Launch Pad. The Report Launch Pad page appears.
Step 2 ![]() Choose Security and click one of the report types in the left pane (such as Adaptive wIPS Top 10 Report Details).
Choose Security and click one of the report types in the left pane (such as Adaptive wIPS Top 10 Report Details).
Step 3 ![]() Click New. The New report page appears.
Click New. The New report page appears.
Step 4 ![]() In the Settings pane, enter a report title.
In the Settings pane, enter a report title.
Step 5 ![]() The Report By is, by default, MSE with Adaptive wIPS Service.
The Report By is, by default, MSE with Adaptive wIPS Service.
Step 6 ![]() The Report Criteria is always either a specific mobility services engine or All MSEs with Adaptive wIPS Service.
The Report Criteria is always either a specific mobility services engine or All MSEs with Adaptive wIPS Service.
Step 7 ![]() Click Edit to add or modify the Report Criteria. The Filter Criteria dialog box appears.
Click Edit to add or modify the Report Criteria. The Filter Criteria dialog box appears.
Step 8 ![]() Enter the reporting period. You can define the report to collect data hourly, weekly, or at a specific date and time. The selected reporting period type is displayed on the x-axis.
Enter the reporting period. You can define the report to collect data hourly, weekly, or at a specific date and time. The selected reporting period type is displayed on the x-axis.
Note ![]() The reporting period uses a 24-hour rather than a 12-hour clock. For example, choose hour 13 for 1:00 p.m.
The reporting period uses a 24-hour rather than a 12-hour clock. For example, choose hour 13 for 1:00 p.m.
Step 9 ![]() In the Schedule pane, select the Enable Schedule check box.
In the Schedule pane, select the Enable Schedule check box.
Step 10 ![]() Choose the report format (CSV or PDF) from the Export Report drop-down list.
Choose the report format (CSV or PDF) from the Export Report drop-down list.
Step 11 ![]() Select either File or Email as the destination of the report.
Select either File or Email as the destination of the report.
–![]() If you select the File option, a destination path must first be defined in the Administration > Settings > Report page. Enter the destination path for the files in the Repository Path text box.
If you select the File option, a destination path must first be defined in the Administration > Settings > Report page. Enter the destination path for the files in the Repository Path text box.
–![]() If you select the Email option, an SMTP mail server must be defined prior to entry of target e-mail address. Choose Administrator > Settings > Mail Server Configuration to enter the appropriate information.
If you select the Email option, an SMTP mail server must be defined prior to entry of target e-mail address. Choose Administrator > Settings > Mail Server Configuration to enter the appropriate information.
Step 12 ![]() Enter a start date (MM:DD:YYYY), or click the calendar icon to select a date.
Enter a start date (MM:DD:YYYY), or click the calendar icon to select a date.
Step 13 ![]() Choose a start time using the hour and minute drop-down lists.
Choose a start time using the hour and minute drop-down lists.
Step 14 ![]() Select any one of the Recurrence options to determine how often the report is to be run.
Select any one of the Recurrence options to determine how often the report is to be run.
Note ![]() The days of the week check boxes appear when you select Weekly radio button.
The days of the week check boxes appear when you select Weekly radio button.
You can also use the Customize Report option to customize the report. Click Customize and provide the required information to generate the report.
Step 15 ![]() When you have completed Step 1 to Step 14, do one of the following:
When you have completed Step 1 to Step 14, do one of the following:
•![]() Click Save to save edits. The report is run at the designated time and the results are either e-mailed or saved to a designated file as defined in the Schedule pane.
Click Save to save edits. The report is run at the designated time and the results are either e-mailed or saved to a designated file as defined in the Schedule pane.
•![]() Click Save and Run to save the changes and run the report now. The report runs regardless of any pending, scheduled run of that report. Results appear the bottom of the page. The report also runs at the designated time and the results are either e-mailed or saved to a designated file as defined in the Schedule pane.
Click Save and Run to save the changes and run the report now. The report runs regardless of any pending, scheduled run of that report. Results appear the bottom of the page. The report also runs at the designated time and the results are either e-mailed or saved to a designated file as defined in the Schedule pane.
–![]() In the results page, click Cancel to cancel the defined report.
In the results page, click Cancel to cancel the defined report.
•![]() Click Run Now if you want to run the report immediately and review the results in the NCS page. The report runs regardless of any pending, scheduled run of that report. Results appear at the bottom of the page. Click Save if you want to save the report criteria you entered.
Click Run Now if you want to run the report immediately and review the results in the NCS page. The report runs regardless of any pending, scheduled run of that report. Results appear at the bottom of the page. Click Save if you want to save the report criteria you entered.
Note ![]() You can click Run Now to check the defined report criteria before saving it or to run reports as necessary.
You can click Run Now to check the defined report criteria before saving it or to run reports as necessary.
The results appear at the bottom of the page.
Step 16 ![]() Repeat Step 2 to Step 15 for each wIPS report you want to create.
Repeat Step 2 to Step 15 for each wIPS report you want to create.
Viewing a Saved wIPS Report
To download a saved report, follow these steps:
Step 1 ![]() Choose Reports > Saved Reports.
Choose Reports > Saved Reports.
Step 2 ![]() Click the History icon to see the date of the last report tun.
Click the History icon to see the date of the last report tun.
Step 3 ![]() Click the Download icon for your request. It is downloaded and saved in the defined directory or e-mailed.
Click the Download icon for your request. It is downloaded and saved in the defined directory or e-mailed.
Viewing Scheduled wIPS Report Runs
To review status for a scheduled report, follow these steps:
Step 1 ![]() Choose Reports > Scheduled Runs.
Choose Reports > Scheduled Runs.
Step 2 ![]() Click the History icon to see the date of the last report run.
Click the History icon to see the date of the last report run.
Step 3 ![]() Click the Download icon for your report. It is downloaded and saved in the defined directory or e-mailed.
Click the Download icon for your report. It is downloaded and saved in the defined directory or e-mailed.
•![]()
Note ![]() The clients will only show one IP address when you hover your mouse over the client to see the information, even though there might be multiple IP addresses associated with this client. The details page will show all the IP addresses. Also the clients displayed can be filtered using any of the multiple IP addresses that a client can have (full or partial). the IP address displayed is the best matched string searched.
The clients will only show one IP address when you hover your mouse over the client to see the information, even though there might be multiple IP addresses associated with this client. The details page will show all the IP addresses. Also the clients displayed can be filtered using any of the multiple IP addresses that a client can have (full or partial). the IP address displayed is the best matched string searched.
Client Support on the MSE
You can use the NCS Advanced Search feature to narrow the client list based on specific categories and filters. See the "Using the Search Feature" section for more information.You can also filter the current list using the Show drop-down list. See the " Filtering Client and Users" section for more information.
This section contains the following topics:
•![]() Searching a Wireless Client from the NCS on the MSE by IPv6 Address
Searching a Wireless Client from the NCS on the MSE by IPv6 Address
•![]() Viewing the Clients Detected by the MSE
Viewing the Clients Detected by the MSE
Searching a Wireless Client from the NCS on the MSE by IPv6 Address
Note ![]() Only wireless clients have IPv6 addresses in this release.
Only wireless clients have IPv6 addresses in this release.
To search for an MSE-located client using the NCS Advanced Search feature, follow these steps:
Step 1 ![]() Click Advanced Search located in the top right corner of the NCS UI.
Click Advanced Search located in the top right corner of the NCS UI.
Step 2 ![]() Choose Clients as the search category from the Search Category drop-down list.
Choose Clients as the search category from the Search Category drop-down list.
Step 3 ![]() From the Media Type drop-down list, choose Wireless Clients.
From the Media Type drop-down list, choose Wireless Clients.
Note ![]() The Wireless Type drop-down list appears only when you choose Wireless Clients as the media type.
The Wireless Type drop-down list appears only when you choose Wireless Clients as the media type.
Step 4 ![]() From the Wireless Type drop-down list, choose any of the following types: All, Lightweight, or Autonomous Clients.
From the Wireless Type drop-down list, choose any of the following types: All, Lightweight, or Autonomous Clients.
Step 5 ![]() From the Search By drop-down list, choose IP Address.
From the Search By drop-down list, choose IP Address.
Note ![]() Searching a client by IP address can contain either a full or partial IP address. Each client can have up to 16 IPv6 addresses and 4 IPv4 addresses.
Searching a client by IP address can contain either a full or partial IP address. Each client can have up to 16 IPv6 addresses and 4 IPv4 addresses.
Step 6 ![]() From the Clients Detected By drop-down list, choose clients detected by MSE.
From the Clients Detected By drop-down list, choose clients detected by MSE.
This shows clients located by Context-Aware Service in the MSE by directly communicating with the controllers.
Step 7 ![]() From the Last detected within drop-down list, choose the time within which the client was detected.
From the Last detected within drop-down list, choose the time within which the client was detected.
Step 8 ![]() Enter the client IP address in the Client IP Address text box. You can enter wither a partial or full IPv6 address.
Enter the client IP address in the Client IP Address text box. You can enter wither a partial or full IPv6 address.
Note ![]() If you are searching for the client from NCS on the MSE by IPV4 address, enter the IPV4 address in the Client IP address text box.
If you are searching for the client from NCS on the MSE by IPV4 address, enter the IPV4 address in the Client IP address text box.
Step 9 ![]() From the Client States drop-down list, choose the client states. The possible values for wireless clients are All States, Idle, Authenticated, Associated, Probing, or Excused. The possible values for wired clients are All States, Authenticated, and Associated.
From the Client States drop-down list, choose the client states. The possible values for wireless clients are All States, Idle, Authenticated, Associated, Probing, or Excused. The possible values for wired clients are All States, Authenticated, and Associated.
Step 10 ![]() From the Posture Status drop-down list, choose the posture status to know if the devices are clean or not. The possible values are All, unknown, Passed, and Failed.
From the Posture Status drop-down list, choose the posture status to know if the devices are clean or not. The possible values are All, unknown, Passed, and Failed.
Step 11 ![]() Select the CCX Compatible check box to search for clients that are compatible with Cisco Client Extensions. The possible values are All Versions, V1, V2, V3, V4, V5, and V6.
Select the CCX Compatible check box to search for clients that are compatible with Cisco Client Extensions. The possible values are All Versions, V1, V2, V3, V4, V5, and V6.
Step 12 ![]() Select the E2E Compatible check box to search for clients that are End to End compatible. The possible values are All Versions, V1, and V2.
Select the E2E Compatible check box to search for clients that are End to End compatible. The possible values are All Versions, V1, and V2.
Step 13 ![]() Select the NAC State check box to search for clients identified by a certain Network Admission Control (NAC) state. The possible values are Quarantine, Access, Invalid, and Not Applicable.
Select the NAC State check box to search for clients identified by a certain Network Admission Control (NAC) state. The possible values are Quarantine, Access, Invalid, and Not Applicable.
Step 14 ![]() Select the Include Disassociated check box to include clients that are no longer on the network but for which the NCS has historical records.
Select the Include Disassociated check box to include clients that are no longer on the network but for which the NCS has historical records.
Step 15 ![]() From the Items per page drop-down list, choose the number of records to be displayed in the search results page.
From the Items per page drop-down list, choose the number of records to be displayed in the search results page.
Step 16 ![]() Select the Save Search check box to save the selected search option.
Select the Save Search check box to save the selected search option.
Step 17 ![]() Click Go.
Click Go.
The Clients and Users page appears with all the clients detected by the MSE.
Viewing the Clients Detected by the MSE
To view all the clients detected by the MSE, follow these steps:
Step 1 ![]() Choose Monitor > Clients and Users to view both wired and wireless clients information.
Choose Monitor > Clients and Users to view both wired and wireless clients information.
The Client and Users page appears.
The Clients and Users table shows a few column by default. If you want to display the additional columns that are available, click  , and then click Columns. The available columns appear. Select the columns that you want to show in the Clients and Users table. When you click anywhere in a row, the row is selected and the client details are shown.
Step 2 ![]() Filter the current list to choose all the clients that are detected by the MSE by choosing Clients detected by MSE from the Show drop-down list.
Filter the current list to choose all the clients that are detected by the MSE by choosing Clients detected by MSE from the Show drop-down list.
All the clients detected by the MSE including wired and wireless appear.
The following different parameters are available in the Clients Detected by MSE table:
•![]() MAC Address—Client MAC address.
MAC Address—Client MAC address.
•![]() IP Address—Client IP address.
IP Address—Client IP address.
The IP address that appears in the IP Address column is determined by a predefined priority order. The first IP address available in the following order appears in the IP address text box:
–![]() IPv4 address
IPv4 address
Note ![]() Only wireless clients have IPv6 addresses in this release. Each client can have up to 16 IPv6 addresses and 4 IPv4 addresses.
Only wireless clients have IPv6 addresses in this release. Each client can have up to 16 IPv6 addresses and 4 IPv4 addresses.
–![]() IPv6 global unique address. If there are multiple addresses of this type, most recent IPv6 address that the client received is shown, because a user might have two Global IPv6 addresses but one might have been from an older Router Advertisement that is being aged out.
IPv6 global unique address. If there are multiple addresses of this type, most recent IPv6 address that the client received is shown, because a user might have two Global IPv6 addresses but one might have been from an older Router Advertisement that is being aged out.
–![]() IPv6 local unique address, if there are multiple then the most recent IPV6 local unique address is used by the client.
IPv6 local unique address, if there are multiple then the most recent IPV6 local unique address is used by the client.
–![]() IPv6 link local address. For an IPv6 address of the client which is self-assigned and used for communication before any other IPV6 address is assigned.
IPv6 link local address. For an IPv6 address of the client which is self-assigned and used for communication before any other IPV6 address is assigned.
The following are the different IPv6 address types:
–![]() Link-local Unicast—The link-local addresses are designed to be used for addressing on a single link for purposes such as auto-address configuration, neighbor discovery, or when no routers are present.
Link-local Unicast—The link-local addresses are designed to be used for addressing on a single link for purposes such as auto-address configuration, neighbor discovery, or when no routers are present.
–![]() Site-local Unicast—The site-local addresses are designed to be used for addressing inside of a site without the need for a global prefix.
Site-local Unicast—The site-local addresses are designed to be used for addressing inside of a site without the need for a global prefix.
–![]() Aggregatable Global Unicast—The aggregatable global unicast address uniquely identifies the client in global network and equivalent to public IPv4 address. A client can have multiple aggregatable global unicast addresses.
Aggregatable Global Unicast—The aggregatable global unicast address uniquely identifies the client in global network and equivalent to public IPv4 address. A client can have multiple aggregatable global unicast addresses.
•![]() IP Type—The IP address type of the client. The possible options are IPv4, IPv6, or Dual-stack that signifies a client with both a IPV4 and IPV6 addresses.
IP Type—The IP address type of the client. The possible options are IPv4, IPv6, or Dual-stack that signifies a client with both a IPV4 and IPV6 addresses.
–![]() Global Unique
Global Unique
–![]() Unique Local
Unique Local
–![]() Link Local
Link Local
•![]() User Name—Username based on 802.1x authentication. Unknown is displayed for client connected without a username.
User Name—Username based on 802.1x authentication. Unknown is displayed for client connected without a username.
•![]() Type—Indicates the client type.
Type—Indicates the client type.
–![]()
![]() Indicates a lightweight client
Indicates a lightweight client
–![]()
![]() Indicates a wired client
Indicates a wired client
–![]()
 Indicates an autonomous client
•![]() Vendor—Device vendor derived from OUI.
Vendor—Device vendor derived from OUI.
•![]() Device Name—Network authentication device name. For example, WLC and switch.
Device Name—Network authentication device name. For example, WLC and switch.
•![]() Location—Map location of the connected device.
Location—Map location of the connected device.
•![]() VLAN—Indicates the access VLAN ID for this client.
VLAN—Indicates the access VLAN ID for this client.
•![]() Status—Current client status.
Status—Current client status.
–![]() Idle—Normal operation; no rejection of client association requests.
Idle—Normal operation; no rejection of client association requests.
–![]() Auth Pending—Completing a AAA transaction.
Auth Pending—Completing a AAA transaction.
–![]() Authenticated—802.11 authenticated complete.
Authenticated—802.11 authenticated complete.
–![]() Associated—802.11 association complete. This is also used by wired clients to represent that a client is currently connected to the network.
Associated—802.11 association complete. This is also used by wired clients to represent that a client is currently connected to the network.
–![]() Disassociated—802.11 disassociation complete. This is also used by wired clients to represent that a client is currently not on the network.
Disassociated—802.11 disassociation complete. This is also used by wired clients to represent that a client is currently not on the network.
–![]() To Be Deleted—The client is deleted after disassociation.
To Be Deleted—The client is deleted after disassociation.
–![]() Excluded—Automatically disabled by the system due to perceived security threat.
Excluded—Automatically disabled by the system due to perceived security threat.
•![]() Interface—Controller interface (wireless) or switch interface (wired) that the client is connected to.
Interface—Controller interface (wireless) or switch interface (wired) that the client is connected to.
•![]() Protocol
Protocol
–![]() 802.11—Wireless
802.11—Wireless
–![]() 802.3—Wired
802.3—Wired
•![]() Association Time—Last association start time (for wireless client). For a wired client, this is the time when a client is connected to a switch port. This is blank for a client which is associated but has problems being on the network.
Association Time—Last association start time (for wireless client). For a wired client, this is the time when a client is connected to a switch port. This is blank for a client which is associated but has problems being on the network.
•![]() CCX—Lightweight wireless only.
CCX—Lightweight wireless only.
Step 3 ![]() Select the radio button next to MAC Address in the Client and User page to view the associated client information. The following are the different client parameters that appear.
Select the radio button next to MAC Address in the Client and User page to view the associated client information. The following are the different client parameters that appear.
•![]() Client attributes
Client attributes
•![]() Client IPV6 Addresses
Client IPV6 Addresses
•![]() Client Statistics
Client Statistics
Note ![]() Client Statistics shows the statistics information after the client details are shown.
Client Statistics shows the statistics information after the client details are shown.
•![]() Client Association History
Client Association History
•![]() Client Event Information
Client Event Information
•![]() Client Location Information
Client Location Information
•![]() Wired Location History
Wired Location History
•![]() Client CCX Information
Client CCX Information
When you select a client from the Clients and Users list, the following client details are displayed. Clients are identified using the MAC address.
•![]() General—Lists the following information:
General—Lists the following information:
–![]() User Name
User Name
–![]() IP Address
IP Address
–![]() MAC address
MAC address
–![]() Vendor
Vendor
–![]() Endpoint Type
Endpoint Type
–![]() Client Type
Client Type
–![]() Media Type
Media Type
–![]() Mobility Role
Mobility Role
–![]() Hostname
Hostname
–![]() E2E
E2E
–![]() Power Save
Power Save
–![]() CCX
CCX
–![]() Foundation Service
Foundation Service
–![]() Management Service
Management Service
–![]() Voice Service
Voice Service
–![]() Location Service
Location Service
Note ![]() Click the
Click the  icon next to the username to access the correlated users of a user.
•![]() Session—Lists the following client session information:
Session—Lists the following client session information:
–![]() Controller Name
Controller Name
–![]() AP Name
AP Name
–![]() AP IP Address
AP IP Address
–![]() AP Type
AP Type
–![]() AP Base Radio MAC
AP Base Radio MAC
–![]() Anchor Address
Anchor Address
–![]() 802.11 State
802.11 State
–![]() Association ID
Association ID
–![]() Port
Port
–![]() Interface
Interface
–![]() SSID
SSID
–![]() Profile Name
Profile Name
–![]() Protocol
Protocol
–![]() VLAN ID
VLAN ID
–![]() AP Mode
AP Mode
•![]() Security (wireless and Identity wired clients only)—Lists the following security information:
Security (wireless and Identity wired clients only)—Lists the following security information:
–![]() Security Policy Type
Security Policy Type
–![]() EAP Type
EAP Type
–![]() On Network
On Network
–![]() 802.11 Authentication
802.11 Authentication
–![]() Encryption Cipher
Encryption Cipher
–![]() SNMP NAC State
SNMP NAC State
–![]() RADIUS NAC State
RADIUS NAC State
–![]() AAA Override ACL Name
AAA Override ACL Name
–![]() AAA Override ACL Applied Status
AAA Override ACL Applied Status
–![]() Redirect URL
Redirect URL
–![]() ACL Name
ACL Name
–![]() ACL Applied Status
ACL Applied Status
–![]() FlexConnect Local Authentication
FlexConnect Local Authentication
–![]() Policy Manager State
Policy Manager State
–![]() Authentication ISE
Authentication ISE
–![]() Authorization Profile Name
Authorization Profile Name
–![]() Posture Status
Posture Status
–![]() TrustSec Security Group
TrustSec Security Group
–![]() Windows AD Domain
Windows AD Domain
Note ![]() The identity clients are clients whose authentication type is 802.1x, MAC Auth Bypass or Web Auth. For non-identity clients, the authentication type is N/A.
The identity clients are clients whose authentication type is 802.1x, MAC Auth Bypass or Web Auth. For non-identity clients, the authentication type is N/A.
Note ![]() The data that appears under the client attributes differs based on identity and non-identity clients. For identity clients, you can see the security information such as Authentication status, Audit Session ID, and so on.
The data that appears under the client attributes differs based on identity and non-identity clients. For identity clients, you can see the security information such as Authentication status, Audit Session ID, and so on.
•![]() Statistics (wireless only)
Statistics (wireless only)
•![]() Traffic—Shows the client traffic information.
Traffic—Shows the client traffic information.
•![]() For wireless clients, client traffic information comes from the controller. For wired clients, the client traffic information comes from the ISE, and you must enable accounting information and other necessary functions on the switches.
For wireless clients, client traffic information comes from the controller. For wired clients, the client traffic information comes from the ISE, and you must enable accounting information and other necessary functions on the switches.
The Statistics group box contains the following information for the selected client:
•![]() Client AP Association History.
Client AP Association History.
•![]() Client RSSI History (dBm)—History of RSSI (Received Signal Strength Indicator) as detected by the access point with which the client is associated.
Client RSSI History (dBm)—History of RSSI (Received Signal Strength Indicator) as detected by the access point with which the client is associated.
•![]() Client SNR History—History of SNR (signal-to-noise ratio of the client RF session) as detected by the access point with which the client is associated.
Client SNR History—History of SNR (signal-to-noise ratio of the client RF session) as detected by the access point with which the client is associated.
•![]() Bytes Sent and Received (Kbps)—Bytes sent and received with the associated access point.
Bytes Sent and Received (Kbps)—Bytes sent and received with the associated access point.
•![]() Packets Sent and Received (per sec)—Packets sent and received with the associated access point.
Packets Sent and Received (per sec)—Packets sent and received with the associated access point.
•![]() Client Data rate
Client Data rate
This information is presented in interactive graphs.
The Client IPv6 Address group box contains the following information for the selected client:
•![]() IP Address—Shows the client IPv6 address.
IP Address—Shows the client IPv6 address.
•![]() Scope—Contains 3 scope types: Global Unique, Local Unique, and Link Local.
Scope—Contains 3 scope types: Global Unique, Local Unique, and Link Local.
•![]() Address Type—Shows the address type.
Address Type—Shows the address type.
•![]() Discovery Time—Time when the IP was discovered.
Discovery Time—Time when the IP was discovered.
The association history dashlet shows information regarding the last ten association times for the selected client. This information helps in troubleshooting the client.
The Association History dashlet contains the following information:
•![]() Association Time
Association Time
•![]() Duration
Duration
•![]() User Name
User Name
•![]() IP Address
IP Address
•![]() IP Address Type
IP Address Type
•![]() AP Name
AP Name
•![]() Controller Name
Controller Name
•![]() SSID
SSID
The Events group box in the Client Details page displays all events for this client including the event type as well as the date and time of the event:
•![]() Event Type
Event Type
•![]() Event Time
Event Time
•![]() Description
Description
Click View Location History to view the location history details of wired and wireless clients.
The following location history information is displayed for a wired or wireless client:
•![]() Timestamp
Timestamp
•![]() State
State
•![]() Port Type
Port Type
•![]() Slot
Slot
•![]() Module
Module
•![]() Port
Port
•![]() User Name
User Name
•![]() IP Address
IP Address
•![]() Switch IP
Switch IP
•![]() Server Name
Server Name
•![]() Map Location Civic Location
Map Location Civic Location
Configuring Buildings
You can add buildings to the NCS database regardless of whether you have added campus maps to the database. This section describes how to add a building to a campus map or a standalone building (one that is not part of a campus) to the NCS database.
This section contains the following topics:
•![]() Adding a Building to a Campus Map
Adding a Building to a Campus Map
Adding a Building to a Campus Map
To add a building to a campus map in the NCS database, follow these steps:
Step 1 ![]() Choose Monitor > Site Maps to display the Maps page.
Choose Monitor > Site Maps to display the Maps page.
Step 2 ![]() Click the desired campus. The Site Maps > Campus Name page appears.
Click the desired campus. The Site Maps > Campus Name page appears.
Step 3 ![]() From the Select a command drop-down list, choose New Building and click Go.
From the Select a command drop-down list, choose New Building and click Go.
Step 4 ![]() In the Campus Name > New Building page, follow these steps to create a virtual building in which to organize related floor plan maps:
In the Campus Name > New Building page, follow these steps to create a virtual building in which to organize related floor plan maps:
a. ![]() Enter the building name.
Enter the building name.
b. ![]() Enter the building contact name.
Enter the building contact name.
c. ![]() Enter the number of floors and basements.
Enter the number of floors and basements.
d. ![]() Enter the horizontal position (distance from the corner of the building rectangle to the left edge of the campus map) and the vertical position (distance from the corner of the building rectangle to the top edge of the campus map) in feet.
Enter the horizontal position (distance from the corner of the building rectangle to the left edge of the campus map) and the vertical position (distance from the corner of the building rectangle to the top edge of the campus map) in feet.
Note ![]() To change the unit of measurement (feet or meters), choose Monitor > Site Maps and choose Properties from the Select a command drop-down list.
To change the unit of measurement (feet or meters), choose Monitor > Site Maps and choose Properties from the Select a command drop-down list.
e. ![]() Enter an approximate building horizontal span and vertical span (width and depth on the map) in feet.
Enter an approximate building horizontal span and vertical span (width and depth on the map) in feet.
Note ![]() The horizontal and vertical span should be larger than or the same size as any floors that you might add later.
The horizontal and vertical span should be larger than or the same size as any floors that you might add later.

Tip ![]() You can also use Ctrl-click to resize the bounding area in the upper-left corner of the campus map. As you change the size of the bounding area, the Horizontal Span and Vertical Span parameters of the building change to match your actions.
You can also use Ctrl-click to resize the bounding area in the upper-left corner of the campus map. As you change the size of the bounding area, the Horizontal Span and Vertical Span parameters of the building change to match your actions.
f. ![]() Click Place to put the building on the campus map. NCS creates a building rectangle scaled to the size of the campus map.
Click Place to put the building on the campus map. NCS creates a building rectangle scaled to the size of the campus map.
g. ![]() Click the building rectangle and drag it to the desired position on the campus map.
Click the building rectangle and drag it to the desired position on the campus map.
Note ![]() After adding a new building, you can move it from one campus to another without having to recreate it.
After adding a new building, you can move it from one campus to another without having to recreate it.
h. ![]() Click Save to save this building and its campus location to the database. NCS saves the building name in the building rectangle on the campus map.
Click Save to save this building and its campus location to the database. NCS saves the building name in the building rectangle on the campus map.
Note ![]() A hyperlink associated with the building takes you to the corresponding Map page.
A hyperlink associated with the building takes you to the corresponding Map page.
Step 5 ![]() (Optional) To assign location presence information for the new outdoor area, do the following:
(Optional) To assign location presence information for the new outdoor area, do the following:
a. ![]() Choose Edit Location Presence Info from the Select a command drop-down list. Click Go. The Location Presence page appears.
Choose Edit Location Presence Info from the Select a command drop-down list. Click Go. The Location Presence page appears.
Note ![]() By default, the Presence Info check box of the Override Child Element is selected. This option should remain selected if you want to propagate the campus location to all buildings and floors on that campus. When adding buildings to the campus map, you can import the campus location information. The campus address cannot be imported to a building if the check box is unselected.
By default, the Presence Info check box of the Override Child Element is selected. This option should remain selected if you want to propagate the campus location to all buildings and floors on that campus. When adding buildings to the campus map, you can import the campus location information. The campus address cannot be imported to a building if the check box is unselected.
This option should be unselected if you want to assign building-specific addresses to buildings on its campus rather than one campus address to all.
b. ![]() Click the Civic Address, or Advanced tab.
Click the Civic Address, or Advanced tab.
–![]() Civic Address identifies the campus by name, street, house number, house number suffix, city (address line2), state, postal code, and country.
Civic Address identifies the campus by name, street, house number, house number suffix, city (address line2), state, postal code, and country.
–![]() Advanced identifies the campus with expanded civic information such as neighborhood, city division, country, and postal community name.
Advanced identifies the campus with expanded civic information such as neighborhood, city division, country, and postal community name.
c. ![]() By default, the Override Child's Presence Information check box is selected. There is no need to alter this setting for standalone buildings.
By default, the Override Child's Presence Information check box is selected. There is no need to alter this setting for standalone buildings.
Step 6 ![]() Click Save.
Click Save.
Adding a Standalone Building
To add a standalone building to the NCS database, follow these steps:
Step 1 ![]() Choose Monitor > Site Maps to display the Maps page.
Choose Monitor > Site Maps to display the Maps page.
Step 2 ![]() From the Select a command drop-down list, choose New Building, and click Go.
From the Select a command drop-down list, choose New Building, and click Go.
Step 3 ![]() In the Maps > New Building page, follow these steps to create a virtual building in which to organize related floor plan maps:
In the Maps > New Building page, follow these steps to create a virtual building in which to organize related floor plan maps:
a. ![]() Enter the building name.
Enter the building name.
b. ![]() Enter the building contact name.
Enter the building contact name.
Note ![]() After adding a new building, you can move it from one campus to another without having to recreate it.
After adding a new building, you can move it from one campus to another without having to recreate it.
c. ![]() Enter the number of floors and basements.
Enter the number of floors and basements.
d. ![]() Enter an approximate building horizontal span and vertical span (width and depth on the map) in feet.
Enter an approximate building horizontal span and vertical span (width and depth on the map) in feet.
Note ![]() To change the unit of measurement (feet or meters), choose Monitor > Site Maps, and choose Properties from the Select a command drop-down list.
To change the unit of measurement (feet or meters), choose Monitor > Site Maps, and choose Properties from the Select a command drop-down list.
Note ![]() The horizontal and vertical span should be larger than or the same size as any floors that you might add later.
The horizontal and vertical span should be larger than or the same size as any floors that you might add later.
e. ![]() Click OK to save this building to the database.
Click OK to save this building to the database.
Step 4 ![]() (Optional) To assign location presence information for the new building, do the following:
(Optional) To assign location presence information for the new building, do the following:
a. ![]() Choose Location Presence from the Select a command drop-down list. Click Go. The Location Presence page appears.
Choose Location Presence from the Select a command drop-down list. Click Go. The Location Presence page appears.
b. ![]() Click the Civic, GPS Markers, or Advanced tab.
Click the Civic, GPS Markers, or Advanced tab.
–![]() Civic Address identifies the campus by name, street, house number, house number suffix, city (address line2), state, postal code, and country.
Civic Address identifies the campus by name, street, house number, house number suffix, city (address line2), state, postal code, and country.
–![]() GPS Markers identify the campus by longitude and latitude.
GPS Markers identify the campus by longitude and latitude.
–![]() Advanced identifies the campus with expanded civic information such as neighborhood, city division, county, and postal community name.
Advanced identifies the campus with expanded civic information such as neighborhood, city division, county, and postal community name.
Note ![]() Each selected parameter is inclusive of all of those above it. For example, if you select Advanced, it can also provide GPS and Civic location information upon client demand. The selected setting must match what is set on the location server level (Services > Mobility Services).
Each selected parameter is inclusive of all of those above it. For example, if you select Advanced, it can also provide GPS and Civic location information upon client demand. The selected setting must match what is set on the location server level (Services > Mobility Services).
Note ![]() If a client requests location information such as GPS Markers for a campus, building, floor, or outdoor area that is not configured for that parameter, an error message is returned.
If a client requests location information such as GPS Markers for a campus, building, floor, or outdoor area that is not configured for that parameter, an error message is returned.
c. ![]() By default, the Presence Info check box of the Override Child Element is selected. This option should remain selected if you want to propagate the campus location to all buildings and floors on that campus. When adding buildings to the campus map, you can import the location information. The campus address cannot be imported to a building if the check box is unselected. This option should be deselected if you want to assign building-specific addresses to buildings on its campus rather than one campus address to all.
By default, the Presence Info check box of the Override Child Element is selected. This option should remain selected if you want to propagate the campus location to all buildings and floors on that campus. When adding buildings to the campus map, you can import the location information. The campus address cannot be imported to a building if the check box is unselected. This option should be deselected if you want to assign building-specific addresses to buildings on its campus rather than one campus address to all.
Step 5 ![]() Click Save.
Click Save.
Note ![]() The standalone buildings are automatically placed in System Campus.
The standalone buildings are automatically placed in System Campus.
Viewing a Building
To view a current building map, follow these steps:
Step 1 ![]() Choose Monitor > Site Maps.
Choose Monitor > Site Maps.
Step 2 ![]() Click the name of the building map to open its details page. The Building View page provides a list of floor maps and map details for each floor.
Click the name of the building map to open its details page. The Building View page provides a list of floor maps and map details for each floor.
Note ![]() From the Building View page, you can click the Floor column heading to sort the list ascending or descending by floor.
From the Building View page, you can click the Floor column heading to sort the list ascending or descending by floor.
The map details include the following:
•![]() Floor area
Floor area
•![]() Floor index—Indicates the floor level. A negative number indicates a basement floor level.
Floor index—Indicates the floor level. A negative number indicates a basement floor level.
•![]() Contact
Contact
•![]() Status—Indicates the most serious level of alarm on an access point located on this map or one of its children.
Status—Indicates the most serious level of alarm on an access point located on this map or one of its children.
•![]() Number of total access points located on the map.
Number of total access points located on the map.
•![]() Number of 802.11a/n and 802.11b/g/n radios located on the map.
Number of 802.11a/n and 802.11b/g/n radios located on the map.
•![]() Number of out of service (OOS) radios.
Number of out of service (OOS) radios.
•![]() Number of clients—Click the number link to view the Monitor > Clients page. See the "Monitoring Clients and Users" section for more information.
Number of clients—Click the number link to view the Monitor > Clients page. See the "Monitoring Clients and Users" section for more information.
Step 3 ![]() The Select a command drop-down list provides the following options:
The Select a command drop-down list provides the following options:
•![]() New Floor Area—See the "Adding a Building to a Campus Map" section for more information.
New Floor Area—See the "Adding a Building to a Campus Map" section for more information.
•![]() Edit Building—See the "Editing a Building" section for more information.
Edit Building—See the "Editing a Building" section for more information.
•![]() Delete Building—See the "Deleting a Building" section for more information.
Delete Building—See the "Deleting a Building" section for more information.
Editing a Building
To edit a current building map, follow these steps:
Step 1 ![]() Choose Monitor > Site Maps.
Choose Monitor > Site Maps.
Step 2 ![]() Click the name of the building map to open its details page.
Click the name of the building map to open its details page.
Step 3 ![]() From the Select a command drop-down list, choose Edit Building.
From the Select a command drop-down list, choose Edit Building.
Step 4 ![]() Make any necessary changes to Building Name, Contact, Number of Floors, Number of Basements, and Dimensions (feet).
Make any necessary changes to Building Name, Contact, Number of Floors, Number of Basements, and Dimensions (feet).
Note ![]() To change the unit of measurement (feet or meters), choose Monitor > Site Maps, and choose Properties from the Select a command drop-down list.
To change the unit of measurement (feet or meters), choose Monitor > Site Maps, and choose Properties from the Select a command drop-down list.
Step 5 ![]() Click OK.
Click OK.
Deleting a Building
To delete a current building map, follow these steps:
Step 1 ![]() Choose Monitor > Site Maps.
Choose Monitor > Site Maps.
Step 2 ![]() Select the check box for the building that you want to delete.
Select the check box for the building that you want to delete.
Step 3 ![]() Click Delete at the bottom of the map list (or choose Delete Maps from the Select a command drop-down list, and click Go).
Click Delete at the bottom of the map list (or choose Delete Maps from the Select a command drop-down list, and click Go).
Step 4 ![]() Click OK to confirm the deletion.
Click OK to confirm the deletion.
Note ![]() Deleting a building also deletes all of its container maps. The access points from all deleted maps are moved to an Unassigned state.
Deleting a building also deletes all of its container maps. The access points from all deleted maps are moved to an Unassigned state.
Moving a Building
To move a building to a different campus, follow these steps:
Step 1 ![]() Choose Monitor > Site Maps.
Choose Monitor > Site Maps.
Step 2 ![]() Select the check box of the applicable building.
Select the check box of the applicable building.
Step 3 ![]() From the Select a command drop-down list, choose Move Buildings.
From the Select a command drop-down list, choose Move Buildings.
Step 4 ![]() Click Go.
Click Go.
Step 5 ![]() Choose the Target Campus from the drop-down list.
Choose the Target Campus from the drop-down list.
Step 6 ![]() Select the buildings that you want to move. Unselect any buildings that remain in their current location.
Select the buildings that you want to move. Unselect any buildings that remain in their current location.
Step 7 ![]() Click OK.
Click OK.
Monitoring Geo-Location
The MSE provides physical location of wired clients, wired end points, switches, controllers, and access points present in a wireless network deployment. Currently, MSE provides location information in geo-location format to the external entities through northbound and southbound entities.
To improve the accuracy of the geo-location information provided by MSE, this feature aims to transform the geometric location co-ordinates of a device to geo-location coordinates (latitude and longitude) and provides it to the external entities through northbound and southbound interfaces.
Note ![]() At least of 3 GPS markers are required for geo-location calculation. The maximum number of GPS markers that you can add is 20.
At least of 3 GPS markers are required for geo-location calculation. The maximum number of GPS markers that you can add is 20.
This section contains the following topics:
•![]() Adding a GPS Marker to a Floor Map
Adding a GPS Marker to a Floor Map
•![]() Deleting a GPS Marker Present on a Floor
Deleting a GPS Marker Present on a Floor
Adding a GPS Marker to a Floor Map
To add a GPS marker to a floor map, follow these steps:
Step 1 ![]() Choose Monitor > Site Maps to display the Maps page.
Choose Monitor > Site Maps to display the Maps page.
Step 2 ![]() Click the Campus Name > Building Name > Floor Name.
Click the Campus Name > Building Name > Floor Name.
Step 3 ![]() Click the Add/Edit GPS Markers Information menu option on the top left menu for the Add/Edit GPS page to appear..
Click the Add/Edit GPS Markers Information menu option on the top left menu for the Add/Edit GPS page to appear..
A GPS Marker icon appears on the top left corner of the map (X=0 Y=0).
Step 4 ![]() You can drag the GPS Marker icon and place it in the desired location on the map or enter the X and Y position values in the GPS Marker Details table on the left sidebar menu to move the marker to the desired position.
You can drag the GPS Marker icon and place it in the desired location on the map or enter the X and Y position values in the GPS Marker Details table on the left sidebar menu to move the marker to the desired position.
Note ![]() If the markers added are too close, then the accuracy of geo-location information is less.
If the markers added are too close, then the accuracy of geo-location information is less.
Step 5 ![]() Enter the Latitude and Longitude degrees for the selected GPS Marker icon in the left sidebar menu.
Enter the Latitude and Longitude degrees for the selected GPS Marker icon in the left sidebar menu.
Step 6 ![]() Click Save.
Click Save.
The GPS Marker information is saved to the database.
Step 7 ![]() Click Apply to other Floors of Building to copy GPS markers on one floor of a building to all the remaining floors of that building.
Click Apply to other Floors of Building to copy GPS markers on one floor of a building to all the remaining floors of that building.
Editing a GPS Marker
To edit a GPS marker present on the floor, follow these steps:
Step 1 ![]() Choose Monitor > Site Maps to display the Maps page.
Choose Monitor > Site Maps to display the Maps page.
Step 2 ![]() Click the Campus Name > Building Name > Floor Name.
Click the Campus Name > Building Name > Floor Name.
Step 3 ![]() Click the Add/Edit GPS Markers Information menu option on the top left menu for the Add/Edit GPS page to appear.
Click the Add/Edit GPS Markers Information menu option on the top left menu for the Add/Edit GPS page to appear.
Step 4 ![]() Select an existing GPS marker present on the floor.
Select an existing GPS marker present on the floor.
Step 5 ![]() From the left sidebar menu, you can change the Latitude, Longitude, X Position, and Y Position which is associated with the GPS marker.
From the left sidebar menu, you can change the Latitude, Longitude, X Position, and Y Position which is associated with the GPS marker.
Step 6 ![]() Click Save.
Click Save.
The modified GPS marker information is now saved to the database.
Deleting a GPS Marker Present on a Floor
To delete a GPS marker present on a floor, follow these steps:
Step 1 ![]() Choose Monitor > Site Maps to display the Maps page.
Choose Monitor > Site Maps to display the Maps page.
Step 2 ![]() Click the Campus Name > Building Name > Floor Name.
Click the Campus Name > Building Name > Floor Name.
Step 3 ![]() Click the Add/Edit GPS Markers Information menu option on the top left menu for the Add/Edit GPS page to appear.
Click the Add/Edit GPS Markers Information menu option on the top left menu for the Add/Edit GPS page to appear.
Step 4 ![]() Select an existing GPS Marker which is present on the floor from the left sidebar menu.
Select an existing GPS Marker which is present on the floor from the left sidebar menu.
Note ![]() You can delete multiple GPS markers present on a floor by selecting multiple GPS Markers check box.
You can delete multiple GPS markers present on a floor by selecting multiple GPS Markers check box.
Step 5 ![]() Click Delete GPS Marker.
Click Delete GPS Marker.
The selected GPS marker is deleted from the database.
 Feedback