Cisco Wireless Controller Configuration Guide, Release 8.3
Bias-Free Language
The documentation set for this product strives to use bias-free language. For the purposes of this documentation set, bias-free is defined as language that does not imply discrimination based on age, disability, gender, racial identity, ethnic identity, sexual orientation, socioeconomic status, and intersectionality. Exceptions may be present in the documentation due to language that is hardcoded in the user interfaces of the product software, language used based on RFP documentation, or language that is used by a referenced third-party product. Learn more about how Cisco is using Inclusive Language.
- Updated:
- July 28, 2016
Chapter: Monitoring Cisco WLC
Monitoring Cisco
WLC
Viewing System Resources
Information About Viewing System Resources
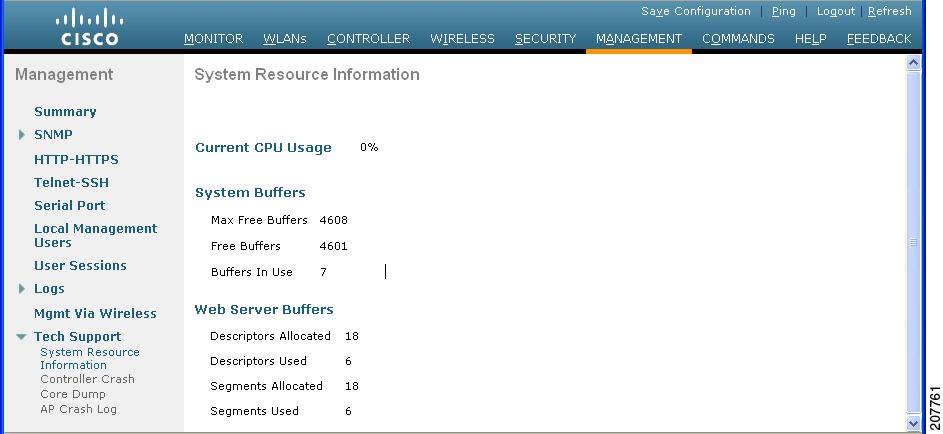
You can determine the amount of system resources being used by the controller. Specifically, you can view the current controller CPU usage, system buffers, and web server buffers.
The Cisco WLCs have multiple CPUs, so you can view individual CPU usage. For each CPU, you can see the percentage of the CPU in use and the percentage of the CPU time spent at the interrupt level (for example, 0%/3%).
Viewing System Resources (GUI)
On the controller GUI, choose Management > Tech Support > System Resource Information. The System Resource Information page appears.
Viewing System Resources (CLI)
On the controller CLI, enter these commands:
-
Where the first number is the CPU percentage that the controller spent on the user application and the second number is the CPU percentage that the controller spent on the OS services.
-
show system top
Provides an ongoing look at processor activity in real time. It displays a list of the most CPU-intensive tasks performed on the system.
-
show system iostat summary
Provides CPU statistics, input and output statistics for devices and partitions.
-
show system iostat detail
Provides CPU statistics, input and output statistics for devices and partitions with extended statistics.
 Feedback