- Index
- New and Changed Information
- Preface
- Overview
- Installing and Launching the DCNM Server
- Installing and Launching the DCNM Client
- Using the DCNM Client
- Administering DCNM Server Users
- Administering Device Discovery
- Administering Devices and Credentials
- Administering DCNM Licensed Devices
- Working with Topology
- Managing Events
- Working with Inventory
- Configuring SPAN
- Managing Device Software Images
- Working with Configuration Change Management
- Administering Auto-Synchronization with Devices
- Administering Statistical Data Collection
- Administering DCNM Server Log Settings
- Maintaining the DCNM Database
- Troubleshooting DCNM
Cisco DCNM Fundamentals Configuration Guide, Release 4.1
Bias-Free Language
The documentation set for this product strives to use bias-free language. For the purposes of this documentation set, bias-free is defined as language that does not imply discrimination based on age, disability, gender, racial identity, ethnic identity, sexual orientation, socioeconomic status, and intersectionality. Exceptions may be present in the documentation due to language that is hardcoded in the user interfaces of the product software, language used based on RFP documentation, or language that is used by a referenced third-party product. Learn more about how Cisco is using Inclusive Language.
- Updated:
- November 12, 2008
Chapter: Using the DCNM Client
Using the DCNM Client
This chapter describes the user interface of the Cisco Data Center Network Manager (DCNM) client and how to use common features.
This chapter includes the following sections:
•![]() Working with Statistics and Charts
Working with Statistics and Charts
•![]() Configuring Global Preferences
Configuring Global Preferences
•![]() Feature History for Using the DCNM Client
Feature History for Using the DCNM Client
Introducing the DCNM Client
This section describes the DCNM client and its parts.
This section includes the following topics:
User Interface
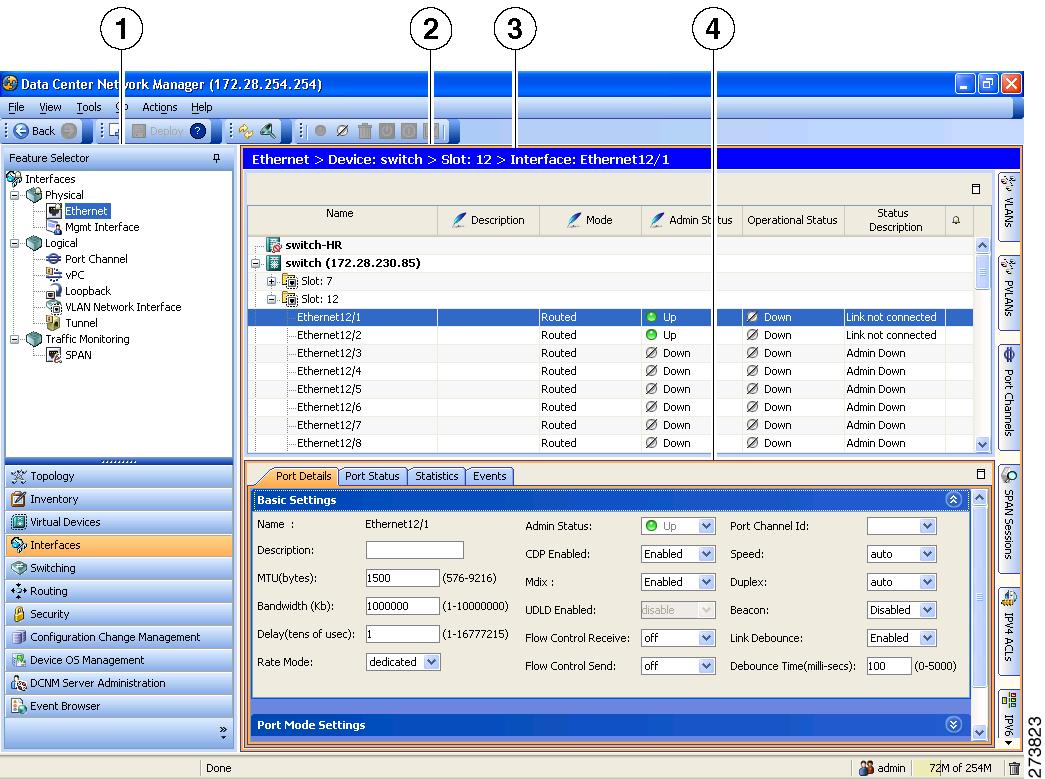
The DCNM client user interface, shown in Figure 4-1, presents device status information and provides configuration tools that allow you to manage devices. It is divided into the panes shown in Figure 4-1. When you want to view information about a specific object in a managed device or want to perform a configuration task, you use the panes in the order shown in Figure 4-1.
Figure 4-1
DCNM Client User Interface
|
|
Feature Selector pane |
|
Contents pane |
|
|
Summary pane |
|
Details pane |
Feature Selector Pane
The Feature Selector pane, shown in Figure 4-1, allows you to see features grouped by categories and to choose the feature that you want to use or configure. The bottom section of the Feature Selector pane displays buttons for feature categories. When you choose a category, the top section of the Feature Selector pane displays a tree of features within the chosen category.
In Figure 4-1, the Interfaces category is chosen, so the tree shows features that allow you to configure the interfaces of managed devices.
The documentation and online help for DCNM includes many procedures that begin with choosing the applicable feature from the Feature Selector pane. For example, a procedure about configuring an Ethernet interface would start with the following step:
From the Feature Selector pane, choose Interfaces > Physical > Ethernet.
After you choose a feature on the tree, the Contents pane displays information about the feature.
Contents Pane
The Contents pane, shown in Figure 4-1, displays information about the currently selected feature and provides fields for configuring that feature. The Contents pane contains two smaller panes: the Summary pane and the Details pane.
Summary Pane
The Summary pane, shown in Figure 4-1, displays an organized set of objects that you can view information about or perform actions on. The type of objects that appear depends upon the currently selected feature.
For example, if you choose Interfaces > Physical > Ethernet from the Feature Selector pane, the Summary pane shows a table of devices. You can expand the managed devices to view the slots that contain network interface cards. You can expand the slots to view the interfaces they contain and key information about the status of the interfaces, such as the port mode, administrative status, and operational status. For most features, the title bar for the Summary pane shows what you have selected.
After you choose the object that you want to view or configure, the Details pane displays information about the selected object, such as an Ethernet interface.
For many features, you can filter the objects that appear in the Summary pane. If filtering is supported for the feature that you selected, you can enable filtering from the menu bar by choosing View > Filter. In the Summary pane, the columns that you can use to filter the objects become drop-down lists. To filter the Summary pane, use the drop-down column heading lists to limit the objects that appear.
Details Pane
The Details pane, shown in Figure 4-1, shows information and configuration fields that are specific to the object that you selected in the Summary pane. The Details tab is often further divided into tabs. You can click on a tab to view its contents.
This section includes the following topics:
•![]() Tabs
Tabs
Tabs
Tabs organize related fields and information. For example, as shown in Figure 4-1, when you select an Ethernet interface, four tabs appears in the Details pane, such as the Port Details tab.
The following two special tabs often appear in the Details pane for many of the types of objects that you can choose from the Summary pane:
•![]() Statistics—You can use this tab to work with statistics and charts related to the selected object. For more information, see the "Working with Statistics and Charts" section.
Statistics—You can use this tab to work with statistics and charts related to the selected object. For more information, see the "Working with Statistics and Charts" section.
•![]() Events—You can use this tab to view feature-specific events about the selected object. For more information, see the "Viewing Events on an Events Tab" section on page 10-5.
Events—You can use this tab to view feature-specific events about the selected object. For more information, see the "Viewing Events on an Events Tab" section on page 10-5.
Sections
Sections provide further organization of related fields and information. The DCNM client allows you to expand and collapse sections so that you can show or hide fields and information as needed. For example, as shown in Figure 4-1, on the Port Details tab, the Basic Settings section is expanded but the Port Mode Settings section is collapsed.
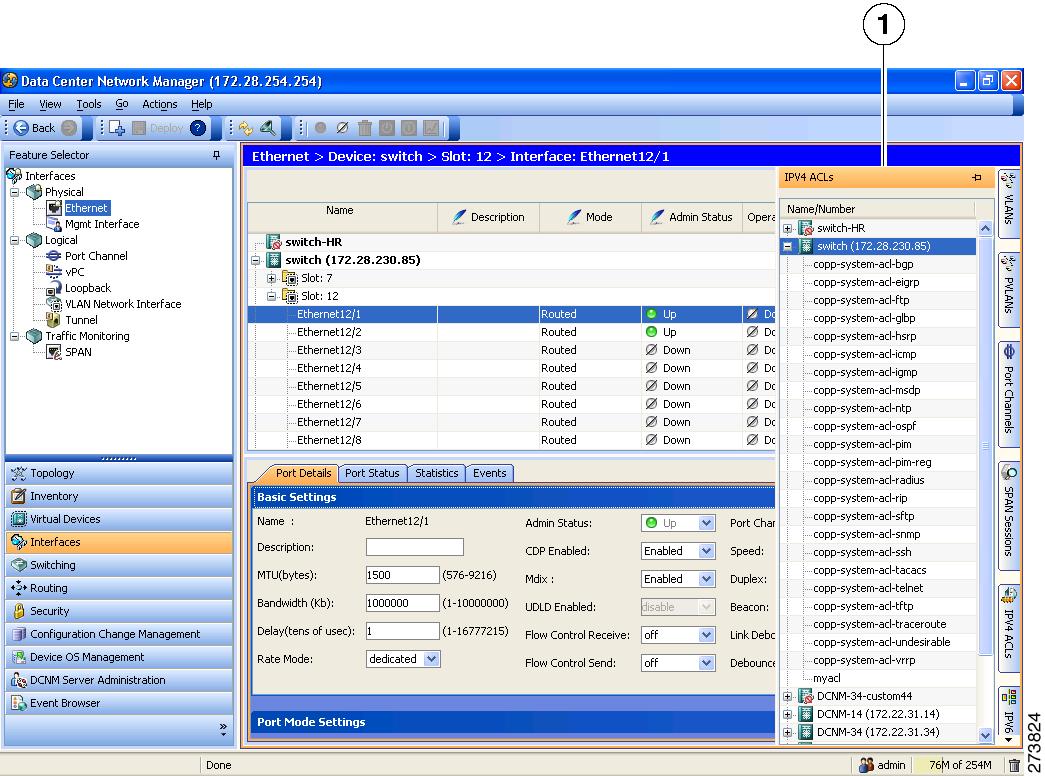
Association Pane
The DCNM client also includes the Association pane, which allows you to access objects that you have configured in features that are associated with the currently selected feature. Figure 4-2 shows the Association pane.
When tabs appear on the right side of the DCNM client, you can click on them to access the Association pane. For example, as shown in Figure 4-2, if you are configuring an Ethernet interface, you can use the Association pane to access the IPv4 ACLs that you can apply to the interface. If you right-click on an IPv4 ACL in the Association pane, you can choose to apply the ACL to the interface or to go to the IPv4 ACLs feature and configure the ACL.
Figure 4-2
Association Pane
|
|
Association pane |
Menus
The menu bar in the DCNM client includes the following standard menus that appear:
File Menu
•![]() New—Allows you to create new objects. The types of objects that you can create depends upon the currently selected feature. In some cases, the object selected in the Summary pane also affects what you can create.
New—Allows you to create new objects. The types of objects that you can create depends upon the currently selected feature. In some cases, the object selected in the Summary pane also affects what you can create.
•![]() Deploy—Saves your changes to the DCNM server and deploys configuration changes to managed devices.
Deploy—Saves your changes to the DCNM server and deploys configuration changes to managed devices.
•![]() Exit—Closes the DCNM client.
Exit—Closes the DCNM client.
View Menu
•![]() Toolbars—Allows you to show or hide the toolbars that are available for the currently selected feature. For more information, see the "Toolbars" section.
Toolbars—Allows you to show or hide the toolbars that are available for the currently selected feature. For more information, see the "Toolbars" section.
•![]() Refresh—Forces the DCNM client to retrieve updated information from the DCNM server.
Refresh—Forces the DCNM client to retrieve updated information from the DCNM server.
•![]() Filter—Enables or disables the filtering option for the Summary pane.
Filter—Enables or disables the filtering option for the Summary pane.
Tools Menu
•![]() Preferences—Opens the Global Preferences dialog box. For more information, see the "Configuring Global Preferences" section.
Preferences—Opens the Global Preferences dialog box. For more information, see the "Configuring Global Preferences" section.
•![]() Debug—Opens the DCNM Client Logging dialog box, which allows you to configure the logging level for the DCNM client.
Debug—Opens the DCNM Client Logging dialog box, which allows you to configure the logging level for the DCNM client.

Note ![]() We recommend that you use the default client logging level unless you are troubleshooting a specific problem or are asked to change client logging levels by the Cisco technical support staff.
We recommend that you use the default client logging level unless you are troubleshooting a specific problem or are asked to change client logging levels by the Cisco technical support staff.
Go Menu
•![]() Topology—Selects the Topology button on the Feature Selector pane.
Topology—Selects the Topology button on the Feature Selector pane.
•![]() Inventory—Selects the Inventory button on the Feature Selector pane.
Inventory—Selects the Inventory button on the Feature Selector pane.
•![]() Virtual Devices—Selects the Virtual Devices button on the Feature Selector pane.
Virtual Devices—Selects the Virtual Devices button on the Feature Selector pane.
•![]() Interfaces—Selects the Interfaces button on the Feature Selector pane.
Interfaces—Selects the Interfaces button on the Feature Selector pane.
•![]() Switching—Selects the Switching button on the Feature Selector pane.
Switching—Selects the Switching button on the Feature Selector pane.
•![]() Routing—Selects the Routing button on the Feature Selector pane.
Routing—Selects the Routing button on the Feature Selector pane.
•![]() Security—Selects the Security button on the Feature Selector pane.
Security—Selects the Security button on the Feature Selector pane.
•![]() DCNM Server Administration—Selects the DCNM Server Administration button on the Feature Selector pane.
DCNM Server Administration—Selects the DCNM Server Administration button on the Feature Selector pane.
•![]() Configuration Change Management—Selects the Configuration Change Management button on the Feature Selector pane.
Configuration Change Management—Selects the Configuration Change Management button on the Feature Selector pane.
•![]() Device OS Management—Selects the Device OS Management button on the Feature Selector pane.
Device OS Management—Selects the Device OS Management button on the Feature Selector pane.
•![]() Event Browser—Selects the Event Browser button on the Feature Selector pane.
Event Browser—Selects the Event Browser button on the Feature Selector pane.
Actions Menu
The items on the Actions menu reflect what you can do, depending upon the feature you are using and the object that is selected in the Summary pane. For some features, such as Inventory, the Actions menu does not appear in the menu bar.
Help Menu
•![]() Help Contents—Opens the online help system to the Welcome page.
Help Contents—Opens the online help system to the Welcome page.
•![]() Context Help—Opens the online help system to a page that applies to the feature currently selected in the Feature Selector pane.
Context Help—Opens the online help system to a page that applies to the feature currently selected in the Feature Selector pane.
•![]() Show DCNM Instance ID—Opens a dialog box that displays the license ID for your DCNM server. For more information, see the "Installing Licenses" section on page 2-7.
Show DCNM Instance ID—Opens a dialog box that displays the license ID for your DCNM server. For more information, see the "Installing Licenses" section on page 2-7.
•![]() View Licenses—Opens a dialog box that displays information about license files currently installed with your DCNM server.
View Licenses—Opens a dialog box that displays information about license files currently installed with your DCNM server.
•![]() About Data Center Network Manager—Opens a dialog box that displays information about your DCNM server, including the software version and implementation version.
About Data Center Network Manager—Opens a dialog box that displays information about your DCNM server, including the software version and implementation version.
Toolbars
The DCNM client provides several standard toolbars plus additional, feature-specific toolbars that are available only when you have selected the applicable feature. The following table lists actions that you can take to configure toolbars.
Keyboard Commands
You can use the keyboard to perform many of the commands that you can perform with menu items or toolbars. The menus show the keyboard equivalent of most menu items. For example, the following list shows some common menu items and the matching keyboard command:
•![]() Deploy—Ctrl + S
Deploy—Ctrl + S
•![]() Refresh—F5
Refresh—F5
•![]() Filter—Ctrl + F
Filter—Ctrl + F
•![]() Online help—F1
Online help—F1
•![]() Exit—Ctrl + Q
Exit—Ctrl + Q
Opening the DCNM Client
You can open the DCNM client after you have installed the DCNM client on the computer that you are using.
BEFORE YOU BEGIN
Install the DCNM client on the computer that you are using. For more information about installing the DCNM client, see Chapter 3, "Installing and Launching the DCNM Client."
DETAILED STEPS
To open the DCNM client, follow these steps:
Step 1 ![]() From the start menu, choose All Programs > Cisco DCNM Client > Cisco DCNM Client.
From the start menu, choose All Programs > Cisco DCNM Client > Cisco DCNM Client.
Note ![]() If the DCNM client is not available on the All Programs menu, you can launch the DCNM client from the DCNM server website. For more information, see Chapter 3, "Installing and Launching the DCNM Client."
If the DCNM client is not available on the All Programs menu, you can launch the DCNM client from the DCNM server website. For more information, see Chapter 3, "Installing and Launching the DCNM Client."
A dialog box displays login fields.
Step 2 ![]() In the DCNM Server field, enter the IP address or hostname of the DCNM server. You can use the hostname only if your DNS server has an entry for the DCNM server hostname.
In the DCNM Server field, enter the IP address or hostname of the DCNM server. You can use the hostname only if your DNS server has an entry for the DCNM server hostname.

Tip ![]() If you have previously logged into the server with the current client installation, you may be able to choose the IP address or hostname from the drop-down list.
If you have previously logged into the server with the current client installation, you may be able to choose the IP address or hostname from the drop-down list.
Step 3 ![]() In the Username field, enter the name of the DCNM server user account that you want to use to access the DCNM client.
In the Username field, enter the name of the DCNM server user account that you want to use to access the DCNM client.
Step 4 ![]() In the Password field, enter the password for the user account that you specified.
In the Password field, enter the password for the user account that you specified.
Step 5 ![]() If your DCNM server uses a port number other than 1099, click More and enter the port number for your DCNM server in the Port field.
If your DCNM server uses a port number other than 1099, click More and enter the port number for your DCNM server in the Port field.
Step 6 ![]() Click Login.
Click Login.
The DCNM client user interface appears.
If a dialog box displays a message about device credentials, you have not configured device credentials for the user account that you specified.
Step 7 ![]() If a dialog box shows a message that your device credentials are not set, do one of the following:
If a dialog box shows a message that your device credentials are not set, do one of the following:
•![]() If you want to set device credentials now, click Yes.
If you want to set device credentials now, click Yes.
•![]() If you do not want to set device credentials now, click No.
If you do not want to set device credentials now, click No.
Note ![]() For information about setting device credentials, see the "Administering Devices and Credentials" section on page 7-1.
For information about setting device credentials, see the "Administering Devices and Credentials" section on page 7-1.
Closing the DCNM Client
You can close the DCNM client when you are done using it.
DETAILED STEPS
To close the DCNM client, follow these steps:
Step 1 ![]() From the menu bar, choose File > Exit.
From the menu bar, choose File > Exit.
A dialog box displays a confirmation message.
Step 2 ![]() (Optional) If you have not deployed your changes, do one of the following:
(Optional) If you have not deployed your changes, do one of the following:
•![]() If you want to save your changes, including deploying configuration changes to managed devices, check Save pending changes.
If you want to save your changes, including deploying configuration changes to managed devices, check Save pending changes.
•![]() If you want to discard your changes, uncheck Save pending changes.
If you want to discard your changes, uncheck Save pending changes.
Step 3 ![]() Click Yes.
Click Yes.
If you started any statistical data collection processes during the DCNM client session, a dialog box displays the collection processes.
Step 4 ![]() If a dialog box displays the statistical data collection processes that you started, do the following:
If a dialog box displays the statistical data collection processes that you started, do the following:
a. ![]() Decide which statistical collection processes that you want to stop.
Decide which statistical collection processes that you want to stop.
Note ![]() We recommend that you stop any unnecessary statistical collection processes when you log out of the DCNM client.
We recommend that you stop any unnecessary statistical collection processes when you log out of the DCNM client.
b. ![]() Check the collection processes that you want to stop. If you want to stop all of your collection processes, click Select All.
Check the collection processes that you want to stop. If you want to stop all of your collection processes, click Select All.
c. ![]() Click Ok.
Click Ok.
Deploying Changes
After you make changes to the configuration of either the DCNM server or managed devices, you must deploy them. The DCNM client does not update the server or managed devices with the changes that you have made until you deploy them.
Deploying server changes saves your changes on the DCNM server. For example, if you add a DCNM server user account, deploying your changes adds the user account to the DCNM server and does not affect managed devices.
Deploying configuration changes to a managed device causes the DCNM server to update the running configuration of the device.
Note ![]() DCNM does not update the startup configuration of a managed device. When you want to replace the startup configuration of a managed device with the running configuration, you can log into the command-line interface of the device and copy the running configuration to the startup configuration.
DCNM does not update the startup configuration of a managed device. When you want to replace the startup configuration of a managed device with the running configuration, you can log into the command-line interface of the device and copy the running configuration to the startup configuration.
When you close the DCNM client and you have not deployed your changes, you can deploy them without canceling the process of closing the DCNM client. For more information, see the "Closing the DCNM Client" section.
To remind you of the necessity to deploy changes that you make, the procedures in the DCNM documentation set include a deployment step.
Working with Statistics and Charts
This section describes how to use the statistical charts available on a Statistics tab.
This section includes the following topics:
•![]() Information about Statistics and Charts
Information about Statistics and Charts
•![]() Licensing Requirements for Statistics and Charts
Licensing Requirements for Statistics and Charts
•![]() Starting Statistical Monitoring for a Chart
Starting Statistical Monitoring for a Chart
•![]() Stopping Statistical Monitoring for a Chart
Stopping Statistical Monitoring for a Chart
Information about Statistics and Charts
You can use a Statistics tab to start and stop statistical monitoring for an object and to work with charts of statistical data about the selected object. For each chart, the DCNM client also provides overview charts, which allow you to see historical trends and to control the time scale of the standard chart.
When you start monitoring for a new chart, DCNM creates a new statistical collection process that appears in the Statistical Data Collection feature. For more information, see the "Administering Statistical Data Collection" section on page 16-1.
Licensing Requirements for Statistics and Charts
The following table shows the licensing requirements for this feature:
|
|
|
|---|---|
DCNM |
Real-time monitoring requires no license. DCNM requires a LAN Enterprise license for the following features: • • For information about obtaining and installing a DCNM LAN Enterprise license, see the "Installing Licenses" section on page 2-7. |
Accessing a Chart
You can access any chart. The charts that are available for a particular Statistics tab depend upon the feature and object selected.
DETAILED STEPS
To access a chart, follow these steps:
Step 1 ![]() From the Feature Selector pane, choose the feature for which you want to use a statistical chart.
From the Feature Selector pane, choose the feature for which you want to use a statistical chart.
For example, choose Interfaces > Physical > Ethernet.
Step 2 ![]() From the Summary pane, select an object.
From the Summary pane, select an object.
The Statistics tab appears in the Details pane. In the Statistics tab, one or more charts may appear.
Note ![]() If no Statistics tab appears, then DCNM does not provide a statistical chart for the object that you selected.
If no Statistics tab appears, then DCNM does not provide a statistical chart for the object that you selected.
Step 3 ![]() If the chart for the data that you want to monitor does not appear, from the toolbar, choose New Chart and then choose the chart that you want.
If the chart for the data that you want to monitor does not appear, from the toolbar, choose New Chart and then choose the chart that you want.
Step 4 ![]() Click the title bar of the chart that you want to work with.
Click the title bar of the chart that you want to work with.
The chart status appears in the lower left corner of the chart pane. If the chart is not active, you must start statistical monitoring for the chart before you can use it. For more information, see the "Starting Statistical Monitoring for a Chart" section.
Starting Statistical Monitoring for a Chart
You can start statistical monitoring for a chart in the Statistics tab for any of the device configuration features that support statistical monitoring.
Note ![]() Each time that you start monitoring for a new chart, DCNM creates a new statistical collection process that appears in the Statistical Data Collection feature.
Each time that you start monitoring for a new chart, DCNM creates a new statistical collection process that appears in the Statistical Data Collection feature.
DETAILED STEPS
To start statistical monitoring for a chart, follow these steps:
Step 1 ![]() Access the chart for which you want to start statistical monitoring. For more information, see the "Accessing a Chart" section.
Access the chart for which you want to start statistical monitoring. For more information, see the "Accessing a Chart" section.
Step 2 ![]() From the chart pane, click Select Parameters, check at least one statistical parameter that you want to appear in the chart, and click Select Parameters again.
From the chart pane, click Select Parameters, check at least one statistical parameter that you want to appear in the chart, and click Select Parameters again.
Step 3 ![]() From the Monitor toolbar, choose the
From the Monitor toolbar, choose the  icon to start the collection process.
Step 4 ![]() The chart starts graphing the selected parameters.
The chart starts graphing the selected parameters.
Note ![]() When you close the DCNM client without stopping the statistical collection processes that you started, a dialog box prompts you to decide whether to stop the statistical collections or let them continue. We recommend that you stop any unnecessary statistical collection processes when you log out of the DCNM client.
When you close the DCNM client without stopping the statistical collection processes that you started, a dialog box prompts you to decide whether to stop the statistical collections or let them continue. We recommend that you stop any unnecessary statistical collection processes when you log out of the DCNM client.
Stopping Statistical Monitoring for a Chart
You can stop statistical monitoring for a chart in the Statistics tab.
Note ![]() When you stop monitoring for a chart, DCNM stops the corresponding statistical collection process that appears in the Statistical Data Collection feature.
When you stop monitoring for a chart, DCNM stops the corresponding statistical collection process that appears in the Statistical Data Collection feature.
DETAILED STEPS
To stop statistical monitoring for a chart, follow these steps:
Step 1 ![]() Access the chart for which you want to stop statistical monitoring. For more information, see the "Accessing a Chart" section.
Access the chart for which you want to stop statistical monitoring. For more information, see the "Accessing a Chart" section.
Step 2 ![]() From the Monitor toolbar choose the
From the Monitor toolbar choose the  icon.
icon.
Note ![]() If the chart that you want to stop does not appear, use the Statistical Data Collection feature to stop the collection process. For more information, see the "Starting Statistical Monitoring for a Chart" section.
If the chart that you want to stop does not appear, use the Statistical Data Collection feature to stop the collection process. For more information, see the "Starting Statistical Monitoring for a Chart" section.
Using a Chart
The DCNM client provides the following options for using a chart:
•![]() Changing parameters
Changing parameters
•![]() Setting the charting frequency
Setting the charting frequency
•![]() Controlling the magnification of the chart data
Controlling the magnification of the chart data
•![]() Showing, moving, and hiding threshold lines
Showing, moving, and hiding threshold lines
•![]() Tearing the chart away from the DCNM client window
Tearing the chart away from the DCNM client window
This procedure provides basic instructions for using each of these options.
Note ![]() For information about using an overview chart, see the "Using an Overview Chart" section.
For information about using an overview chart, see the "Using an Overview Chart" section.
DETAILED STEPS
To use a chart, follow these steps:
Step 1 ![]() Access the chart that you want to use. For more information, see the "Accessing a Chart" section.
Access the chart that you want to use. For more information, see the "Accessing a Chart" section.
Step 2 ![]() If the chart is not active, you must start statistical monitoring for the chart before you can use it. For more information, see the "Starting Statistical Monitoring for a Chart" section.
If the chart is not active, you must start statistical monitoring for the chart before you can use it. For more information, see the "Starting Statistical Monitoring for a Chart" section.
Step 3 ![]() (Optional) To change parameters, click Select Parameters, check the statistics parameters that you want to collect, and click Select Parameters again.
(Optional) To change parameters, click Select Parameters, check the statistics parameters that you want to collect, and click Select Parameters again.
Step 4 ![]() (Optional) To set the frequency with which DCNM retrieves statistical data for the selected object, from the Select Frequency drop-down list on the Monitor tool bar, choose the new frequency.
(Optional) To set the frequency with which DCNM retrieves statistical data for the selected object, from the Select Frequency drop-down list on the Monitor tool bar, choose the new frequency.
Step 5 ![]() (Optional) To control the magnification, or zoom, of the chart, do one of the following:
(Optional) To control the magnification, or zoom, of the chart, do one of the following:
•![]() To zoom in on a portion of the chart, position the mouse pointer at one end of the portion, click and hold the left mouse button, drag the mouse pointer to the other end of the portion, and release the mouse button.
To zoom in on a portion of the chart, position the mouse pointer at one end of the portion, click and hold the left mouse button, drag the mouse pointer to the other end of the portion, and release the mouse button.
•![]() To zoom in on a portion of the chart, position the mouse pointer at one end of the portion and then click and drag the mouse pointer to the other end of the portion.
To zoom in on a portion of the chart, position the mouse pointer at one end of the portion and then click and drag the mouse pointer to the other end of the portion.
•![]() To change to the previous zoom, click the
To change to the previous zoom, click the  icon.
icon.
•![]() To change to the next zoom, click the
To change to the next zoom, click the  icon.
icon.
•![]() To reset the zoom to the default magnification, click the
To reset the zoom to the default magnification, click the  icon.
icon.
Step 6 ![]() (Optional) To show, move, or hide threshold lines, do one of the following:
(Optional) To show, move, or hide threshold lines, do one of the following:
•![]() To show or hide threshold lines, on the Monitor tool bar, click the
To show or hide threshold lines, on the Monitor tool bar, click the  icon.
icon.
•![]() To move the lower threshold line, click and drag the
To move the lower threshold line, click and drag the  icon.
icon.
•![]() To move the lower threshold line, click and drag the
To move the lower threshold line, click and drag the  icon.
icon.
Step 7 ![]() (Optional) To tear the chart away from the DCNM client window, click on the red line that appears below the chart title.
(Optional) To tear the chart away from the DCNM client window, click on the red line that appears below the chart title.
Using an Overview Chart
You can use an overview chart to view the historical trend of the statistical data of the current chart and to set the time scale of the standard chart.
BEFORE YOU BEGIN
Ensure that any device with data that you want to view on an overview chart is included on the list of DCNM-licensed devices. For more information, see the "Licensing Requirements for Statistics and Charts" section.
DETAILED STEPS
To use an overview chart, follow these steps:
Step 1 ![]() Access the chart that contains the overview chart that you want to use. For more information, see the "Accessing a Chart" section.
Access the chart that contains the overview chart that you want to use. For more information, see the "Accessing a Chart" section.
Step 2 ![]() If the chart is not active, you must start statistical monitoring for the chart before you can use its overview chart. For more information, see the "Starting Statistical Monitoring for a Chart" section.
If the chart is not active, you must start statistical monitoring for the chart before you can use its overview chart. For more information, see the "Starting Statistical Monitoring for a Chart" section.
Step 3 ![]() Click Show Overview Chart.
Click Show Overview Chart.
In a new window, the overview chart displays the historical trends of the charted data.
Step 4 ![]() To set the time scale of the chart, at the bottom of the overview chart window, click the desired time scale button. The time scale buttons are as follows:
To set the time scale of the chart, at the bottom of the overview chart window, click the desired time scale button. The time scale buttons are as follows:
•![]() RT—Real time
RT—Real time
•![]() 1d—One day
1d—One day
•![]() 2d—Two days
2d—Two days
•![]() 5d—Five days
5d—Five days
•![]() 15d—Fifteen days
15d—Fifteen days
•![]() 1m—One month
1m—One month
•![]() 3m—Three months
3m—Three months
Step 5 ![]() To close the overview chart, click Show Overview Chart again.
To close the overview chart, click Show Overview Chart again.
Exporting a Chart
You can export a chart as an JPG image or as a comma-separated value (CSV) file.
When you export a chart as a JPG image, the image is of the chart as it appears when you export the image.
When you export a chart as a CSV file, the file contains all data from the statistical collection for the chart.
DETAILED STEPS
To export an image of a chart, follow these steps:
Step 1 ![]() Access the chart that you want to use. For more information, see the "Accessing a Chart" section.
Access the chart that you want to use. For more information, see the "Accessing a Chart" section.
Step 2 ![]() If the chart is not active, you must start statistical monitoring for the chart before you can export an image of it. For more information, see the "Starting Statistical Monitoring for a Chart" section.
If the chart is not active, you must start statistical monitoring for the chart before you can export an image of it. For more information, see the "Starting Statistical Monitoring for a Chart" section.
Step 3 ![]() If you want to export an image, configure the chart to show the data that you want to appear in the image. For more information, see the "Using a Chart" section.
If you want to export an image, configure the chart to show the data that you want to appear in the image. For more information, see the "Using a Chart" section.
Step 4 ![]() Right-click on the chart.
Right-click on the chart.
Step 5 ![]() Choose one of the following:
Choose one of the following:
•![]() Export as CSV
Export as CSV
•![]() Export as JPG
Export as JPG
Step 6 ![]() Specify the location and filename, and then click Save.
Specify the location and filename, and then click Save.
The DCNM client exports the chart in the file format that you specified.
Configuring Global Preferences
Using the Global Preferences dialog box, you can configure several preferences for how the DCNM client displays data and fields. The four sections on the Global Preferences are as follows:
•![]() Monitoring—Controls the default frequency of statistical data retrieval from managed devices. For more information, see the "Configuring the Default Frequency of Statistical Data Retrieval" section.
Monitoring—Controls the default frequency of statistical data retrieval from managed devices. For more information, see the "Configuring the Default Frequency of Statistical Data Retrieval" section.
•![]() Events—Controls the maximum age of events that the DCNM client fetches from the DCNM server when you start the DCNM client. For more information, see the "Configuring the Maximum Age of Events Fetched from the Server" section.
Events—Controls the maximum age of events that the DCNM client fetches from the DCNM server when you start the DCNM client. For more information, see the "Configuring the Maximum Age of Events Fetched from the Server" section.
•![]() Pre Provision—Controls whether the DCNM client displays some settings only when other settings are made or whether the DCNM client always displays all settings. For more information, see the "Configuring Preprovisioning" section.
Pre Provision—Controls whether the DCNM client displays some settings only when other settings are made or whether the DCNM client always displays all settings. For more information, see the "Configuring Preprovisioning" section.
Configuring the Default Frequency of Statistical Data Retrieval
You can configure the default frequency for statistical data retrieval from monitored devices. The default frequency for statistical data retrieval is 30 seconds. This frequency determines the initial data retrieval frequency for a new chart. Users can override the default frequency by configuring the chart-specific setting.
BEFORE YOU BEGIN
Determine how often you want DCNM to retrieve statistical data by default. Consider how important it is to your organization that charts update frequently. If very current charting data is important to your organization, consider using a short data retrieval frequency.
DETAILED STEPS
To configure the default frequency of statistical data retrieval, follow these steps:
Step 1 ![]() From the menu bar, choose Tools > Preferences.
From the menu bar, choose Tools > Preferences.
The Global Preferences dialog box appears. Under Monitoring, the Default Monitoring Frequency drop-down list displays the current frequency for statistical data retrieval.
The default polling frequency is 30 seconds.
Step 2 ![]() From the Default Monitoring Frequency drop-down list, choose the new data retrieval frequency.
From the Default Monitoring Frequency drop-down list, choose the new data retrieval frequency.
Step 3 ![]() Click Ok.
Click Ok.
Configuring the Maximum Age of Events Fetched from the Server
You can configure the maximum age of events that the DCNM client fetches from the DCNM server when you start the DCNM client. This setting affects how old the events are that the DCNM client displays in the Event Browser and on feature-specific Events tabs. By default, the DCNM client fetches events that occurred up to 1 hour prior to the DCNM client startup. You can configure the DCNM client to fetch events that are up to 24 hours old.
DETAILED STEPS
To configure the maximum age of events that the DCNM client fetches from the server, follow these steps:
Step 1 ![]() From the menu bar, choose Tools > Preferences.
From the menu bar, choose Tools > Preferences.
The Global Preferences dialog box appears. Under Events, the Fetch events before drop-down list displays the current maximum age of events.
Step 2 ![]() From the Fetch events before drop-down list, choose the new maximum age of events.
From the Fetch events before drop-down list, choose the new maximum age of events.
Note ![]() To prevent the DCNM client from fetching any old events, choose zero (0) hours as the maximum age of events. When you choose zero hours, the DCNM client shows only the events that the DCNM server receives after you start the DCNM client.
To prevent the DCNM client from fetching any old events, choose zero (0) hours as the maximum age of events. When you choose zero hours, the DCNM client shows only the events that the DCNM server receives after you start the DCNM client.
Step 3 ![]() Click Ok.
Click Ok.
Configuring Preprovisioning
Preprovisioning refers to configuring a managed device with settings for modes or protocols that are not enabled. The preprovisioning preference affects the following sections of the DCNM client interface:
•![]() Interfaces > Physical > Ethernet > Device > Slot > Interface, Port Details tab, Port Mode Settings section
Interfaces > Physical > Ethernet > Device > Slot > Interface, Port Details tab, Port Mode Settings section
When you enable preprovisioning, the DCNM client displays all port mode fields regardless of the setting in the Mode drop-down list. When you disable preprovisioning, the DCNM client displays only the port mode settings that are relevant to the currently selected port mode. For example, if preprovisioning is disabled and you choose Trunk from the Mode drop-down list, the DCNM client displays only the Trunk settings and hides the Access, PVLAN Host, and PVLAN Promiscuous fields.
Additionally, the dialog boxes for configuring the Access VLAN field and the Native VLAN field include the Create in the Device check box. When you enable preprovisioning, you can uncheck this check box if you want DCNM to configure the device to refer to a VLAN that is not currently configured. When you disable preprovisioning, this check box is always checked and DCNM creates the VLAN specified, if it does not already exist.
•![]() Switching > Spanning Tree > Device, Configuration tab, Global Settings section
Switching > Spanning Tree > Device, Configuration tab, Global Settings section
When you enable preprovisioning, the DCNM client displays MST settings regardless of the settings in the Protocol drop-down list. When you disable preprovisioning, the DCNM client displays the MST Setting fields unless you choose MST from the Protocol drop-down list.
DETAILED STEPS
To configure preprovisioning, follow these steps:
Step 1 ![]() From the menu bar, choose Tools > Preferences.
From the menu bar, choose Tools > Preferences.
The Global Preferences dialog box appears. Under Pre Provision, the Pre Provision check box appears.
Step 2 ![]() Do one of the following:
Do one of the following:
•![]() If you want to enable preprovisioning, ensure that the Pre Provision check box is checked.
If you want to enable preprovisioning, ensure that the Pre Provision check box is checked.
•![]() If you want to disable preprovisioning, ensure that the Pre Provision check box is unchecked.
If you want to disable preprovisioning, ensure that the Pre Provision check box is unchecked.
Step 3 ![]() Click Ok.
Click Ok.
Using Online Help
Online help has the following features:
•![]() Contents—The organization of DCNM online help is shown in the Contents tab of the online help window. When a topic has subtopics, the book icon appears to the left of the topic in the contents.
Contents—The organization of DCNM online help is shown in the Contents tab of the online help window. When a topic has subtopics, the book icon appears to the left of the topic in the contents.
You can expand and collapse individual topics in the contents. You can also collapse or expand all topics.
•![]() Index—DCNM online help includes an index, which allows you to look up subjects alphabetically and open related topics directly from the index.
Index—DCNM online help includes an index, which allows you to look up subjects alphabetically and open related topics directly from the index.
•![]() Favorites—DCNM online help allows you to add specific topics to the Favorites tab. Favorites are stored locally on the computer that you use to access online help.
Favorites—DCNM online help allows you to add specific topics to the Favorites tab. Favorites are stored locally on the computer that you use to access online help.
To access the welcome page in online help, from the menu bar, choose Help > Help Contents.
DCNM online help includes context-sensitive help.
To access context-sensitive help for a feature, follow these steps:
Step 1 ![]() Select a specific feature from the Feature Selector pane in the DCNM client. For example, choose Security > Access Control > IPv4 ACL.
Select a specific feature from the Feature Selector pane in the DCNM client. For example, choose Security > Access Control > IPv4 ACL.
Step 2 ![]() Do one of the following:
Do one of the following:
•![]() Press F1.
Press F1.
•![]() From the toolbar, click the question mark icon.
From the toolbar, click the question mark icon.
Online help for the selected feature appears in a browser window. DCNM uses the default browser application on the computer that runs the DCNM client.
Additional References
For additional information related to using the DCNM client, see the following sections:
Related Documents
|
|
|
|---|---|
Installing and launching the DCNM client |
|
Information about using specific DCNM features |
Standards
|
|
|
|---|---|
No new or modified standards are supported by this feature, and support for existing standards has not been modified by this feature. |
— |
Feature History for Using the DCNM Client
Table 4-1 lists the release history for this feature.
 Feedback