- Index
- New and Changed Information
- Preface
- Overview
- Installing and Launching the DCNM Server
- Installing and Launching the DCNM Client
- Using the DCNM Client
- Administering DCNM Server Users
- Administering Device Discovery
- Administering Devices and Credentials
- Administering DCNM Licensed Devices
- Working with Topology
- Managing Events
- Working with Inventory
- Configuring SPAN
- Managing Device Software Images
- Working with Configuration Change Management
- Administering Auto-Synchronization with Devices
- Administering Statistical Data Collection
- Administering DCNM Server Log Settings
- Maintaining the DCNM Database
- Troubleshooting DCNM
Cisco DCNM Fundamentals Configuration Guide, Release 4.1
Bias-Free Language
The documentation set for this product strives to use bias-free language. For the purposes of this documentation set, bias-free is defined as language that does not imply discrimination based on age, disability, gender, racial identity, ethnic identity, sexual orientation, socioeconomic status, and intersectionality. Exceptions may be present in the documentation due to language that is hardcoded in the user interfaces of the product software, language used based on RFP documentation, or language that is used by a referenced third-party product. Learn more about how Cisco is using Inclusive Language.
- Updated:
- November 12, 2008
Chapter: Working with Inventory
Working with Inventory
This chapter describes how to use the Inventory feature in Cisco Data Center Network Manager (DCNM).
This chapter has the following sections:
•![]() Displaying the Chassis Information
Displaying the Chassis Information
•![]() Displaying the Module Information
Displaying the Module Information
•![]() Displaying the Power Supply Information
Displaying the Power Supply Information
•![]() Displaying the Fan Tray Information
Displaying the Fan Tray Information
•![]() Feature History for Inventory
Feature History for Inventory
Information About Inventory
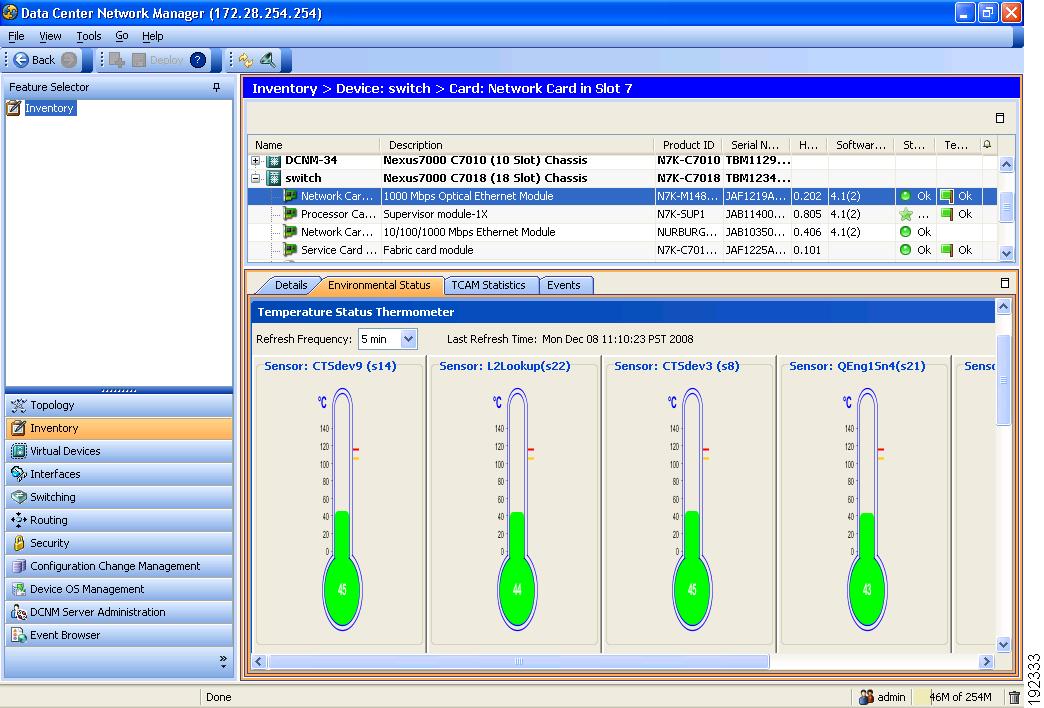
The Inventory feature, shown in Figure 11-1, displays information about the chassis, modules, fan trays, and power supplies for managed devices. The DCNM client can display summary and detailed information for these device components.
Figure 11-1 Inventory Contents Pane
Displaying the Chassis Information
DCNM displays summary, detail, environmental, and event information for the chassis.
This section includes the following topics:
•![]() Displaying the Chassis Summary Information
Displaying the Chassis Summary Information
•![]() Displaying the Chassis Detail information
Displaying the Chassis Detail information
•![]() Displaying the Chassis Environmental Status
Displaying the Chassis Environmental Status
•![]() Displaying the Chassis CPU Utilization
Displaying the Chassis CPU Utilization
•![]() Displaying the Chassis Memory Utilization
Displaying the Chassis Memory Utilization
•![]() Displaying the Chassis Events
Displaying the Chassis Events
Displaying the Chassis Summary Information
DCNM displays the chassis summary information for each device it manages when you choose Inventory in the Feature Selector pane. The summary information includes the chassis description, product ID, serial number, hardware version, software version, status, temperature, and events.
DETAILED STEPS
To display the summary information for a chassis, from the Feature Selector pane, choose Inventory. The summary pane displays summary information for each managed device.
Displaying the Chassis Detail information
DCNM displays the chassis detail information for the device that you choose in the Summary pane. This detail information includes hardware and software information. The hardware information includes the switch name, product ID, IP address, serial number, chassis description.
DETAILED STEPS
Step 1 ![]() From the Feature Selector pane, choose Inventory.
From the Feature Selector pane, choose Inventory.
Summary chassis information for each managed device appears in the Summary pane.
Step 2 ![]() From the Summary pane, click the device.
From the Summary pane, click the device.
Tabs appear in the Details pane. The Details tab shows the hardware and software information.
Displaying the Chassis Environmental Status
DCNM displays the chassis environmental status information for the device that you choose in the Summary pane. The environmental information includes power usage information and information about supervisor and power supply redundancy.
DETAILED STEPS
To display the environmental status for a chassis, follow these steps:
Step 1 ![]() From the Feature Selector pane, choose Inventory.
From the Feature Selector pane, choose Inventory.
Summary information for each managed device appears in the Summary pane.
Step 2 ![]() From the Summary pane, click the device.
From the Summary pane, click the device.
Tabs appear in the Details pane.
Step 3 ![]() From the Details pane, click the Environmental Status tab.
From the Details pane, click the Environmental Status tab.
Power usage and redundancy information appears in the Details pane.
Displaying the Chassis CPU Utilization
DCNM displays the percentage of CPU utilization over time for the device that you choose in the Summary pane. You can customize the reporting of this utilization for types of utilization (user, kernel, or idle), specific thresholds, and time intervals.
DETAILED STEPS
To display the CPU utilization, follow these steps:
Step 1 ![]() From the Feature Selector pane, choose Inventory.
From the Feature Selector pane, choose Inventory.
Summary information for each managed device appears in the Summary pane.
Step 2 ![]() From the summary pane, click the device.
From the summary pane, click the device.
Tabs appear in the Details pane.
Step 3 ![]() From the Details pane, click the CPU Utilization tab.
From the Details pane, click the CPU Utilization tab.
The CPU utilization table appears.
Step 4 ![]() (Optional) To display the percentage of utilization devoted to user or kernel functions, follow these steps:
(Optional) To display the percentage of utilization devoted to user or kernel functions, follow these steps:
a. ![]() Click Select Parameters.
Click Select Parameters.
A list of utilization types (user, kernel, and idle) appears.
b. ![]() Choose the utilization types that you need to see reported.
Choose the utilization types that you need to see reported.
Step 5 ![]() (Optional) To display utilization within specific thresholds, follow these steps:
(Optional) To display utilization within specific thresholds, follow these steps:
a. ![]() Click the Turn Thresholds On/Off tool.
Click the Turn Thresholds On/Off tool.
The Adjust Threshold Limits slider tool appears on the toolbar next to the Turn Thresholds On/Off tool.
b. ![]() To set a minimum CPU utilization threshold, move the left slider to the desired utilization.
To set a minimum CPU utilization threshold, move the left slider to the desired utilization.
c. ![]() To set a maximum CPU utilization threshold, move the right slider to the desired utilization.
To set a maximum CPU utilization threshold, move the right slider to the desired utilization.
Step 6 ![]() (Optional) To change the monitoring frequency, follow these steps:
(Optional) To change the monitoring frequency, follow these steps:
a. ![]() Click in the Select Frequency tool drop-down list.
Click in the Select Frequency tool drop-down list.
Time intervals appear for you to choose.
b. ![]() Choose the appropriate time interval.
Choose the appropriate time interval.
Step 7 ![]() Click the Start Monitoring tool to begin monitoring CPU utilization.
Click the Start Monitoring tool to begin monitoring CPU utilization.
Step 8 ![]() (Optional) To stop monitoring the CPU utilization, click the Stop Monitoring tool.
(Optional) To stop monitoring the CPU utilization, click the Stop Monitoring tool.
Step 9 ![]() (Optional) To display how the CPU utilization compares over days or months, follow these steps:
(Optional) To display how the CPU utilization compares over days or months, follow these steps:
a. ![]() Click Show Overview Chart.
Click Show Overview Chart.
b. ![]() (Optional) To see the latest or real-time utilization data, click RT.
(Optional) To see the latest or real-time utilization data, click RT.
c. ![]() (Optional) To compare utilization data over days or months, click the appropriate button for the amount of time desired (1d shows one day, 2d shows two days, and so on).
(Optional) To compare utilization data over days or months, click the appropriate button for the amount of time desired (1d shows one day, 2d shows two days, and so on).
Displaying the Chassis Memory Utilization
DCNM displays the percentage of memory utilization over time for the device that you choose in the Summary pane. You can customize the reporting of this utilization for specific thresholds and time intervals.
DETAILED STEPS
To display the memory utilization, follow these steps:
Step 1 ![]() From the Feature Selector pane, choose Inventory.
From the Feature Selector pane, choose Inventory.
Summary information for each managed device appears in the Summary pane.
Step 2 ![]() From the Summary pane, click the device.
From the Summary pane, click the device.
Tabs appear in the Details pane.
Step 3 ![]() From the Details pane, click the Memory Utilization tab.
From the Details pane, click the Memory Utilization tab.
The Memory Utilization table appears.
Step 4 ![]() (Optional) To display utilization within specific thresholds, follow these steps:
(Optional) To display utilization within specific thresholds, follow these steps:
a. ![]() Click the Turn Thresholds On/Off tool.
Click the Turn Thresholds On/Off tool.
The Adjust Threshold Limits slider tool appears on the toolbar next to the Turn Thresholds On/Off tool.
b. ![]() To set a minimum utilization threshold, move the left slider to the desired utilization.
To set a minimum utilization threshold, move the left slider to the desired utilization.
c. ![]() To set a maximum utilization threshold, move the right slider to the desired utilization.
To set a maximum utilization threshold, move the right slider to the desired utilization.
Step 5 ![]() (Optional) To change the monitoring frequency, follow these steps:
(Optional) To change the monitoring frequency, follow these steps:
a. ![]() Click in the Select Frequency tool drop-down list.
Click in the Select Frequency tool drop-down list.
Time intervals appear for you to choose.
b. ![]() Choose the appropriate time interval.
Choose the appropriate time interval.
Step 6 ![]() Click the Start Monitoring tool to begin monitoring utilization.
Click the Start Monitoring tool to begin monitoring utilization.
Step 7 ![]() (Optional) To stop monitoring the utilization, click the Stop Monitoring tool.
(Optional) To stop monitoring the utilization, click the Stop Monitoring tool.
Step 8 ![]() (Optional) To display how the utilization compares over days or months, follow these steps:
(Optional) To display how the utilization compares over days or months, follow these steps:
a. ![]() Click Show Overview Chart.
Click Show Overview Chart.
b. ![]() (Optional) To see the latest or real-time utilization data, click RT.
(Optional) To see the latest or real-time utilization data, click RT.
c. ![]() (Optional To compare utilization data over days or months, click the appropriate button for the amount of time desired (1d shows one day, 2d shows two days, and so on).
(Optional To compare utilization data over days or months, click the appropriate button for the amount of time desired (1d shows one day, 2d shows two days, and so on).
Displaying the Chassis Events
DCNM displays the chassis events, which includes the source, time, severity, message, and status of the event. You can display additional details for an event.
DETAILED STEPS
To display the chassis events, follow these steps:
Step 1 ![]() From the Feature Selector pane, choose Inventory.
From the Feature Selector pane, choose Inventory.
Summary information for each managed device appears in the Summary pane.
Step 2 ![]() From the Summary pane, click the device.
From the Summary pane, click the device.
Tabs appear in the Details pane.
Step 3 ![]() From the Details pane, click the Memory Utilization tab.
From the Details pane, click the Memory Utilization tab.
The Memory Utilization table appears.
Step 4 ![]() (Optional) To see details for the event, select the event in the Details pane and click the up arrow at the bottom of the details pane.
(Optional) To see details for the event, select the event in the Details pane and click the up arrow at the bottom of the details pane.
Displaying the Module Information
DCNM displays summary, detail, environmental, and event information for the supervisor modules, I/O modules, and fabric modules.
This section includes the following topics:
•![]() Displaying the Module Summary Information
Displaying the Module Summary Information
•![]() Displaying the Module Detail Information
Displaying the Module Detail Information
•![]() Displaying the Module Environmental Status
Displaying the Module Environmental Status
Displaying the Module Summary Information
DCNM displays the module summary information for each device it manages when you expand the device listing in the Summary pane. The summary information includes the module description, product ID, serial number, hardware version, software version, status, temperature, and events.
DETAILED STEPS
To display the summary information for a module, follow these steps:
Step 1 ![]() From the Feature Selector pane, choose Inventory.
From the Feature Selector pane, choose Inventory.
Chassis summary information for the device appears in the Summary pane.
Step 2 ![]() From the Summary pane, expand the device with the modules that you are interested in viewing.
From the Summary pane, expand the device with the modules that you are interested in viewing.
A list of modules, power supplies, and fan trays appears under the device in the Summary pane. Each line includes summary information for the component.
Displaying the Module Detail Information
DCNM displays the module detail information for the device that you choose in the Summary pane. This detail information includes general identification information and special information that applies to the the module type.
DETAILED STEPS
To display module detail information, follow these steps:
Step 1 ![]() From the Feature Selector pane, choose Inventory.
From the Feature Selector pane, choose Inventory.
Summary chassis information for each managed device appears in the Summary pane.
Step 2 ![]() From the Summary pane, click the device.
From the Summary pane, click the device.
Step 3 ![]() Expand the device.
Expand the device.
The device listing expands to include a summary of each module, power supply, and fan tray in the chassis.
Step 4 ![]() Click the module.
Click the module.
Tabs appear in the Details pane. General details appear in the Details tab.
Displaying the Module Environmental Status
DCNM displays the module environmental status information for the supervisor module, I/O module, or fabric module that you choose in the Summary pane. The environmental information includes power usage and temperature information.
DETAILED STEPS
To display the environmental status for a module, follow these steps:
Step 1 ![]() From the Feature Selector pane, choose Inventory.
From the Feature Selector pane, choose Inventory.
Summary chassis information for each managed device appears in the Summary pane.
Step 2 ![]() From the Summary pane, click the device.
From the Summary pane, click the device.
Step 3 ![]() Expand the device.
Expand the device.
The device listing expands to include a summary of each module, power supply, and fan tray in the chassis.
Step 4 ![]() Click the module.
Click the module.
Step 5 ![]() From the Details pane, click the Environmental Status tab.
From the Details pane, click the Environmental Status tab.
Power supply and temperature sections appear in the Details pane. The Power Supply section is expanded and the two temperature sections are not expanded
Step 6 ![]() (Optional) To see textual temperature information, expand the Temperature Status Table section.
(Optional) To see textual temperature information, expand the Temperature Status Table section.
Step 7 ![]() (Optional) To see graphical temperature information, expand the Temperature Status Thermometer section.
(Optional) To see graphical temperature information, expand the Temperature Status Thermometer section.
Displaying the Module Events
DCNM displays the module event information for the supervisor module, I/O module, or fabric module that you choose in the Summary pane. The events information includes source, time, severity, message, and status information for the event. You can display details for each event.
DETAILED STEPS
To display the events for a module, follow these steps:
Step 1 ![]() From the Feature Selector pane, choose Inventory.
From the Feature Selector pane, choose Inventory.
Summary chassis information for each managed device appears in the Summary pane.
Step 2 ![]() From the Summary pane, click the device.
From the Summary pane, click the device.
Step 3 ![]() Expand the device.
Expand the device.
The device listing expands to include a summary listing of each module, power supply, and fan tray in the chassis.
Step 4 ![]() Click the module.
Click the module.
Step 5 ![]() From the Details pane, click the Events tab.
From the Details pane, click the Events tab.
An events listing appears in the Details pane.
Step 6 ![]() (Optional) To see details for an event, click on the event and click the up arrow button at the bottom of the pane.
(Optional) To see details for an event, click on the event and click the up arrow button at the bottom of the pane.
Displaying the Power Supply Information
DCNM displays summary information, general details, and events for power supplies.
This section includes the following topics:
•![]() Displaying the Power Supply Summary Information
Displaying the Power Supply Summary Information
•![]() Displaying the Power Supply Detail Information
Displaying the Power Supply Detail Information
•![]() Displaying the Power Supply Events
Displaying the Power Supply Events
Displaying the Power Supply Summary Information
DCNM displays the power supply summary information for each device it manages when you expand the device listing in the Summary pane. The summary information includes the module description, product ID, serial number, hardware version, software version, status, temperature, and events.
DETAILED STEPS
To display the summary information for a power supply, follow these steps:
Step 1 ![]() From the Feature Selector pane, choose Inventory.
From the Feature Selector pane, choose Inventory.
Chassis summary information for the device appears in the Summary pane.
Step 2 ![]() From the Summary pane, click the device.
From the Summary pane, click the device.
Step 3 ![]() Expand the device with the modules that you are interested in viewing.
Expand the device with the modules that you are interested in viewing.
A list of modules, power supplies, and fan trays appears under the device in the Summary pane. Each line includes summary information for the component.
Displaying the Power Supply Detail Information
DCNM displays the power supply detail information for the device that you choose in the Summary pane. This detail information includes general identification information, power (watts), and current (Amps).
DETAILED STEPS
Step 1 ![]() From the Feature Selector pane, choose Inventory.
From the Feature Selector pane, choose Inventory.
Summary chassis information for each managed device appears in the Summary pane.
Step 2 ![]() From the Summary pane, click the device.
From the Summary pane, click the device.
Step 3 ![]() Expand the device.
Expand the device.
The device listing expands to include a summary of each module, power supply, and fan tray in the chassis.
Step 4 ![]() Click the power supply.
Click the power supply.
Tabs appear in the Details pane. General details appear in the Details tab.
Displaying the Power Supply Events
DCNM displays the event information for the power supply that you choose in the Summary pane. The events information includes source, time, severity, message, and status information for the events. You can display details for each event.
DETAILED STEPS
To display the events for a power supply, follow these steps:
Step 1 ![]() From the Feature Selector pane, choose Inventory.
From the Feature Selector pane, choose Inventory.
Summary chassis information for each managed device appears in the Summary pane.
Step 2 ![]() From the Summary pane, click the device.
From the Summary pane, click the device.
Step 3 ![]() Expand the device.
Expand the device.
The device listing expands to include a summary listing of each module, power supply, and fan tray in the chassis.
Step 4 ![]() Click the power supply.
Click the power supply.
Step 5 ![]() From the Details pane, click the Events tab.
From the Details pane, click the Events tab.
An events listing appears in the Details pane.
Step 6 ![]() (Optional) To see details for an event, click on the event and click the up arrow button at the bottom of the pane.
(Optional) To see details for an event, click on the event and click the up arrow button at the bottom of the pane.
A field opens to display detailed event information.
Displaying the Fan Tray Information
DCNM displays summary information, general details, and events for fan trays.
This section includes the following topics:
•![]() Displaying the Fan Tray Summary Information
Displaying the Fan Tray Summary Information
•![]() Displaying the Fan Tray Detail Information
Displaying the Fan Tray Detail Information
•![]() Displaying the Fan Tray Events
Displaying the Fan Tray Events
Displaying the Fan Tray Summary Information
DCNM displays the fan tray summary information for each device it manages when you expand the device listing in the Summary pane. The summary information includes the fan identification and status information.
DETAILED STEPS
To display the summary information for a fan tray, follow these steps:
Step 1 ![]() From the Feature Selector pane, choose Inventory.
From the Feature Selector pane, choose Inventory.
Chassis summary information for the device appears in the Summary pane.
Step 2 ![]() From the Summary pane, click the device.
From the Summary pane, click the device.
Step 3 ![]() Expand the device with the fan tray that you are interested in viewing.
Expand the device with the fan tray that you are interested in viewing.
A list of modules, power supplies, and fan trays appears under the device in the Summary pane. Each line includes summary information for the component.
Displaying the Fan Tray Detail Information
DCNM displays the fan tray detail information for the device that you choose in the Summary pane. This detail information includes descriptive information and status for the fan tray.
DETAILED STEPS
Step 1 ![]() From the Feature Selector pane, choose Inventory.
From the Feature Selector pane, choose Inventory.
Summary chassis information for each managed device appears in the Summary pane.
Step 2 ![]() From the Summary pane, click the device.
From the Summary pane, click the device.
Step 3 ![]() Expand the device.
Expand the device.
The device listing expands to include a summary of each module, power supply, and fan tray in the chassis.
Step 4 ![]() Click the fan tray.
Click the fan tray.
Tabs appear in the Details pane. General details appear in the Details tab.
Displaying the Fan Tray Events
DCNM displays the event information for the fan tray that you choose in the Summary pane. The events information includes source, time, severity, message, and status information for the event. You can display details for each event.
DETAILED STEPS
To display the events for a fan tray, follow these steps:
Step 1 ![]() From the Feature Selector pane, choose Inventory.
From the Feature Selector pane, choose Inventory.
Summary chassis information for each managed device appears in the Summary pane.
Step 2 ![]() From the Summary pane, click the device.
From the Summary pane, click the device.
Step 3 ![]() Expand the device.
Expand the device.
The device listing expands to include a summary listing of each module, power supply, and fan tray in the chassis.
Step 4 ![]() Click the fan tray.
Click the fan tray.
Step 5 ![]() From the Details pane, click the Events tab.
From the Details pane, click the Events tab.
An events listing appears in the Details pane.
Step 6 ![]() (Optional) To see details for an event, click on the event and click the up arrow button at the bottom of the pane.
(Optional) To see details for an event, click on the event and click the up arrow button at the bottom of the pane.
Feature History for Inventory
Table 11-1 lists the release history for this feature.
|
|
|
|
|---|---|---|
Inventory |
4.1(2) |
No change from Release 4.0 |
 Feedback