Cisco DRaaS with Zerto Virtual Replication and VMware Virtual SAN Book
Bias-Free Language
The documentation set for this product strives to use bias-free language. For the purposes of this documentation set, bias-free is defined as language that does not imply discrimination based on age, disability, gender, racial identity, ethnic identity, sexual orientation, socioeconomic status, and intersectionality. Exceptions may be present in the documentation due to language that is hardcoded in the user interfaces of the product software, language used based on RFP documentation, or language that is used by a referenced third-party product. Learn more about how Cisco is using Inclusive Language.
- Updated:
- July 28, 2014
Chapter: Architecture Configuration
- VMDC VSA 1.0 System Architecture
- Cisco UCS
- VMware Virtual SAN
- DRaaS Application Suite
Architecture Configuration
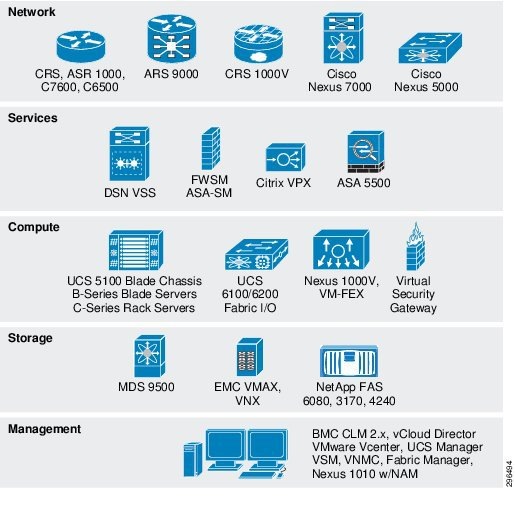
The Cisco DRaaS 2.0 solution is layered on top of the Cisco VMDC VSA 1.0Figure 4-1. Though all of these functional layers were necessarily a part of the architecture for this project, not all of the components shown were in play.
Figure 4-1 Functional Layers Within the VMDC Data Center
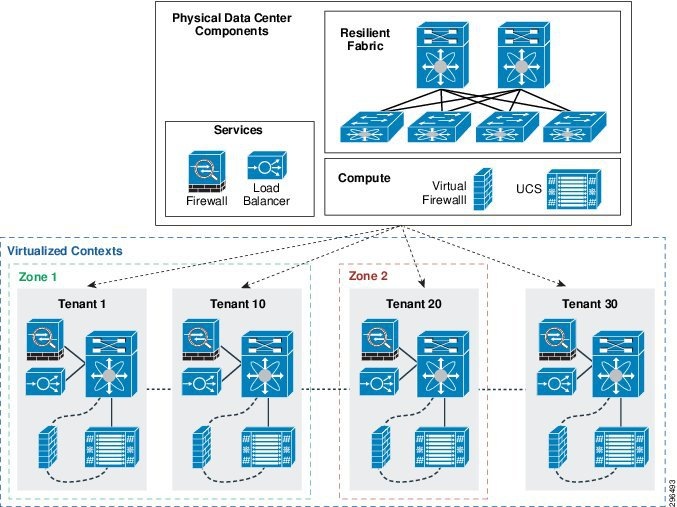
The basic tenancy model is illustrated in Figure 4-2. It consists of a network fabric (Layer 2 & 3 switching), Layer 4-7 services (firewall and load balancing, e.g.), and compute. From this infrastructure, multiple virtualized contexts—tenants—are logically created.
Figure 4-2 Multitenancy Design
VMDC VSA 1.0 System Architecture
There are various tenant container models available, validated, and supported in the VSA 1.0 architecture, which are differentiated by the services that they provide to the individual tenants. Figure 4-3 provides an overview of these tenant container models. For this project, the Bronze Container model was used at the SP site to provide tenancy to the Enterprise customer. The details of the Bronze Container model are illustrated in Figure 4-4.
Figure 4-3 VMDC VSA 1.0 Container Models

Figure 4-4 VMDC VSA 1.0 Bronze Container Model
Additional Resources
For additional information on the Cisco VMDC program, including summaries, overviews, and white papers, see the following link:
- h ttp://www.cisco.com/go/vmdc
For information on the Cisco VMDC VSA 1.0 architecture design specifically, see this link:
Cisco UCS
Each of the three C240-M3S hosts used in this project as Virtual SAN cluster nodes were configured identically. Each was equipped with the following hardware:
- Dual Intel 2.60 GHz 6-core processors
- 256GB RAM
- Four 1 TB SATA 7200 RPM magnetic drives
- One 400 GB enterprise-class SAS SSD
- Cisco VIC 1225 PCI-E adapter
- MegaRAID controller
Each UCS C240-M3S was connected to upstream to a pair of UCS 6248UP fabric interconnects which were connected, in turn, to a pair of Nexus 5548UP switches. Six vNICs were configured for each host, as follows:
- Data/Inband —Two vNICs were configured to carry the data VLANs necessary for this project
- Management/OOB —Two vNICs were configured to carry management traffic, not including vMotion or Virtual SAN control/data traffic
- vMotion —One vNIC was dedicated to vMotion operations, with a corresponding VMkernel NIC configured as well
- Virtual SAN —One vNIC was dedicated to Virtual SAN control and data traffic, with a VMkernel NIC to match
Hardware and Software
Table 4-1 provides a list of the hardware used for this project. Each of the three Virtual SAN cluster nodes was identical to this configuration.
|
|
|||
|---|---|---|---|
MegaRAID 9271CV with 8 internal SAS/SATA ports with Supercap |
|||
Table 4-2 provides a summary of UCS components with the software versions in use during this project:
Service Profile Configuration
As discussed elsewhere in this paper, service profile templates assist the compute administrator by allowing for the deployment of multiple physical servers from a single configuration file. A single service profile template was built and used to deploy the three UCS C240 Virtual SAN cluster nodes used in this project. Some of the select settings used to build the service profile are summarized in Table 4-3 .
|
|
|
|
|
|---|---|---|---|
| 2: SD Card 2 |
|
2.For this project, the VMware ESXi hypervisor image was booted from the on-board SD card. For information on SAN booting the UCS C240, see the Cisco DRaaS 2.0 Implementation Guide. |
VMware Virtual SAN
The documentation below covers the administratively-defined aspects of deploying a Virtual SAN datastore.
Host Networking
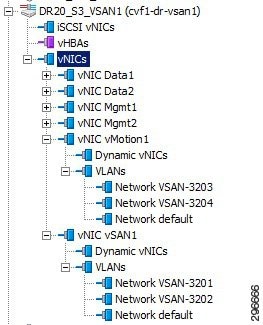
The three UCS C240-M3S hosts were deployed using UCS Manager with six vNICs. The six vNICs were configured to carry various VLANs, as shown in Table 4-4 . Figure 4-5 shows the vNICs that were configured to carry Virtual SAN and vMotion traffic.

Note![]() The vNICs in listed in the table carried, in practice, many more VLANs than are shown as the hosts were deployed in a test environment with the potential to be used for other testing. The VLANs shown in The vNICs in listed in the table carried, in practice, many more VLANs than are shown as the hosts were deployed in a test environment with the potential to be used for other testing. The VLANs shown in Table 4-4 are limited to those relevant to this project.
The vNICs in listed in the table carried, in practice, many more VLANs than are shown as the hosts were deployed in a test environment with the potential to be used for other testing. The VLANs shown in The vNICs in listed in the table carried, in practice, many more VLANs than are shown as the hosts were deployed in a test environment with the potential to be used for other testing. The VLANs shown in Table 4-4 are limited to those relevant to this project.
Figure 4-5 UCS Host vNIC VLAN Configuration
For Virtual SAN networking to be established, Virtual SAN needs to be enabled on an existing or a new VMkernel NIC (VMKNIC). To keep the Virtual SAN service separate from other services, a dedicated VMKNIC was configured with only Virtual SAN enabled, as shown in Figure 4-6.
Figure 4-6 Virtual SAN VMkernel Configuration
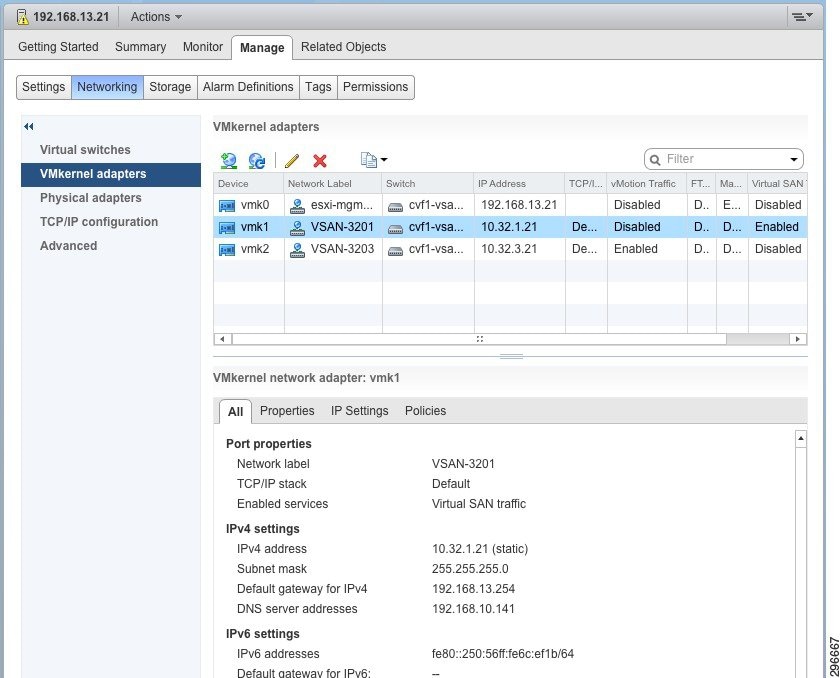
The subnet chosen for Virtual SAN communication was 10.32.1.0/24, and the ESXi VMKNICs were assigned IP addresses according to Table 4-5 .
|
|
|
|
|
|
|
|
|---|---|---|---|---|---|---|
Disk Group Creation
Each of the three UCS C240-M3S hosts used in this Virtual SAN cluster had one SSD and four MDs (Magnetic Disks) and each host was configured with a single disk group. The SSD was 400GB while the MDs were 1TB each. Thus the total MD data capacity was 4TB. The ratio of SSD:MD capacity was 1:10, which is aligned with VMware Virtual SAN recommendations.
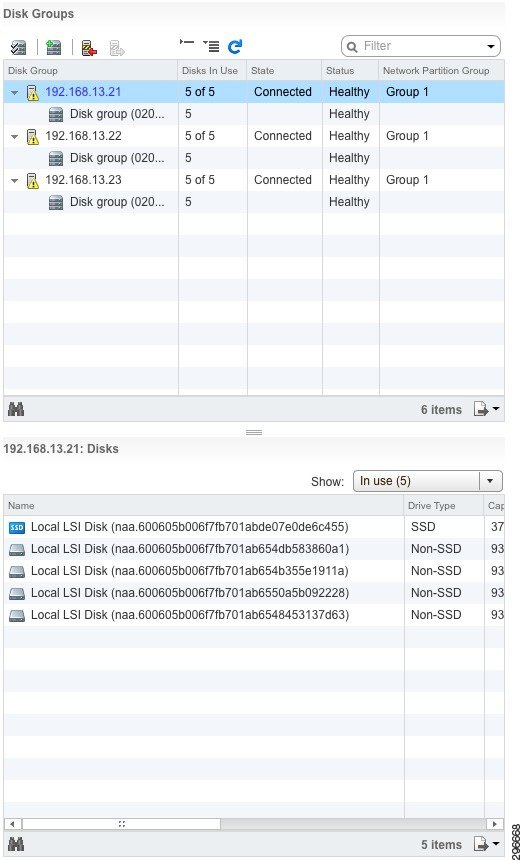
Figure 4-7 is a screenshot of the Virtual SAN disk group configuration. We can see from the vSphere web client that each ESXi host has one disk group and five disks. Each host belongs to Network Partition Group 1, indicating that all hosts are communicating on the Virtual SAN network. We can also see that in one of those disk groups (host 192.168.13.21) there are indeed four MDs for data and one SSD for cache.
Figure 4-7 Virtual SAN Disk Group Verification
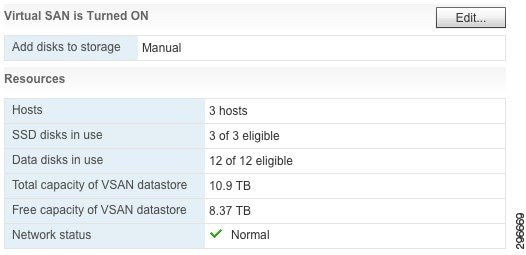
In the summary view in Figure 4-8, we can see that all 12 data disks are in use (four from each host) and the total capacity of the datastore is 10.9 TB.
Figure 4-8 Virtual SAN Resources Summary
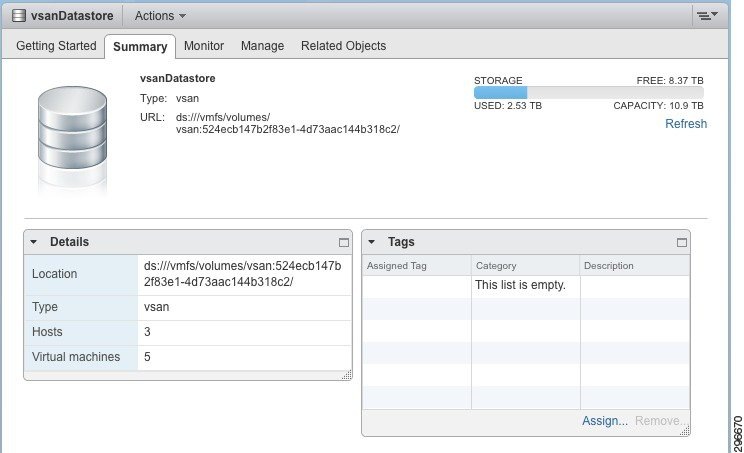
From the Summary view of the Virtual SAN datastore, we can also see the 10.9 TB capacity available as well as other specifics for the datastore (Figure 4-9).
Figure 4-9 Virtual SAN Datastore Summary
Policy Configuration
For this project, all of the default VM Storage Policy settings described in Table 4-5 were used. For clarification, Table 4-6 summarizes these settings. These settings are also the VMware recommendations as of this writing.
|
|
|
|---|---|
DRaaS Application Suite
The DRaaS application suite entails VM deployment on a virtual SAN data store for enterprise and SP data center configurations.
Implementation and Configuration of Zerto Virtual Replication
To verify the DRaaS 2.0 system architecture, a lab topology with two CSP sites and eight enterprise customer sites was configured. DRaaS was tested with the first four enterprises and ICDR was tested with the remaining four enterprises.
The DRaaS enterprises connected into the first provider site using OTV with CSR 1000V routers at each end. The OTV link carried both tenant traffic and Zerto control plane and replication traffic. The ICDR enterprises connected into the first provider site using OTV and had an OTV link between the provider sites for their tenant networks. For Zerto control plane and replication traffic between provider sites, native IP links and L3 routing were configured. These links allowed the following communication:
- CSP ZCM CSP/enterprise ZVMs
- CSP ZVM CSP/enterprise ZVM
- CSP VRA CSP/enterprise VRA (replication traffic)
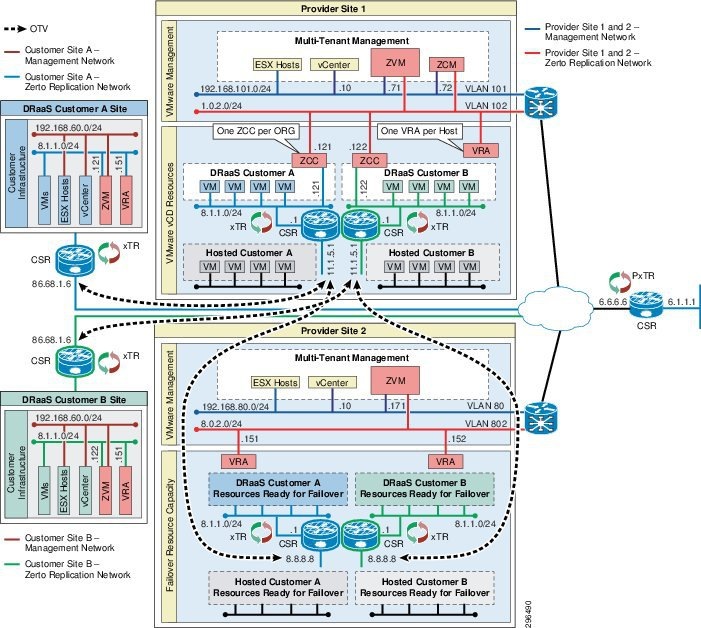
Figure 4-10 shows the complete installation where the CSP is providing both DRaaS and ICDR within the same core ZVR environment. The CSP has two data centers with available resources. Each site has a Zerto Virtual Manager (ZVM) installed and VRAs for every ESX/ESXi host and the ZVMs are connected to the ZCM.
In the lab topology, each enterprise-to-CSP and CSP-to-CSP OTV link carried three VLANs, one for each tier of the three tier applications (e.g., web servers, application servers, database servers) that resided in each tenant. For the enterprise-to-CSP OTV link, the Zerto control and replication traffic was sent across the first VLAN, which was for the web servers. For the CSP-to-CSP link, the Zerto control and replication traffic was sent across a native IP link between sites that was outside of the customer OTV links. The OTV links between the CSP sites carried customer three-tier traffic only.
Figure 4-10 DRaaS 2.0 Test Topology—Diagram (DRAFT ILLO)
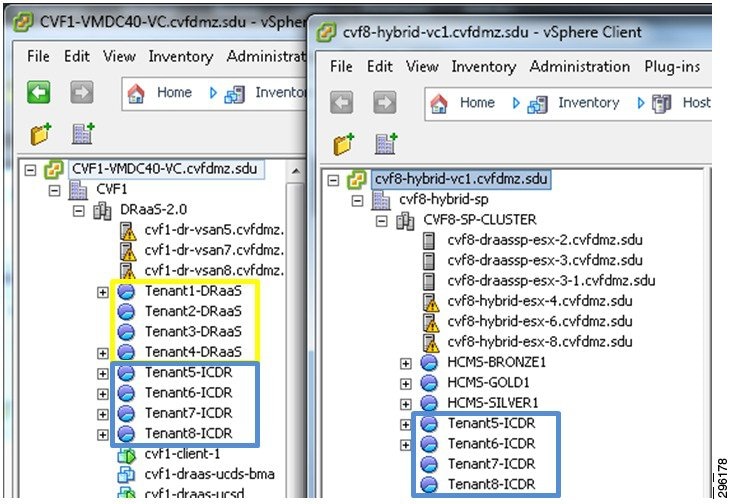
In the lab topology, each customer was assigned a unique resource pool in the CSP sites to help organize the customers’ VMs under the data center. The DRaaS customers only require a single resource pool in the main provider site (e.g. CVF1), since they will only be using that site, while the ICDR customers require a resource pool in each site, since the protected VMs hosted in the primary site (e.g. CVF1) will be recovered to the second provider site (e.g. CVF8).
Figure 4-11 DRaaS 2.0 Test Topology - CSP Resource Pools
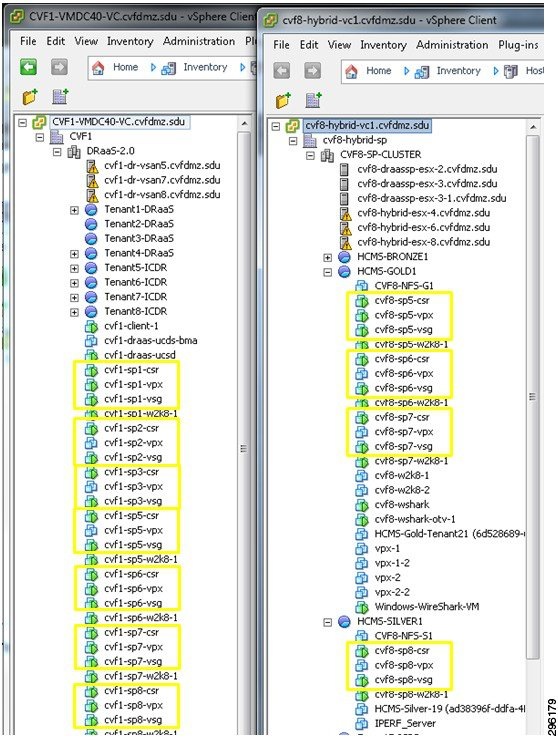
At the primary CSP site (left half of Figure 4-11), a CSR 1000V, Virtual Service Gateway (VSG), and Citrix VPX were deployed for each customer. At the secondary CSP site (right half of Figure 4-11), these components were only deployed for the ICDR customers.
Figure 4-12 DRaaS 2.0 Test Topology—CSP Infrastructure
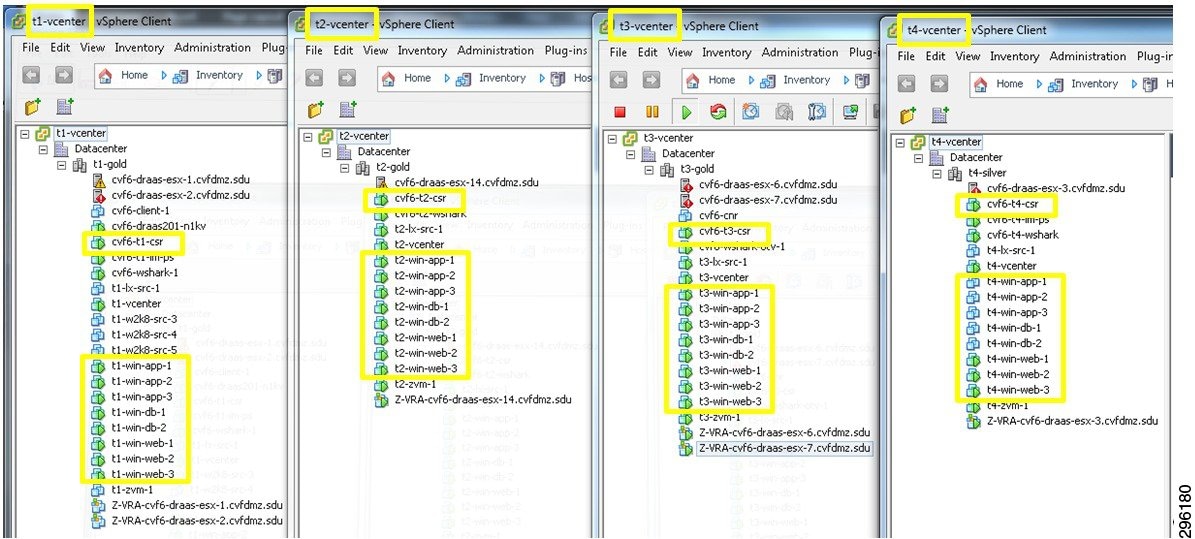
Each customer site included one or two ESXi hosts, a CSR 1000V, and eight servers for a three-tier application. The three-tier application consisted of three web servers, three application servers, and two database servers. These were the VMs that were protected by Zerto into the primary CSP site.
Figure 4-13 DRaaS 2.0 Test Topology—DRaaS Customer Sites
The lab topology was built using Zerto Virtual Replication release 3.1 Update 2 (Build 031027034).
Note Each Zerto Virtual Replication release includes a number of guides, pre-installation checklists, and tools to help with the planning, installation, and initial configuration, such as:
- Design considerations for DRaaS/ICDR.
- Resource requirements for the various components (e.g., ZVM, ZCM, ZCC, VRA).
- Network considerations (e.g., types of networks, ports used, and WAN sizing tool).
- Recommended best practices.
- Install/configuration/administrative guides for ZVM, ZCM, ZCC, and VRA.
The information in this section includes a subset of that content with some additional discussions pertaining to the specific architecture used in the lab topology. For general installation, configuration, and administration information, the Zerto documentation should be referenced.
Implementing Zerto Virtual Replication at the Cloud Service Provider
A CSP can offer both DRaaS and ICDR with the same Zerto components. The initial configuration of the ZVR involves the following tasks at the cloud sites:
- Licensing the use of Zerto Virtual Replication.
- Install Zerto Virtual Manager at each site.
- Install Zerto Virtual Replication Appliances (VRA) on each ESXi host.
- Set up vCloud Director, if it is being used.
- Set up static routes, if needed to enable connectivity between sites or components.
- Install Zerto Cloud Manager and configure the following:
–![]() Cloud sites providing DR capabilities.
Cloud sites providing DR capabilities.
–![]() Organizations using the cloud DR services, either DRaaS or ICDR. For DRaaS organizations, deploy Zerto Cloud Connector.
Organizations using the cloud DR services, either DRaaS or ICDR. For DRaaS organizations, deploy Zerto Cloud Connector.
–![]() Service profiles, which are templates for protection.
Service profiles, which are templates for protection.
Note A detailed review of the Zerto Virtual Replication installation is covered in Appendix D of the Cisco DRaaS 2.0 Implementation Guide, available at the following URL: http://www.cisco.com/go/draas.
Implementing Zerto Virtual Replication at the Customer Site
Once the core service environment is built, DRaaS and ICDR customer organizations can set up their sites. The customer setup involves installing only a ZVM and VRAs and then pairing to the CSP. The Zerto components used and the on-boarding processes are the same for either DRaaS or ICDR, therefore reducing the administrative overhead for the CSP.
DRaaS organizations can manage their disaster recovery via the Zerto UI, either via vSphere Client console or the Zerto standalone web UI. ICDR organizations can use the Zerto Self Service Portal (ZSSP), a stand-alone, limited access customer portal with limited functionality enabled by the CSP. In both cases the CSP can restrict the operations available to the organization, such as whether the organization can initiate a failover or test of protected virtual machines, by setting permissions for the organization in ZCM.
Steps Required for Zerto Virtual Replication (DRaaS Customers)
The initial configuration of the ZVR for DRaaS customers requires execution of some of the same tasks already executed at the CSP sites. The following tasks must be executed at the customer sites:
- Install Zerto Virtual Manager at each site.
- Licensing the use of Zerto Virtual Replication by pointing to CSP ZVM (via ZCC).
- Install Zerto Virtual Replication Appliances (VRA) on each ESXi host.
- If required, modify the MTU and disable TSO/LRO on the VRA.
- Create Virtual Protection Groups (VPGs) to establish protection via local ZVM UI.
Steps Required for Zerto Virtual Replication (ICDR Customers)
Since the CSP has already installed and configured all of the Zerto components required for In-Cloud Disaster Recovery, the ICDR customers only have to execute the following task:
Creating a Virtual Protection Group (VPG)
Virtual machines are protected in virtual protection groups (VPG). A VPG is a group of VMs that are grouped together for replication purposes. For example, the VMs that comprise an application like Microsoft Exchange, where one VMs is used for the software, one for the database and a third for the web server, require that all three VMs are replicated to maintain data integrity.
Once a VM is protected, all changes made on the machine are replicated in the remote site. The initial synchronization between the protected site and remote site takes time, depending on the size of the VM, but after this only the writes to disk from the VM in the protected site are sent to the remote site. These writes are stored by the VRA in the remote site in a journal for a specified period, after which, the old writes are promoted to the mirror virtual disk managed by the VRA.
The CSP should determine the RPO and RTO goals from the customer. While ZVR will meet even the most aggressive requirements, the CSP should be aware that the customer needs to specify which one is more important, in relative terms.
The number of VPGs directly impacts the RTO due to a feature in ZVR that protects the vCenter from being overwhelmed in case of a complete site failover. If the customer needs to fail over several VPGs at once, ZVR considers it a bulk operation and reduces the number of simultaneous volumes per VPG created. While this protects the vCenter from being overloaded, it adds to the recovery time. It is important to note that every environment is unique and there are tools available from Zerto and Cisco that will assist in the design planning, but as a general guideline, there are expected characteristics for failover times.
If the customer requirement has an RPO priority:
- VPGs can be created to reflect the application affinity groupings.
- Larger VPGs can be created for administrative ease of use.
If the customer requirement has an RTO priority:
- Fewer VPGs will recover relatively quicker than more VPGs in the case of a simultaneous failover of multiple VPGs.
- There are other considerations to keep in mind when designing VPGs, such as application affinity grouping write-order fidelity.
Note![]() VPGs can have dozens of VMs in them, with no actual limit on the number of VMs per VPG, but other factors, such as application affinity grouping requirements, usually keep the number of VMs in a VPG to fewer than 50. VPGs can have dozens of VMs in them, with no actual limit on the number of VMs per VPG, but other factors, such as application affinity grouping requirements, usually keep the number of VMs in a VPG to fewer than 50.
VPGs can have dozens of VMs in them, with no actual limit on the number of VMs per VPG, but other factors, such as application affinity grouping requirements, usually keep the number of VMs in a VPG to fewer than 50. VPGs can have dozens of VMs in them, with no actual limit on the number of VMs per VPG, but other factors, such as application affinity grouping requirements, usually keep the number of VMs in a VPG to fewer than 50.
Configuring Virtual Protection Groups
The VPG must include at least one VM. After creating a VPG, you can add more VMs later. The protected VMs can be defined under a single ESX/ESXi host or under multiple ESX/ESXi hosts. The recovery VMs can also be on a single ESX/ESXi host or multiple ESX/ESXi hosts. The VMs are also recovered with the same configuration as the protected machines. For example, if a VM in the protected site is configured so that space is allocated on demand (thin provisioning) and this machine is protected in a VPG, then during recovery the machine is defined in the recovery site as thin provisioned.
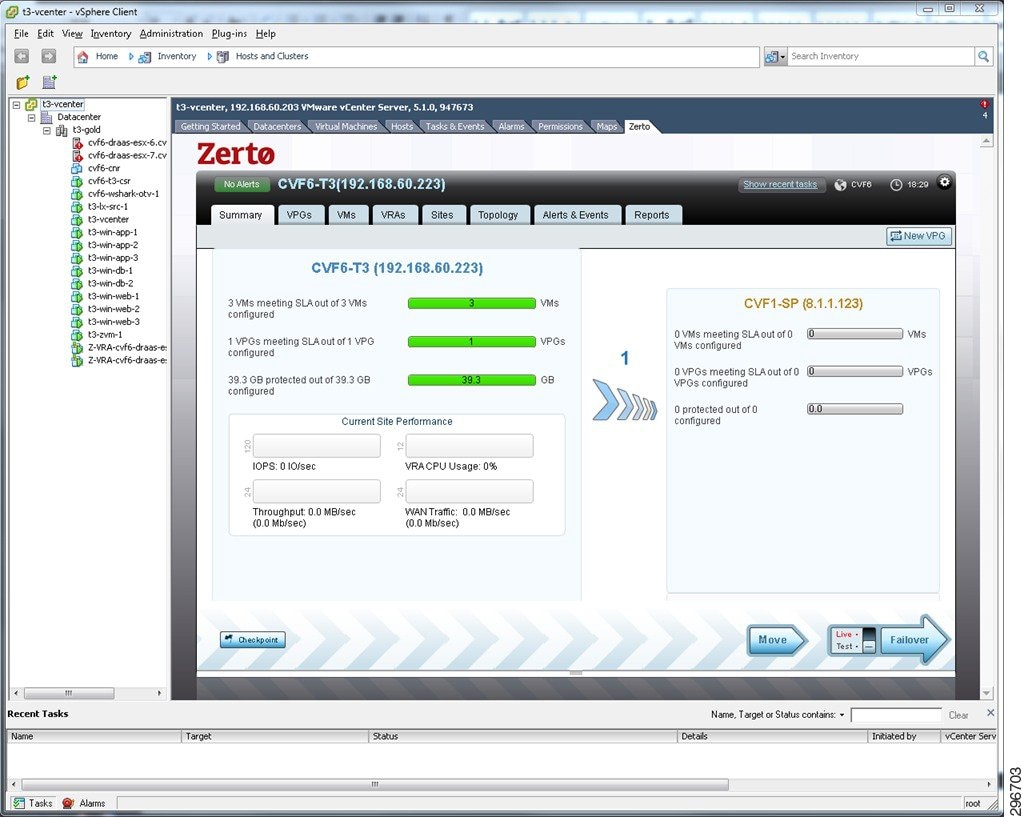
For DRaaS, a new VPG can be created from the ZVM UI on the enterprise or CSP sites. For ICDR, a new VPG can be created from the ZSSP UI or ZVM UI in the CSP site. From the ZVM UI, the New VPG button is located in the upper right corner of most tabs in the UI.
Figure 4-14 New VPG Button in ZVM UI
Note![]() A detailed review of the procedure for implementing Zerto Virtual Replication at the customer site—including the Virtual Protection Groups—is covered in Appendix D of the Cisco DRaaS 2.0 Implementation Guide, available at the following URL: A detailed review of the procedure for implementing Zerto Virtual Replication at the customer site—including the Virtual Protection Groups—is covered in Appendix D of the Cisco DRaaS 2.0 Implementation Guide, available at the following URL: http://www.cisco.com/go/draas.
A detailed review of the procedure for implementing Zerto Virtual Replication at the customer site—including the Virtual Protection Groups—is covered in Appendix D of the Cisco DRaaS 2.0 Implementation Guide, available at the following URL: A detailed review of the procedure for implementing Zerto Virtual Replication at the customer site—including the Virtual Protection Groups—is covered in Appendix D of the Cisco DRaaS 2.0 Implementation Guide, available at the following URL: http://www.cisco.com/go/draas.
Deploying Application VMs on the Virtual SAN Datastore
In the CSP site, with VMware Virtual SAN providing the storage, all of the VMs needed for the Zerto application were deployed on the Virtual SAN cluster. For the sake of summary, here are the specifics of the Virtual SAN configuration once again:
- Three ESXi hosts running version 5.5
- Virtual SAN datastore made of twelve 1 TB spindles and three 400 GB SSDs
- A total datastore capacity of 12.3 TB (raw).
- Virtual SAN default policies set, including StripeWidth of 1 and FailuresToTolerate of 1.
- VMware Distributed Resource Scheduler (DRS) functionality enabled and configured for Automatic.
- VMware High Availability (HA) feature disabled.
Note![]() VMware HA is certainly an option for Virtual SAN deployments. It was not used in this project due to the inherent resiliency that Virtual SAN provides and the fact that the project environment was limited to three nodes. In a four-node Virtual SAN cluster, HA would be a suitable choice. VMware HA is certainly an option for Virtual SAN deployments. It was not used in this project due to the inherent resiliency that Virtual SAN provides and the fact that the project environment was limited to three nodes. In a four-node Virtual SAN cluster, HA would be a suitable choice.
VMware HA is certainly an option for Virtual SAN deployments. It was not used in this project due to the inherent resiliency that Virtual SAN provides and the fact that the project environment was limited to three nodes. In a four-node Virtual SAN cluster, HA would be a suitable choice. VMware HA is certainly an option for Virtual SAN deployments. It was not used in this project due to the inherent resiliency that Virtual SAN provides and the fact that the project environment was limited to three nodes. In a four-node Virtual SAN cluster, HA would be a suitable choice.
Virtual SAN Component Distribution
In Chapter 2 we looked at how Virtual SAN created distributed RAID trees for the VM storage objects that it manages. Figure 4-15 provided a hypothetical look at how those objects and their subcomponents might be distributed on a 5-node Virtual SAN cluster. Figure 4-12 below looks at one of the VMs deployed on the 3-node Virtual SAN cluster used at the CSP site in this project. Because this VM was powered down at the time of this test, there is no SWAP file. Nor had any snapshots been taken of this VM. Therefore, the only storage objects belonging to this VM were the Namespace and the VMDK Disk.
Figure 4-15 Virtual SAN Distributed RAID Tree, FTT=1 and StripeWidth=1
With StripeWidth=1, there is no striping across spindles; Each duplicate of the Virtual SAN object is written to a single MD. In the illustration above, then, each object has a single RAID-1 group, consisting of two copies of the object data, the Comp(onent) in the illustration. One of those data copies is active, depicted in yellow in the illustration. Each object has a single witness in this scenario, to arbitrate potential active-active conflicts.
If this VM were powered on, there would be an additional RAID-1 object for swap. If snapshots had been taken of this VM, there would be additional RAID-1 objects for each of the delta disks, one per snapshot.
Using the Ruby vSphere Console (RVC) Virtual SAN commands, we can see the structure of the RAID tree and the distribution of these components across hosts and MDs. The vsan.vm_object_info command was used to explore the structure of the storage objects belonging to a VM called “NewVM” which was powered off with no snapshots.
The Namespace and Disk objects have been highlighted (boldface) for clarity. Each of these objects has a RAID tree consisting of RAID-1 duplication of data as components. The output from this RVC command provides information on which MDs the components are written to, which host “owns” the storage object, where the witnesses exist, what the relevant policies are (notice hostFailuresToTolerate values in the output, and the SSDs that are front-ending the I/O for each disk for a particular component.
Note![]() One piece of information this command does not reveal is which of the object’s duplicates are actually active and used by the VM. For this information, use the One piece of information this command does not reveal is which of the object’s duplicates are actually active and used by the VM. For this information, use the vsan.disk_object_info disk_uuid command, which is referenced below in the Virtual SAN Troubleshooting section. This command will return all VMs and objects, using asterisks (**) to signify the active components.
One piece of information this command does not reveal is which of the object’s duplicates are actually active and used by the VM. For this information, use the One piece of information this command does not reveal is which of the object’s duplicates are actually active and used by the VM. For this information, use the vsan.disk_object_info disk_uuid command, which is referenced below in the Virtual SAN Troubleshooting section. This command will return all VMs and objects, using asterisks (**) to signify the active components.
Another way to view this output is to place it in a table showing the components, the RAID sets, and the hosts on which they reside. Table 4-7 gives such a view for the VMDK Disk object.
|
|
|
|
|
|
|---|---|---|---|---|
Using Table 4-7 , we can evaluate the witness component placement in light of the witness deployment rules covered in Chapter 2. When the witness calculation—based on those three rules—is performed in this scenario, the witness logic comes into play as below:
Primary Witnesses— The data components are spread over only 2 nodes (which is not greater than 2*FTT+1), so we need to deploy a primary witness on the excluded node to achieve 2*FTT+1.
Secondary Witnesses —With the addition of the Primary Witness, each node now has one component and equal voting power, so no Secondary Witnesses are needed.
Tiebreaker Witness —With the addition of the Primary Witness, there already an odd number of total components, so no Tiebreaker Witness is needed.
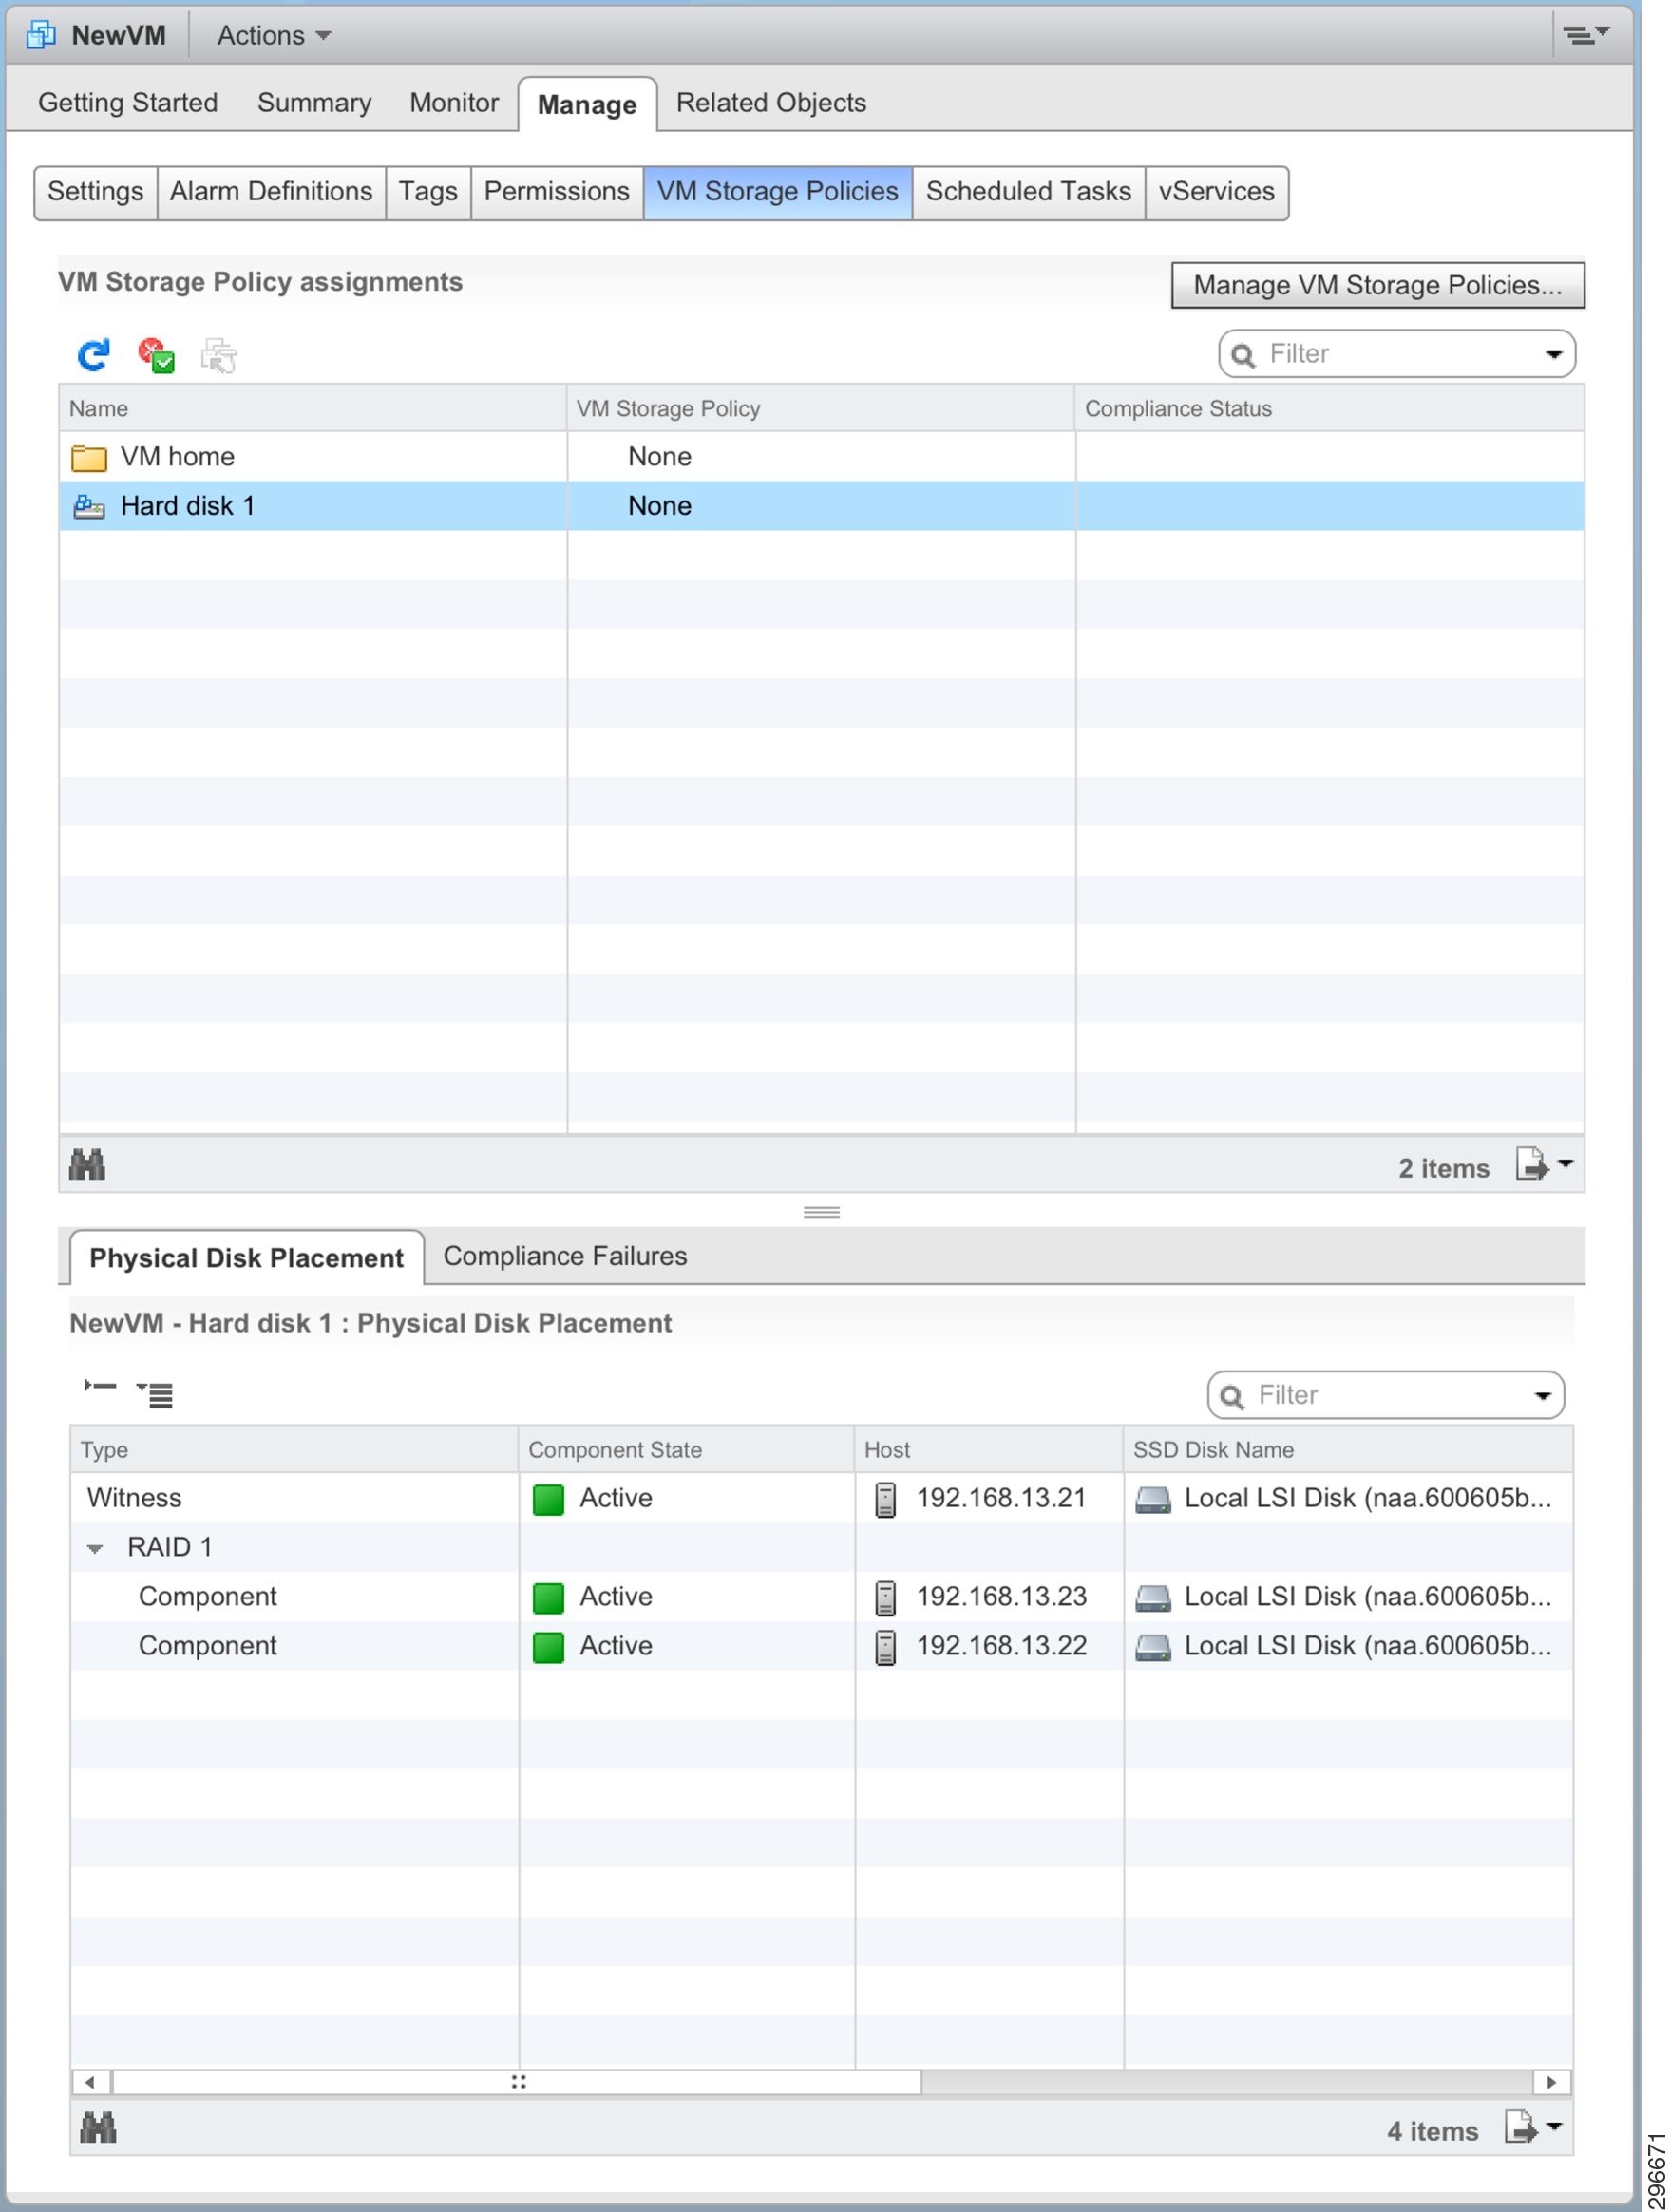
Through the vSphere web client, we can see the RAID tree by exploring the VM, and drilling down into Manage > VM Storage Policies , as in Figure 4-16. Here, for the VMDK Disk object, we see the RAID tree with the data object duplicated across two hosts (written to a single disk in each).
Figure 4-16 vSphere Web Client VM Storage Object View
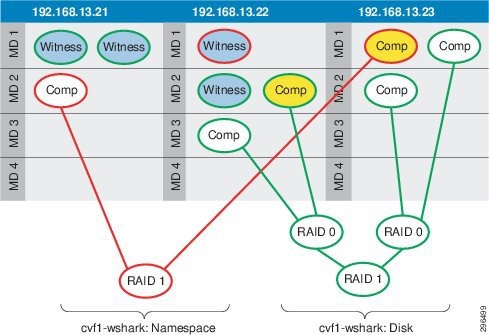
For the sake of further explanation and demonstration, the StripeWidth policy was set to “2” for this VM. The object scheme shown in Figure 4-17 is the resultant layout for the new RAID tree.
Figure 4-17 Virtual SAN Distributed RAID Tree, FTT=1 and StripeWidth=2
There are several key changes to take notice of, including:
- The Namespace RAID tree has not changed in character. It is still being handled as if StripeWidth=1. As mentioned in Chapter 2 above, the namespace and delta-disk objects will retain this striping policy regardless of what the administrator configures. This is because these objects are not performance limited and do not really benefit from having data striped across multiple spindles.
- The Disk (VMDK) RAID tree now includes two RAID-0 “branches” to handle the component striping across the spindles. Each component—the duplicate of the VMDK disk data—that had previously been written to a single MD is now written across two MDs.
- The VMDK Disk data is striped across MDs belonging to the same host. It is possible, with Virtual SAN, for striping to happen between MDs on different hosts as well.
- There are now three witnesses for the VMDK Disk object, due to the striping and MD distribution.
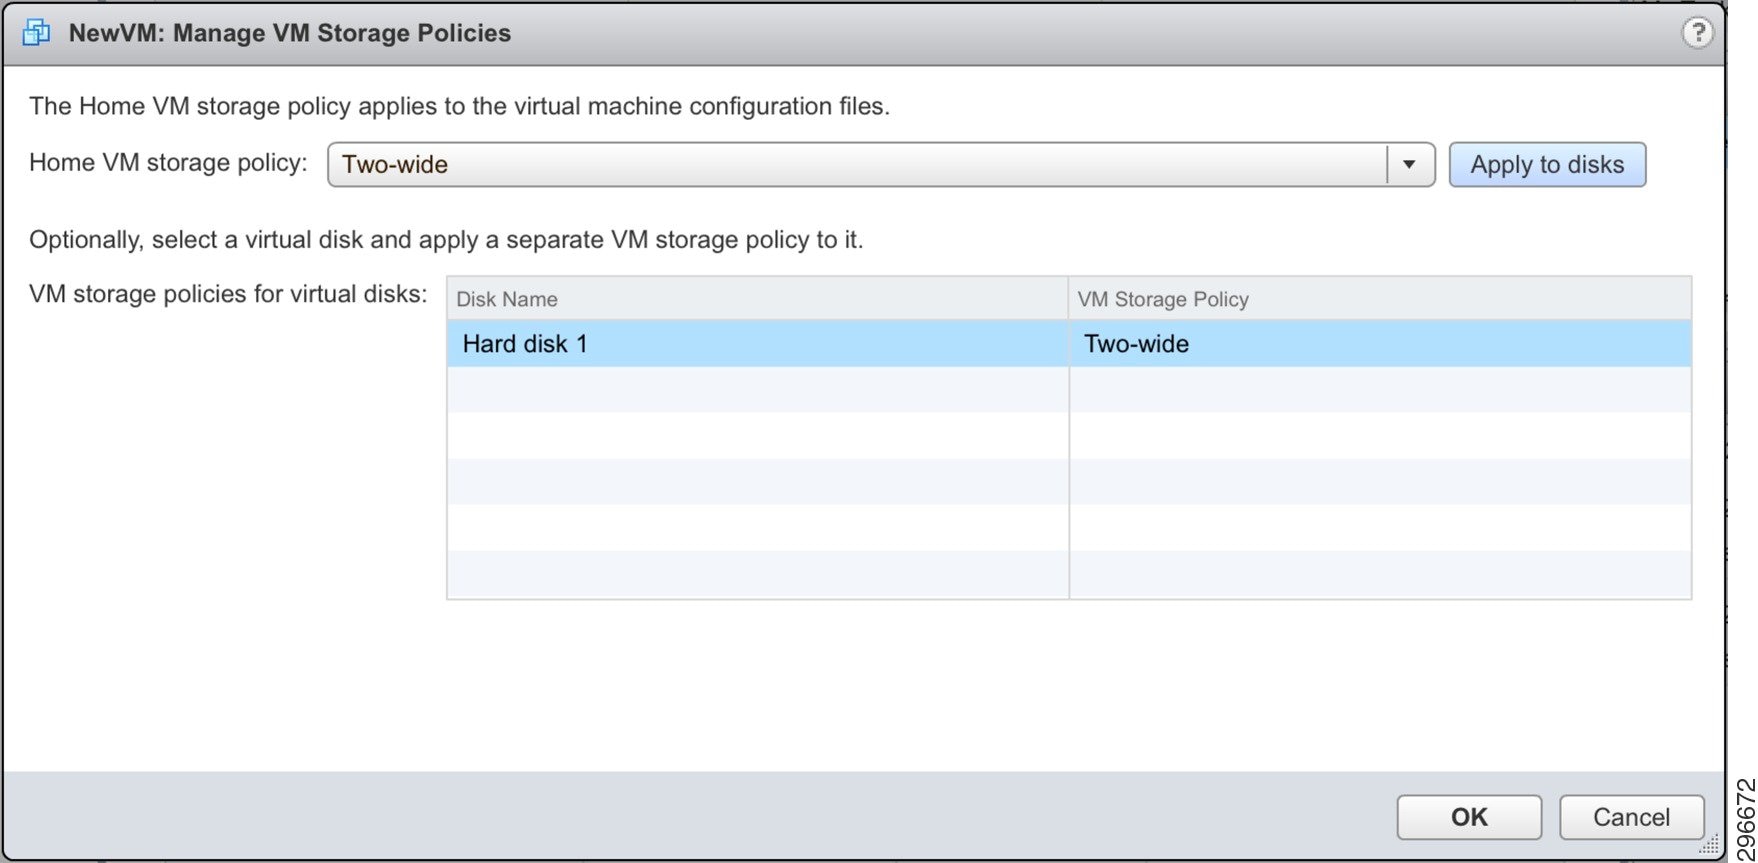
For our “NewVM,” we created a new storage policy with FailuresToTolerate=1 and StripeWidth=2 and applied it as shown in Figure 4-18.
Figure 4-18 Applying a StripeWidth=2 Policy to an Existing VM
The RVC command output following this change is below, for comparison to the output above where the striping was set to 1. Notice that the RAID tree hasn’t changed shape for the Namespace object, for the reasons explained above. Notice also that the VMDK Disk object now has the RAID-1 group split into two RAID-0 branches, with the components striped across multiple spindles (across multiple hosts in one case).
Again, populating a table with the output data for the VMDK Disk object can provide greater clarity, as in Table 4-8 .
|
|
|
|
|
|
|
Using Table 4-8 , we can again evaluate the witness component placement in light of the witness deployment rules covered in Chapter 2. When the witness calculation—based on those three rules—is performed in this scenario, the witness logic comes into play as below:
Primary Witnesses —The data components are spread over all 3 nodes (which is equal to 2*FTT+1), so no primary witnesses are needed.
Secondary Witnesses —Since one node (.21) has two votes and the other two nodes only have one vote each, we need to add a Secondary Witness on each of the other two nodes (.22 and .23).
Tiebreaker Witness —With the addition of the two Secondary Witnesses, the total component is 6 (4 data + 2 witnesses). There is an even number of total components, so a Tiebreaker Witness is needed and added on the .22 host.
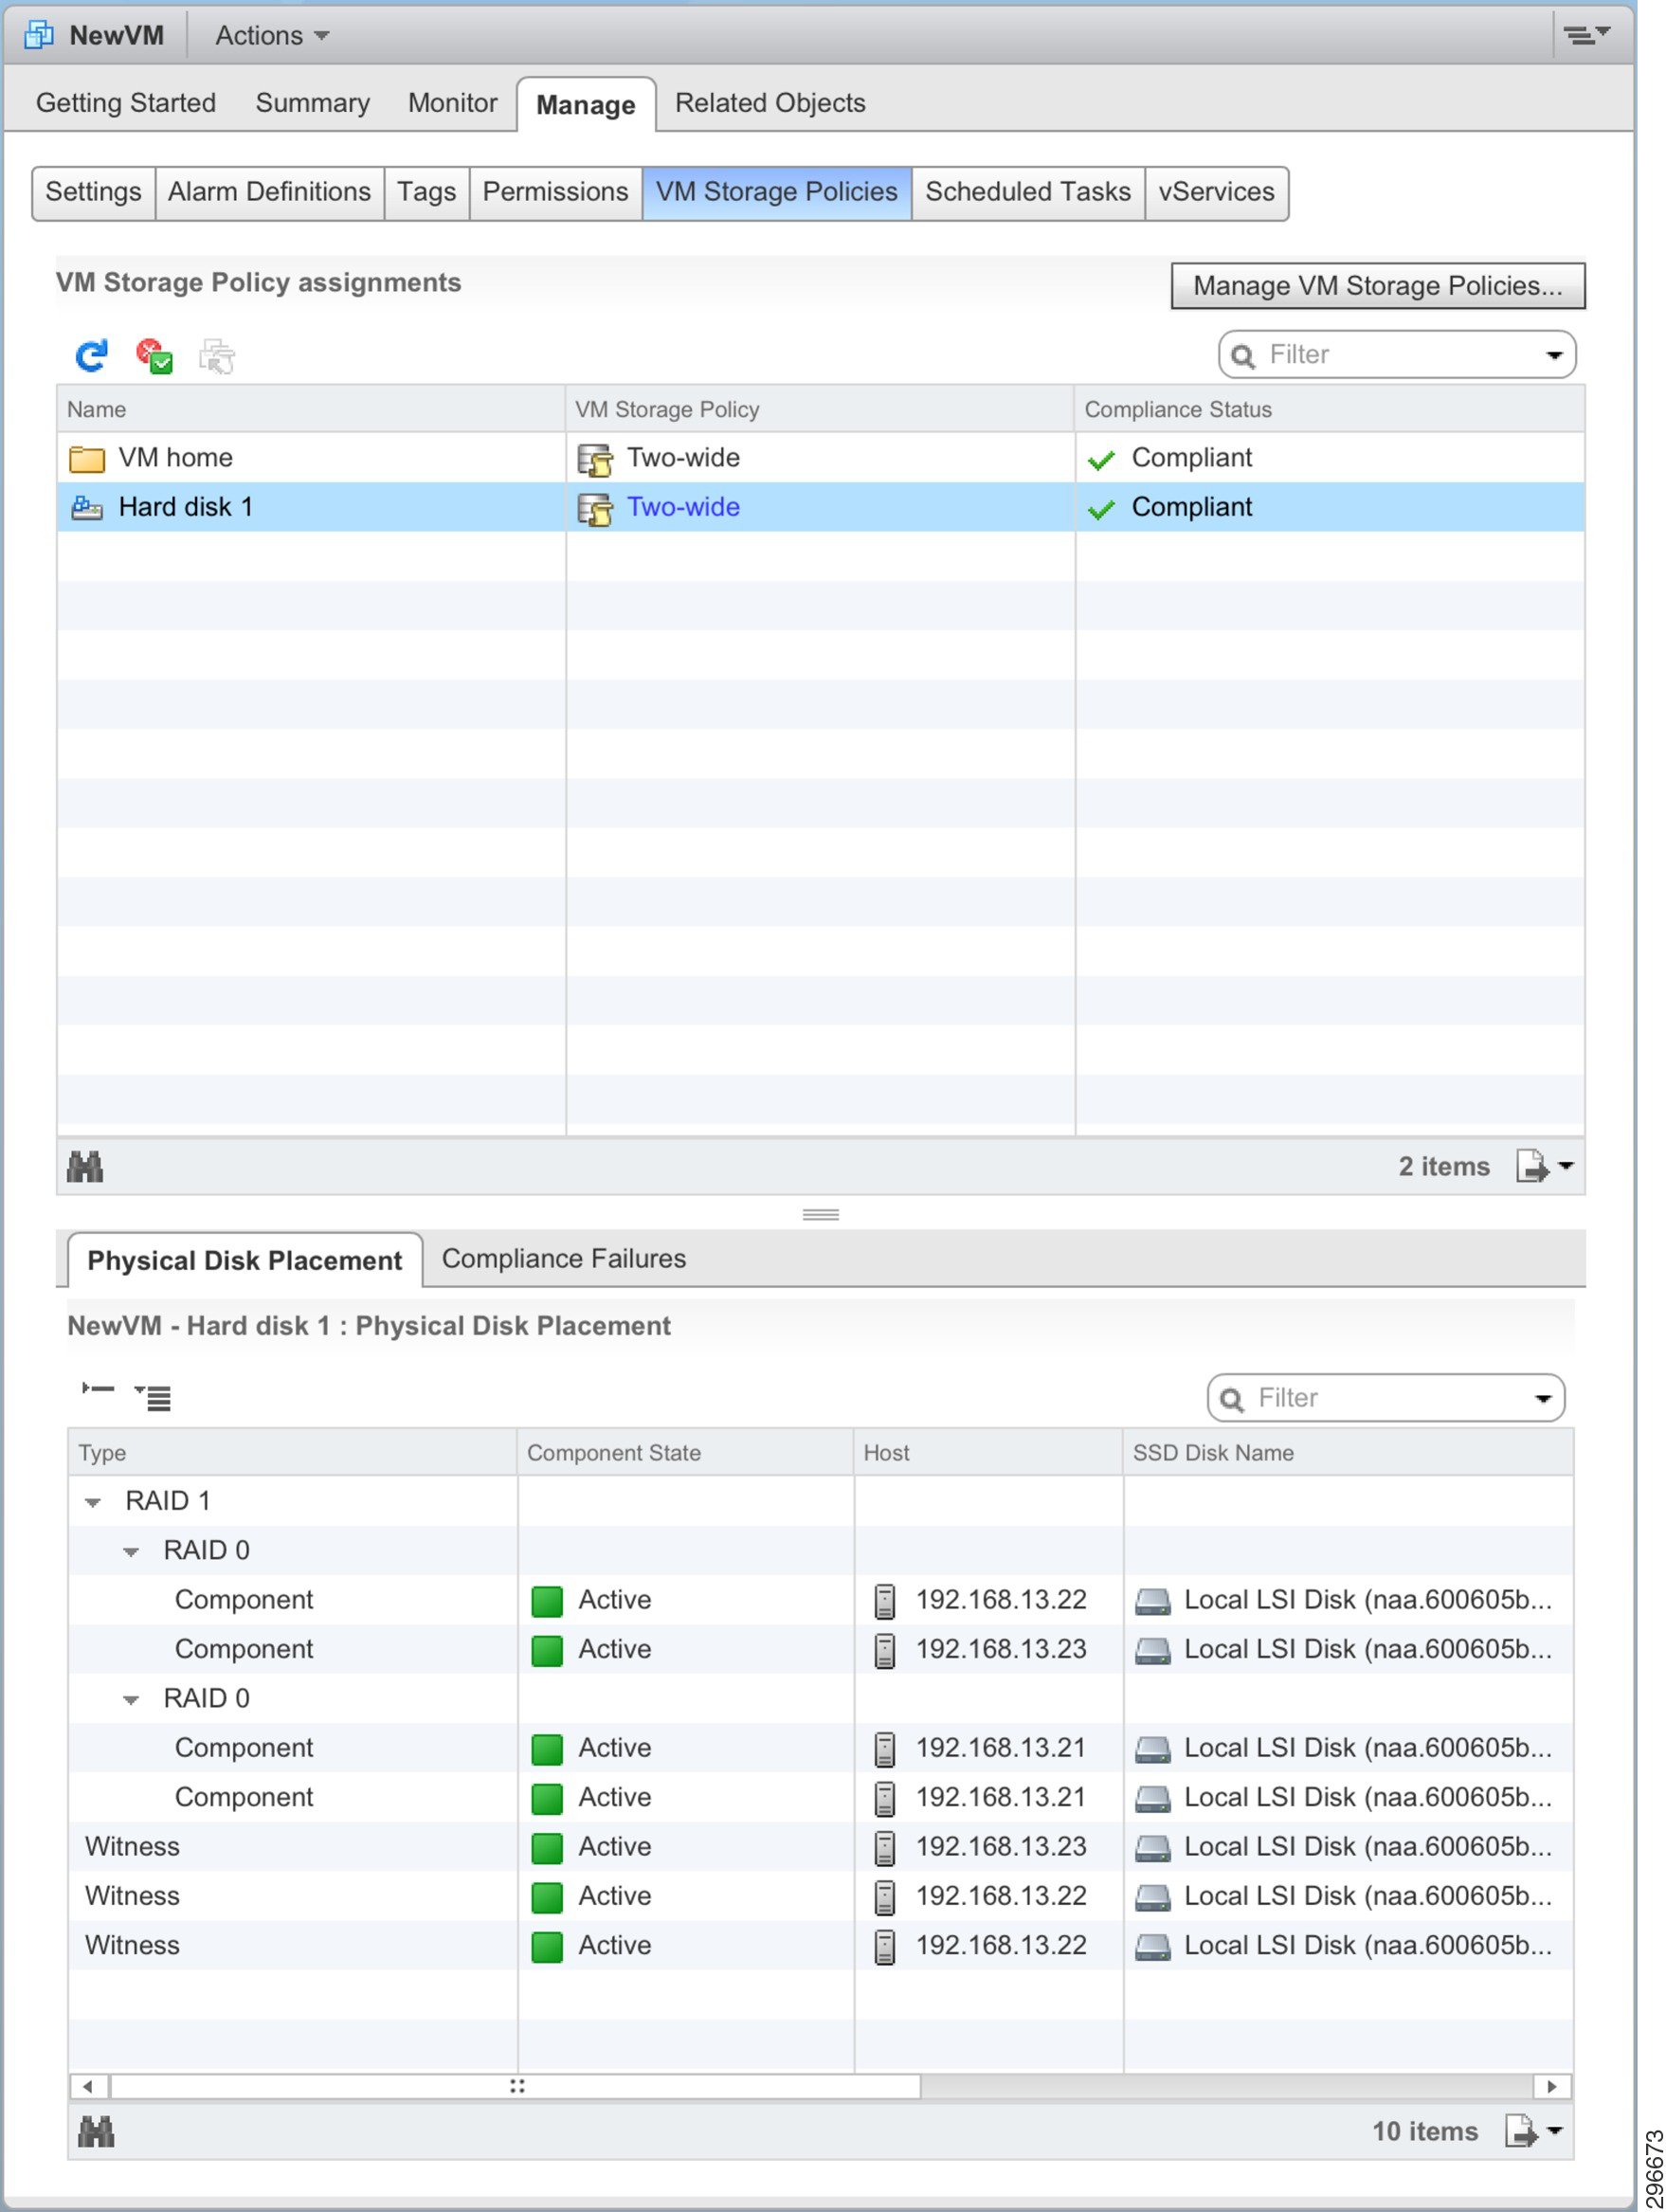
The vSphere web client reflects this new storage policy, visualizing the new RAID tree for the VMDK Disk object, as shown in Figure 4-19.
Figure 4-19 vSphere Web Client VM Storage Object View StripeWidth=2
Zerto Application Suite on Virtual SAN at CSP Site
As discussed in Chapter 2, for a complete Zerto deployment, several VMs will be built and configured at the CSP data center site, including the Zerto Virtual Manager (ZVM), Zerto Cloud Manager (ZCM), Zerto Cloud Connector (ZCC), and Zerto Virtual Replication Appliance (VRA). The ZCC is deployed on a per-tenant basis, which will factor into Virtual SAN scalability. The VRA is deployed on a per-host basis, so there will be one VRA for each ESXi host in the Virtual SAN cluster.
We also mentioned Virtual SAN scalability in Chapter 2, specifically the soft limits on the number of storage objects per ESXi host. At the time of this writing, with the initial release of Virtual SAN running, there is a soft limit of 3000 storage objects per ESXi host. Table 4-9 summarizes the Zerto application pieces deployed for this project, and the number of storage object components each subsists of. An explanation of the component counts, as well as further information on Zerto scalability within Virtual SAN, is provided below.
|
|
|
|
|---|---|---|
Note![]() The reader should not use this summary as predictive of every production deployment, as the number of servers and the configuration of those servers may change from one deployment to the next. Note that there are no snapshots for any of these VMs included in component count. The reader should not use this summary as predictive of every production deployment, as the number of servers and the configuration of those servers may change from one deployment to the next. Note that there are no snapshots for any of these VMs included in component count.
The reader should not use this summary as predictive of every production deployment, as the number of servers and the configuration of those servers may change from one deployment to the next. Note that there are no snapshots for any of these VMs included in component count. The reader should not use this summary as predictive of every production deployment, as the number of servers and the configuration of those servers may change from one deployment to the next. Note that there are no snapshots for any of these VMs included in component count.
Component count directly influenced by the storage policy settings FailuresToTolerate and StripeWidth. The table above represents a deployment in which both were left as default (1). Here is how these component counts are accounted for.
The Zerto Cloud Connector was a VM configured with two virtual disk. Four objects, therefore, subsisted the ZCC: (1) Namespace; (2) VMDK Disks; (1) Swap. Since the ZCC has no need of VMware snapshots, there were no delta disk objects. With FailuresToTolerate=1, there was one RAID-1 set per object with two components, each on a different host. With StripeWidth=1, each component was written to a single spindle, so there were no RAID-0 sets. To satisfy the witness creation rules (described above in Chapter 2), one witness was created per object; Thus, the total number of components per object was three. Table 4-10 provides a theoretical look at the component map for the ZCC.
Note![]() Remember, ZCC is deployed on a per-tenant basis, which should factor into any scalability calculations. Remember, ZCC is deployed on a per-tenant basis, which should factor into any scalability calculations.
Remember, ZCC is deployed on a per-tenant basis, which should factor into any scalability calculations. Remember, ZCC is deployed on a per-tenant basis, which should factor into any scalability calculations.
|
|
|
|
|
|---|---|---|---|
Zerto Cloud Manager and Virtual Manager
Because both the ZCM and the ZVM were configured similarly, with a single virtual disk, the following explanation applies equally. Each of these servers had three objects: (1) Namespace; (1) VMDK Disks; (1) Swap. There were no VMware snapshots, so there were no delta disk objects. With FailuresToTolerate=1, there was one RAID-1 set per object with two components, each on a different host. With StripeWidth=1, each component was written to a single spindle, so there were no RAID-0 sets. To satisfy the witness creation rules (described above in Chapter 2), one witness was created per object; Thus, the total number of components per object was three. Table 4-11 provides a theoretical look at the component map for the ZCM and ZVM.
|
|
|
|
|
|---|---|---|---|
Zerto Virtual Replication Appliance
The Zerto Virtual Replication Appliance was a VM configured with one base virtual disk. Three objects, therefore, subsisted the VRA upon its creation: (1) Namespace; (1) VMDK Disks; (1) Swap. There were no VMware snapshots, so there were no delta disk objects. With FailuresToTolerate=1, there was one RAID-1 set per object with two components, each on a different host. With StripeWidth=1, each component was written to a single spindle, so there were no RAID-0 sets. To satisfy the witness creation rules (described above in Chapter 2), one witness was created per object, Thus, the total number of components per object was three. Table 4-12 provides a theoretical look at the component map for the VRA.
Note![]() Remember, VRA is deployed in the Virtual SAN cluster on a per-host basis, which should factor into any scalability calculations. Remember, VRA is deployed in the Virtual SAN cluster on a per-host basis, which should factor into any scalability calculations.
Remember, VRA is deployed in the Virtual SAN cluster on a per-host basis, which should factor into any scalability calculations. Remember, VRA is deployed in the Virtual SAN cluster on a per-host basis, which should factor into any scalability calculations.
|
|
|
|
|
|---|---|---|---|
Zerto Component Scalability on Virtual SAN
As mentioned above, the scalability of a given Zerto DRaaS deployment will be directly related to the configuration of the Zerto environment and the underlying virtual infrastructure. The other factor governing scalability is servers that are being protected by the Zerto DRaaS service running at the CSP. Just as with the Zerto nodes themselves, the configuration of the hosts that are protected by Zerto will determine scalability within Virtual SAN.
This paper cannot predict absolute scalability and make definitive statements regarding the number of hosts that can be protected by Zerto backed by a given Virtual SAN deployment. Instead, we will strive to provide the guidance needed for the administrators to predict scalability in their own, unique deployments. We therefore, offer the following guidelines.
There are several factors involved that impact how many volumes will be attached to a VRA.
When a Zerto VPG is created, the target site VRA has ownership of the replicated VMDKs for the virtual machines included in the VPG and they are attached to the VRA as volumes.
As failover testing is performed, temporary volumes are added and then removed upon failover test completion. Additionally, the CSP can have multiple customers utilizing the same ESXi host and VRAs.
The VRA automatically adds volumes to accommodate the point-in-time journals of the VPGs. Depending on the size of the journals, the VRA will create additional volumes as needed. Zerto has a journal sizing tool available for planning the expected size of the journals.
Table 4-12 shows the impact of the journal sizes to the number of disks added to the VRA.
|
|
|
|---|---|
- Guideline #1 —There will be one Namespace object per protected machine.
- Guideline #2 —Regardless of the storage policy being used, the Namespace object will have StripeWidth=1 and FailuresToTolerate=1.
- Guideline #3 —With StripeWidth=1, two components will be created for the Namespace object.
- Guideline #4 —Following the rules for witness creation in Chapter 2, one witness will be created.
- Guideline #5 —There will be one object created per virtual disk on the machine.
- Guideline #6 —The number of mirror copies created of each Disk object will be determined by the FailuresToTolerate policy, using the formula [#Copies = FTT + 1].
- Guideline #7 —The number of components created for each of the Disk object copies will be governed by the StripeWidth policy, using the formula [#Components = #Copies * #Stripes].
- Guideline #8 —Follow the rules for witness creation to determine the number of witness components that will be created.
- Guideline #9 —There will be no swap objects created until the machine is powered on, following the DR event.
- Guideline #10 —None of the snapshots for the protected machine will be propagated to the Zerto replicate, so there will be no delta disk objects.
- Summary —On the CSP side, the machine that is protected will have, at this point, objects for its disks and namespace.
When a failover is invoked to recover customer machines in the CSP, ZVR creates and adds the virtual machines to the vCenter inventory, detaches the replicated volumes from the VRA ownership and attaches them to the appropriate virtual machines, then completes the failover process workflow. This may include changing IP addresses or running startup scripts.
- Guideline #1 —All Disk and Namespace objects and components will remain the same as when the machine was initially protected.
- Guideline #2 —A Swap object will be created for the recovered VM.
- Guideline #3 —Regardless of the storage policy being used, the Namespace object will have StripeWidth=1 and FailuresToTolerate=1.
- Guideline #4 —With StripeWidth=1, two components will be created for the Namespace object.
- Guideline #5 —Following the rules for witness creation in Chapter 2, one witness will be created.
- Summary —The protected machine will add to its existing count three components for the Swap object when it is powered on.
Failover and Reverse Protection Operations
Some of the core operations of ZVR include:
Depending on the operation, ZVR will execute different workflows.
When a customer performs a Move operation, they are transferring the workload from being hosted locally to being permanently hosted at the CSP site. The workflow powers off the source virtual machine, removes it from inventory and powers it on at the CSP site.
A failover test operation is completely non-disruptive to the production environment. It allows the administrator to determine boot up order and timing, script execution and generally perfecting the failover event in a safe environment to produce the lowest recovery time possible. During the testing operation, ZVR creates a disposable temporary disk from the source protected replicated VMDK and all changes are temporarily made to the disposable disk. Once testing is complete, the disposable disk is deleted. Depending on the Virtual SAN StripeWidth and FailuresToTolerate settings, three or more Virtual SAN components will be created with this disposable disk and destroyed with its deletion.
A failover operation fails over the virtual machine to the CSP due to an event at the source site. The source site may or may not be communicable with the CSP site, so the customer can access and manage the operations in the Zerto Self Service Portal, presented as a standalone ZSSP interface or embedded in the CSP’s customer portal. In the failover operation, the VRA releases control of the replicated VMDKs and adds the virtual machine to the vCenter inventory and powers on the VM at the CSP site.
During the failover workflow, the Reverse Protection operation is configured. Reverse Protection streamlines the immediate need to replicate from the CSP back to the customer site as soon as the customer site and the CSP site resume communications. Upon initiation of the Reverse Protection operation, ZVR performs a delta sync of the data between the sites.
Zerto Storage Scalability on Virtual SAN
We must mention in brief how storage consumption on the CSP Virtual SAN datastore is scaled. This, too, is governed by the VM storage policies being employed on the Virtual SAN cluster, specifically the FailuresToTolerate policy. When FTT=1, for example, two copies of the data are created. For a crude estimation, determine storage consumption using the following formula: [StorageUsed = DiskSize * (FTT + 1)]. For example, given a protected machine having one 20GB disk and FTT=1, 40GB of storage will be used. If a protected machine has three 100 GB disks and FTT=2, 900GB of storage will be used.
Note![]() For a finer calculation, please use the Virtual SAN datastore calculate on Duncan Epping’s blog: For a finer calculation, please use the Virtual SAN datastore calculate on Duncan Epping’s blog: http://www.yellow-bricks.com/2014/01/17/virtual-san-datastore-calculator/
For a finer calculation, please use the Virtual SAN datastore calculate on Duncan Epping’s blog: For a finer calculation, please use the Virtual SAN datastore calculate on Duncan Epping’s blog: http://www.yellow-bricks.com/2014/01/17/virtual-san-datastore-calculator/
The storage consumed for non-Disk objects (including witnesses) is negligible, unless at very large scales. For example, a witness object consumes 2 MB of disk. This is not a big deal for a few VMs, but for hundreds of VMs and storage policies set to non-default values, it could add up.
 Feedback