- Preface
- New and Changed Information
- Cisco IWAN Application Overview
- Configuring and Setting Up the Hub Site
- Managing Branch Sites
- Administering Application Policies
- Monitoring and Troubleshooting Sites
- Backup and Restore, Recovery, and Delete
- Upgrading the Cisco IWAN Application
- Brownfield Validation Messages
Cisco IWAN on Cisco APIC-EM Configuration Guide, Release 1.3.x
Bias-Free Language
The documentation set for this product strives to use bias-free language. For the purposes of this documentation set, bias-free is defined as language that does not imply discrimination based on age, disability, gender, racial identity, ethnic identity, sexual orientation, socioeconomic status, and intersectionality. Exceptions may be present in the documentation due to language that is hardcoded in the user interfaces of the product software, language used based on RFP documentation, or language that is used by a referenced third-party product. Learn more about how Cisco is using Inclusive Language.
- Updated:
- October 18, 2016
Chapter: Monitoring and Troubleshooting Sites
Monitoring and Troubleshooting Sites
Monitoring and Troubleshooting
Use this procedure to monitor and troubleshoot sites.
Step 1![]() From the Cisco IWAN home page, click Monitor and Troubleshoot. The Monitoring page opens and a map displays with all of the sites highlighted, indicating the number of hubs and branches present across the globe for Cisco IWAN.
From the Cisco IWAN home page, click Monitor and Troubleshoot. The Monitoring page opens and a map displays with all of the sites highlighted, indicating the number of hubs and branches present across the globe for Cisco IWAN.

Step 2![]() Click a highlighted site. The Site Details page opens with the following information and additional tabs:
Click a highlighted site. The Site Details page opens with the following information and additional tabs:
Step 3![]() Click the Hub Topology or Site Topology tab, to view the topology of the hub or site as appropriate, including the site name, site location, and preferred POP.
Click the Hub Topology or Site Topology tab, to view the topology of the hub or site as appropriate, including the site name, site location, and preferred POP.
Step 4![]() Click the IP Address Allocation tab to view a list of devices in the site and the IP addresses to which the devices are allocated.
Click the IP Address Allocation tab to view a list of devices in the site and the IP addresses to which the devices are allocated.
Step 5![]() Click the Application Health tab to view the application usage on the site in a graphical format. The graph displays the following:
Click the Application Health tab to view the application usage on the site in a graphical format. The graph displays the following:
- Various applications configured for the site.
- Bandwidth usage for each application.
- Statistical trend for each application.
Figure 6-2 Application Health Tab

Step 6![]() Click the Alarms tab to view issues with a site.
Click the Alarms tab to view issues with a site.

Note![]() The Alarms tab appears only when the system suspects that the site has an issue because of an application or due to bandwidth allocation.
The Alarms tab appears only when the system suspects that the site has an issue because of an application or due to bandwidth allocation.
Step 7![]() Click the Troubleshooting tab to troubleshoot the application when the hub or branch site application health is critical as shown in the following figure.
Click the Troubleshooting tab to troubleshoot the application when the hub or branch site application health is critical as shown in the following figure.
Figure 6-3 Troubleshooting—Detection
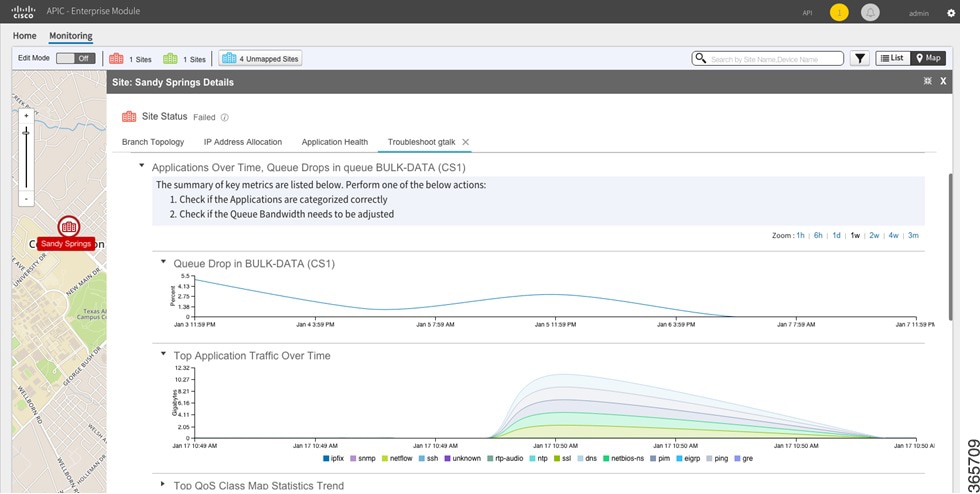
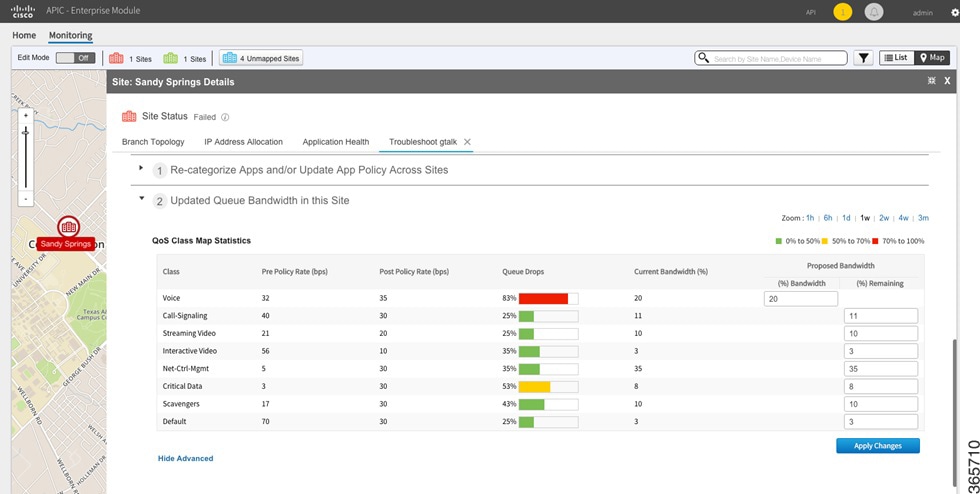
In addition to detecting the application causing the issue, the system also provides suggestions to improve the site. For example, if a site uses more bandwidth the system suggests adjusting the bandwidth among the various applications to provide more bandwidth to the application causing the issue.
Figure 6-4 Troubleshooting—Healing a Site
 Feedback