Queries and Reports
Available Languages
Table Of Contents
Maximum Number of Rows Returned
Restrictions for Real-time Event Viewer
Procedure for Invoking the Real-Time Event Viewer
Perform a Long-Duration Query Using a Report
View a Query Result in the Report Tab
Report Type Views: Total vs. Peak vs. Recent
Queries and Reports
This chapter discusses the following topics:
•
Perform a Long-Duration Query Using a Report
Queries
On the Query page, you can run reports as on-demand queries, or create your own query. Many links from other pages bring you to the query page, which then partially populate the query's criteria. Once you have submitted a query, you can save it as a report or a rule.
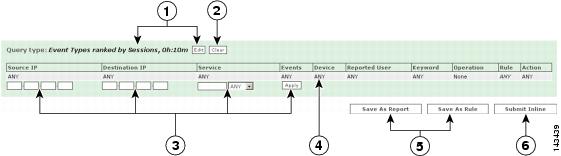
Figure 21-1 The Local Controller Query Table
To Run a Quick Query
Step 1
Step 2
Figure 21-2 Running a Quick Query

To Run a Free-form Query
Step 1
Figure 21-3 Running a free-form query
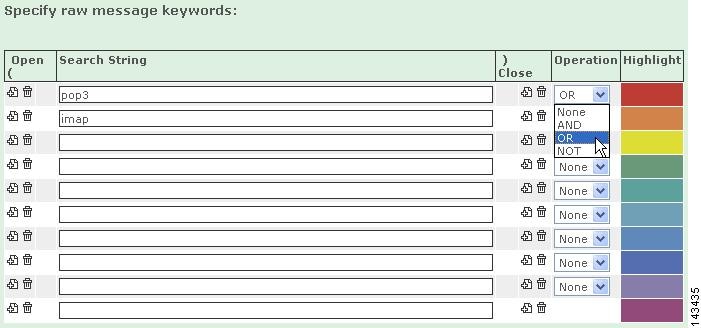
Step 2
)to add parentheses for nested queries or click the trash can icon (
) to remove parentheses.
Step 3
Step 4
Step 5

Note
To Run a Batch Query
Step 1
Figure 21-4 Construct a Query to Run in Background (Batch Query)

Step 2
Figure 21-5 Choosing the Query Submission Method
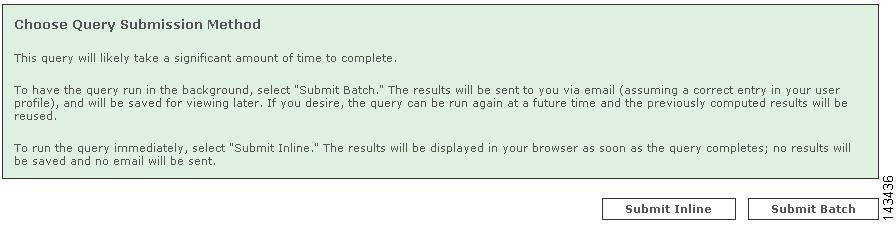
To submit as a standard inline query, click Submit Inline.To submit your query as a batch query, click Submit Batch. Your query is submitted, and you are automatically taken to the Batch Query tab.
If your query is very large, you may only be give the options of Save as Rule, Save as Report, or Submit Batch.
Figure 21-6 Change Query Criteria

To submit your query as a batch query, click Submit Batch. Your query is submitted, and you are automatically taken to the Batch Query tab.
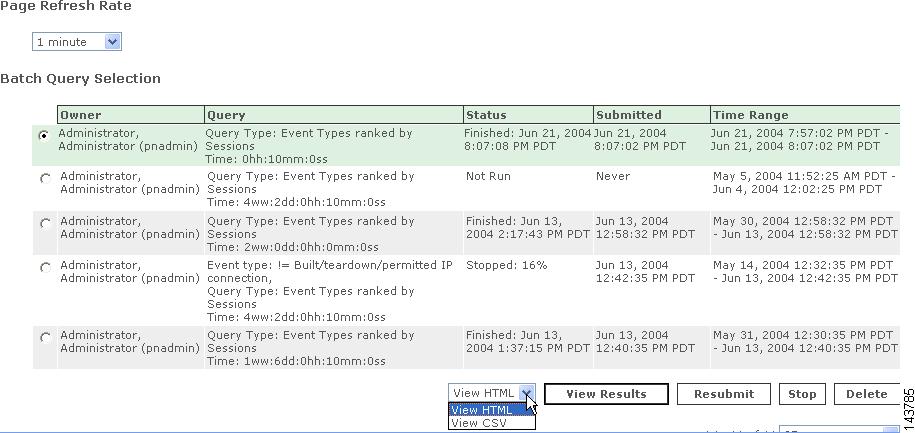
Figure 21-7 Select Batch Query
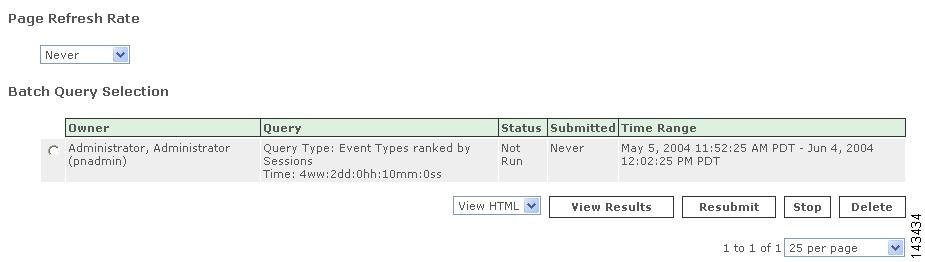
Step 3
Step 4
If the email address in your user profile on the MARS is valid, the results of your batch query are emailed to you when the query has completed, and can also be viewed by clicking QUERY / REPORTS > Batch Query > View Results.
Note
To Stop a Batch Query
Step 1
Step 2
To Resubmit a Batch Query
You can resubmit a batch query if you want to restart it. A resubmitted batch query will use previously computed results, thus resulting in a faster query than one submitted for the first time.
Step 1
Step 2
To Delete a Batch Query
Step 1
Step 2
Step 3
Note
Selecting the Query Type
Figure 21-8 Clicking the Query Type or Edit link

You can select different query criteria by clicking the Query Type link or Edit button. This lets you determine a query's result format, rank, time, whether it only uses firing events, and the number of rows returned.
Figure 21-9 The Query Criteria: Result Page

Result Format
•
Returns the most reported event types. Ranked by either: number of sessions containing at least one of the event type or by bytes transmitted in sessions that contain events that meet the query criteria.
•
Returns either pre-defined or user defined grouped event types. Ranked by either: number of sessions containing at least one event type contained in the group or by bytes transmitted in sessions that contain events that meet the query criteria.
•
Returns source IP addresses. Ranked by number of sessions with that source IP address or by bytes transmitted in sessions that contain events that meet the query criteria.
•
Returns top networks that exists in MARS. Ranked by either: number of sessions that contain events that meet the query criteria or by bytes transmitted in sessions that contain events that meet the query criteria. If a network is excluded, it is excluded from all results.
•
Returns top network groups that exists in MARS. Ranked by either: number of sessions that contain events that meet the query criteria or by bytes transmitted in sessions that contain events that meet the query criteria. If a network is excluded, it is excluded from all results.
•
Returns top source networks that exists in MARS. Ranked by either: number of sessions that contain events that meet the query criteria or by bytes transmitted in sessions that contain events that meet the query criteria. If a network is excluded, it is excluded from all results.
•
Returns top source network groups that exists in MARS. Ranked by either: number of sessions that contain events that meet the query criteria or by bytes transmitted in sessions that contain events that meet the query criteria. If a network is excluded, it is excluded from all results.
•
Returns top destination networks that exists in MARS. Ranked by either: number of sessions that contain events that meet the query criteria or by bytes transmitted in sessions that contain events that meet the query criteria. If a network is excluded, it is excluded from all results.
•
Returns top destination network groups that exists in MARS. Ranked by either: number of sessions that contain events that meet the query criteria or by bytes transmitted in sessions that contain events that meet the query criteria. If a network is excluded, it is excluded from all results.
•
Returns destination IP addresses. Ranked by either: number of sessions with that destination IP address or by bytes transmitted in sessions that contain events that meet the query criteria.
•
Returns source ports. Ranked by either: number of sessions with that source port or by bytes transmitted in sessions that contain events that meet the query criteria.
•
Returns destination ports. Ranked by either: number of sessions with that destination port or by bytes transmitted in sessions that contain events that meet the query criteria.
•
Returns most used protocols. Ranked by either: number of sessions with that protocol or by bytes transmitted in sessions that contain events that meet the query criteria.
•
Returns most active reporting devices. Ranked by either: number of sessions that contain events from the device or by bytes transmitted in sessions that contain events that meet the query criteria.
•
Returns most active reporting device types. Ranked by either: number of sessions that contain events from a device of that type or by bytes transmitted in sessions that contain events that meet the query criteria.
•
Returns information about users from reporting devices such as: Windows clients, Solaris clients, etc. Ranked by either: number of sessions that contain events from a reported user or by bytes transmitted in sessions that contain events that meet the query criteria.
•
Returns top firing rules. Ranked by number of incidents.
•
Returns incidents. Ranked by either: number of sessions that contain events that meet the criteria that contributed to the incident or by bytes transmitted real time in sessions that contain events that meet the query criteria.
•
Returns all sessions that contain events that meet the criteria. Sessions that contain a common set of event types are grouped together. They are also sub-grouped by session source IP address and session destination IP address. Sessions in the same sub-group are ordered by time. Real Time results are available for this Result Type.
•
Returns events. Ranked by time with the most current first. Real Time results are available for this Result Type.
•
Returns the raw messages associated with events. Ranked by time with the most current first. Real Time results are available for this Result Type.
•
Returns NAT connections. Ranked by time with the most current first.
•
Returns MAC addresses. Ranked by time with the most current first.
•
Returns events that are not fully processed by the MARS. In some cases, event information such as the five tuple (source IP, source port, destination IP, destination port, and protocol) might not be present, hence can not be queried in real time.
Order/Rank By
This selection determines the ranking or order of the query's results. These selections are determined by the kind of Result Format that you use when you run the query.
•
The number of sessions that contain events that meet the criteria that contributed to the incident.
•
The number of bytes transmitted in sessions that contain events that meet the query criteria.
•
Most current results appear first.
•
Largest number of incidents appear first.
Filter By Time
•
The present time minus the number of days, hours, and minutes entered.
•
Absolute literal time ranges defined by the date to the minute.
•
Streams rolling real-time results from recent past to current time. Result Formats that work in real time are: All Matching Sessions, All Matching Events, and All Matching Event Raw Messages.
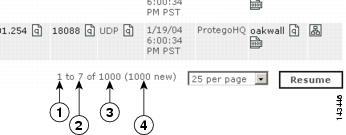
Real Time results appear in a normal browser window. Moving the scroll bar stops the "rolling" behavior. Clicking the Resume button on the bottom of the page allows the scrolling to resume.
Figure 21-10 Click the Resume Button to Start the Page Rolling
Use Only Firing Events
Select this if you want only events that fired incidents to return information.
Maximum Number of Rows Returned
Select the number of rows that you want displayed.
Selecting Query Criteria
To Select a Criterion
Step 1
Figure 21-11 Clicking any to narrow your criteria

Step 2
Figure 21-12 Selecting Variables

Step 3
1.
2.
3.
4.
5.
6.
7.
8.
(Up) icon, or the Not Equal
(Up) icon.
9.
10.
11.
Repeat this selection process for other query data.
Step 4
Query Criteria
The following list describes the selections in the Query Event Data table.
Source IP
•
Specifies that the constraints entered are the session endpoints.
•
Specifies that the constraints entered are the source as appearing at the destination.
•
No constraint is placed on the source IP addresses.
•
Signify any one IP address, only useful for queries in tandem with the same variable.
•
IP addresses present on devices in the system or user entered dotted quads.
•
The range of addresses between two dotted quads.
•
Topologically valid networks.
•
The hosts and reporting devices present in the system.
Destination IP
•
Specifies that the constraints entered are the session endpoints.
•
Specifies that the constraints entered are the destination as appearing at the source.
•
No constraint is placed on the source IP addresses.
•
Any one IP address, only useful for queries in tandem with the same variable.
•
IP addresses present on devices in the system or user entered dotted quads.
•
The range of addresses between two dotted quads.
•
Topologically valid networks.
•
The hosts and reporting devices present in the system.
Service
•
No constraint is placed on the source or destination ports or protocol.
•
Any one set of destination port and protocol, only useful for queries in tandem with the same variable.
•
Services on the database.
Event Types
•
No constraint on the event type.
•
Events that have been merged into types.
•
Groups of event types.
Device
•
The reporting devices present in the system. This restricts the query to a subset of the devices that report to the MARS.
Severity/Zone
•
No constraint on the event type severity.
•
Low-severity events
•
Medium-severity events
•
High-severity events
•
Events reported by devices in the indicated zone.
Operation
•
Defines a single-line query.
•
Boolean "and" that defines a two or more line query.
•
Boolean "or" that defines a two or more line query.
•
Time conditional query (e.g.: Y must happen after X) that defines a two or more line query.
Rule
•
When this field is empty, it acts like an ANY selection. No constraint is placed on the sub-set of events.
•
Restricts the query to the sub-set of events that contributed to the incidents of the specified rules firing.
Action
•
When this field is empty, it acts like an ANY selection. No constraint is placed on the sub-set of events.
•
Restricts the query to the sub-set of events that contributed to the incidents of rules that have the specified notifications as part of their actions. (See Table 22-1Rule Fields and Arguments, page 22-6 for more information.)
Saving the Query
You can save query criteria to re-use as reports or rules.
To save a query as a report
This takes the query that you are using and creates a report. For more information on creating reports, see Reports.
To save a query as a rule
This takes the query to the rules page, populating the rules with the selected query criteria. Likely, you must identify additional criteria to complete the rule. For more information on creating rules, see Rules, page 22-1.
Viewing Events in Real-time
The Real-time Event viewer is a query option that permits you to view real-time events as follows:
•
•
The real-time events display as a continuously scrolling screen. You can configure query criteria to filter what is displayed. When viewing raw events, sessionization is not impeded, all the parsed raw events are sessionized per normal MARS operation. MARS.
The Real-time Event viewer is available for the following query result formats that support ranking by time (Order/Rank field set to Time):
•
•
•
•
•
•
•
•
•
Restrictions for Real-time Event Viewer
The Real-time Event Viewer is available only for Local Controllers.
Real-time event queries should be made only from a browser instance that was used to login to MARS. The real-time query will not have reliable results if it is executed from a browser instance spawned from the original login instance (for example, a new browser window launched with Ctrl+N, File>New>New Window, or right-click {link on MARS GUI}>Open in New Window).
Multiple real-time queries can operate in multiple browser instances at the same time, but you must login to MARS with each browser instance. MARS allocates 1GB of shared buffer for incoming events per query instance. The following restrictions for simultaneous Real-time Event Viewer sessions exist for the specified model:
•
•
•
•
Procedure for Invoking the Real-Time Event Viewer
To invoke the real-time event viewer, complete the following steps:
Step 1
Figure 21-13 Query Home Page

Step 2
Figure 21-14 Configuring Real-Time Event Viewer Query

Step 3
a.
The formerly grayed-out Real Time radio button becomes clickable.
b.
Only All Marching Events, and All Matching Events Raw Messages have the Raw events option.
All Matching Events with Raw events displays Event ID, Event Type, Source IP/Port, Destination IP/Port, Protocol Time, and Reporting Device fields.
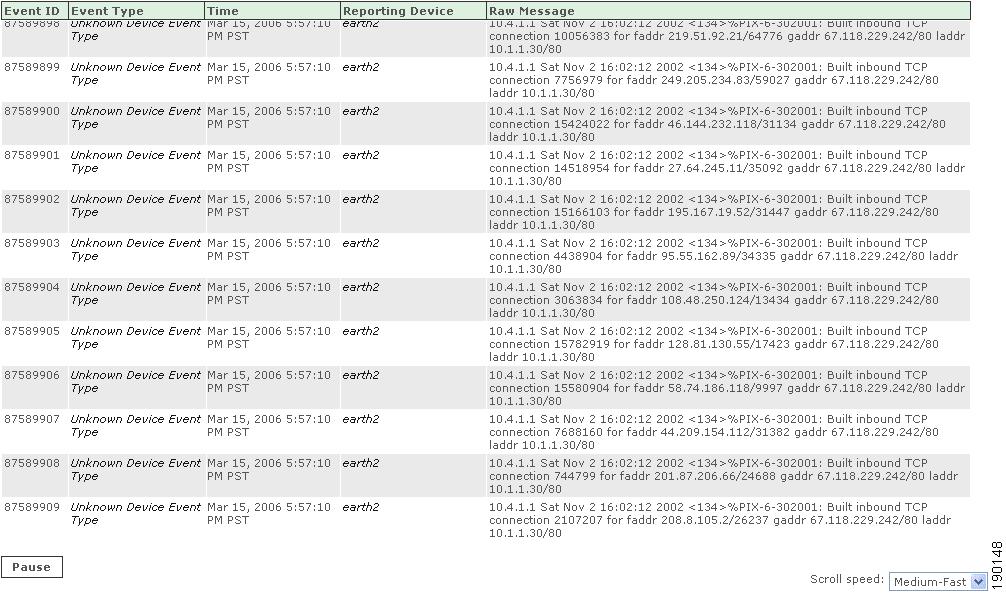
All Matching Events Raw Messages with Raw events displays Event ID, Event Type, Time, Reporting Device, and Raw Message fields.
A Result Format with the Sessionized Events option displays Event/Session/Incident ID, Event Type, Source IP/Port, Destination IP/Port, Protocol, Time, Reporting Device, Path/Mitigation, and Tune fields.
c.
The Query Event Data screen appears with the Save as Report and Save as Rule buttons gray and inactive, as shown in Figure 21-15.
Figure 21-15 Real-Time Event Query to Submit

Step 4
Note
Real-time results begin to scroll up from the bottom of the page within 5 seconds, as shown in Figure 21-16. Real-time raw events are shown in this example.
Figure 21-16 View of Events in Real-Time
The Real-time event viewer display is governed by the following controls:
•
•
•
•
•
Note
Step 5
Figure 21-17 Reporting Device Information Pop-up Window

Should errors occur during the display of events, a message box appears, as shown in Figure 21-18.
Figure 21-18 Real-time Event Viewer Error Message

Click OK to clear the message box, and restart the Real-time event viewer by clicking Submit.

Tip
This ends the Procedure for Invoking the Real-Time Event Viewer.
Perform a Long-Duration Query Using a Report
This section explains how to create and view a long-duration query on the MARS. There are two ways to perform a long-duration query on the MARS:
1.
Advantages:
•
•
Disadvantage.
This type of query can only be used without any changes to query criteria other than time range, and can only be used with the following reports:
•
•
•
•
•
•
•
•
•
•
•
•
•
•
•
2.
Advantages:
•
•
Disadvantages
•
•
If you want to observe activity on your MARS over a long period, you can change the duration of time over an existing report that runs on a regular basis, such as hourly or daily, whether they are shipped with the MARS or created by you.
Note
To query using a report, follow these steps:
Step 1
Figure 21-19 Main Report Window

Step 2
Figure 21-20 Build Report window
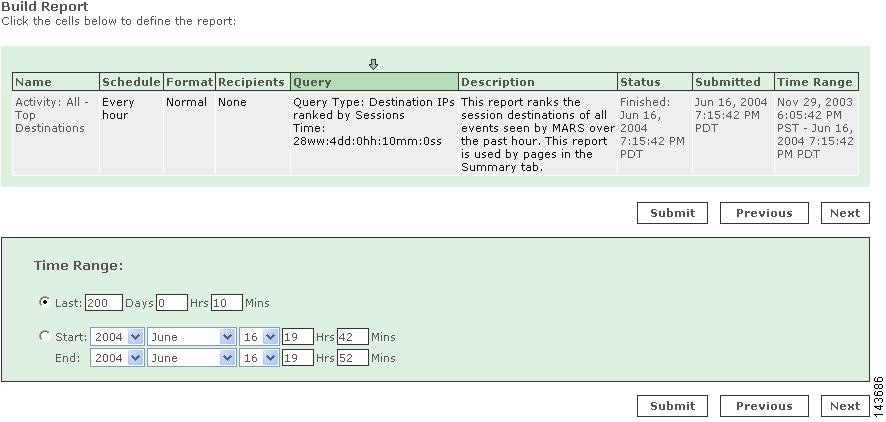
Step 3
Step 4
View a Query Result in the Report Tab
To view a query in the Report tab, follow these steps:
Figure 21-21 Main Report window (bottom)

Step 1
Step 2
•
•
Step 3
Note
Note
MARS Appliance GUI.
Perform a Batch Query
This type of long-duration query can take a long time to perform and is more suitable for a shorter duration of time.
Note
To perform a batch query, follow these steps:
Step 1
Figure 21-22 Query window

Step 2
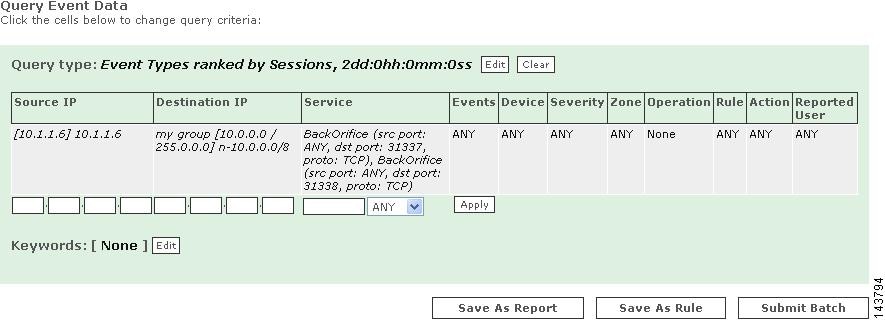
Figure 21-23 Query Event Data window

Step 3
Figure 21-24 Query Save/Submit window
Step 4
Figure 21-25 Batch Query Tab
Step 5
Note
MARS Appliance GUI.
Step 6
If the email address in your user profile on the MARS is valid, the results of your batch query are emailed to you when the query has completed. You can also view the results of your batch query by clicking QUERY / REPORTS > Batch Query > View Results.
Note
Reports
Using the Reports page, you can build repeatable queries, edit and delete current reports, run reports, and view reports in either HTML or CSV (comma separated value) formats.
Predefined System Reports are treated as global reports. Global Controller receives report data once its connected to the Local Controller. Previous report results (prior to managing the Local Controller) will not be pushed up to Global Controller. Thus viewing of reports will not include the information before the Local Controller becomes active.
When you view a report, you are viewing the last instance that ran. If you want to view an up-to-the-minute report, resubmit the report before viewing it.
Report results are purged from the database after a purge interval, as tabulated in Table 21-1.
Table 21-1 Maximum Database Retention Limits for Report Results
CS-MARS-20-K9
1,000 ranking reports
5,000 event/session reports3 months
CS-MARS-50-K9
1,000 ranking reports
5,000 event/session reports3 months
CS-MARS-100-K9
1,000 ranking reports
5,000 event/session reports6 months
CS-MARS-100E-K9
1,000 ranking reports
5,000 event/session reports6 months
CS-MARS-200-K9
1,000 ranking reports
5,000 event/session reports6 months
CS-MARS-GC-K9
1,000 ranking reports
5,000 event/session reports12 months
CS-MARS-GCM-K9
1,000 ranking reports
5,000 event/session reports12 months
1 Table values are for Cisco Security MARS Release 4.1.5. In Release 4.1.4 and prior, the maximum number of ranking reports is 100, maximum number of event/session reports is 1,000.
2 As of Cisco Security MARS Release 4.1.5. In Release 4.1.3, and 4.1.4, report results are retained for one year in the MARS database before they are automatically purged. In Releases prior to Release 4.1.3, report results are retained indefinitely. The purge interval cannot be changed.
Report Type Views: Total vs. Peak vs. Recent
Where alerts provide up-to-the-minute views of high-priority incidents, reports aggregate sessions into different views. Reports correlate based on the three data points:
•
•
•
The period of time defines boundaries around the analyzed session data based on when it was recorded. Query criteria restrict the set of sessions that will be aggregated to that which matches your criteria. Criteria can include source address, destination address, network service, event, reported user, and reporting device. The view type defines how to aggregate the matched data into a meaningful report view—one that matches the type of study in which you are interested.
Note
MARS provides three view types, each of which restricts the matched sessions to a user-defined limit of N. The following view types exist:
•
•
Each peak value is charted relative to the other nine peaks. For each time slice containing a peak value, the Peak View lists the top N matched result types that occurred. It is possible to have multiple peaks within the same time slice, as it is the result type, not the time slice, that must be unique across peaks.
Note
Unlike the Total View, the Peak View does not focus on the overall top occurring results, instead it identifies a high volume of traffic over a short time period. Its purpose is to detect temporary bursts of traffic on your network that overshadow normal traffic usage. These bursts identify possible issues, such as worm outbreaks.
•
•
Creating a Report
You can create a report through the Query page, or you can create a report from scratch on the Reports page. These instructions detail creating a report from the Reports page, but are applicable to editing reports and to creating reports from the Query page.
To Create a New Report
Step 1
Step 2
Step 3
Step 4
Step 5
Step 6
Step 7
Step 8
Working With Existing Reports
To View a Report
Step 1
Step 2
–
–
Step 3
Note
To Run a Report
Step 1
Step 2
Note
See Table 21-1, "Maximum Database Retention Limits for Report Results" for information on how long report results are retained in the database per MARS model number.
To Delete a Report
Step 1
Step 2
Step 3
To Edit a Report
You can not edit system generated reports. Editing report criteria is meant for minor tweaking to previously generated report.
Step 1
Step 2
Step 3
Figure 21-26 Navigating to the Recipients column by clicking its criteria
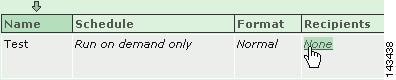
Step 4
Step 5
Note
Note
 Feedback