Flexible NetFlow New Flexible NetFlow CLI
Available Languages
Contents
- Flexible NetFlow - New Flexible NetFlow CLI
- Finding Feature Information
- Information About Flexible NetFlow New Flexible NetFlow CLI
- Flexible NetFlow Overview
- Flexible NetFlow Components
- Records
- User-Defined Records
- Flow Monitors
- Flow Exporters
- Flow Samplers
- How to Configure Flexible NetFlow New Flexible NetFlow CLI
- Configuring a Customized Flow Record
- Displaying the Current Status of a Flow Record
- Verifying the Flow Record Configuration
- Configuring a Flow Exporter for the Flow Monitor
- Creating a Customized Flow Monitor
- Displaying the Current Status of a Flow Monitor
- Displaying the Data in the Flow Monitor Cache
- Verifying the Flow Monitor Configuration
- Applying a Flow Monitor to an Interface
- Verifying That Flexible NetFlow Is Enabled on an Interface
- Configuration Examples for Flexible NetFlow New Flexible NetFlow CLI
- Example: Configuring a Normal Flow Record Cache with a Limited Number of Flows
- Example: Configuring a Customized Flow Record Cache for Monitoring IPv6 Traffic
- Example: Configuring Flexible NetFlow Multiple Export Destinations
- Additional References
- Feature Information for Flexible NetFlow - New Flexible NetFlow CLI
Flexible NetFlow - New Flexible NetFlow CLI
The Flexible NetFlow - New Flexible NetFlow CLI feature introduces the commands used to configure Flexible NetFlow.
- Finding Feature Information
- Information About Flexible NetFlow New Flexible NetFlow CLI
- How to Configure Flexible NetFlow New Flexible NetFlow CLI
- Configuration Examples for Flexible NetFlow New Flexible NetFlow CLI
- Additional References
- Feature Information for Flexible NetFlow - New Flexible NetFlow CLI
Finding Feature Information
Your software release may not support all the features documented in this module. For the latest caveats and feature information, see Bug Search Tool and the release notes for your platform and software release. To find information about the features documented in this module, and to see a list of the releases in which each feature is supported, see the feature information table at the end of this module.
Use Cisco Feature Navigator to find information about platform support and Cisco software image support. To access Cisco Feature Navigator, go to www.cisco.com/go/cfn. An account on Cisco.com is not required.
Information About Flexible NetFlow New Flexible NetFlow CLI
Flexible NetFlow Overview
Flexible NetFlow adds the capability to customize traffic analysis parameters for your specific requirements.
Flexible NetFlow facilitates the creation of more complex configurations for traffic analysis and data export through the use of reusable configuration components.
Flexible NetFlow Components
Flexible NetFlow consists of components that can be used together in several variations to perform traffic analysis and data export. The user-defined flow records and the component structure of Flexible NetFlow facilitates the creation of various configurations for traffic analysis and data export on a networking device with a minimum number of configuration commands. Each flow monitor can have a unique combination of flow record, flow exporter, and cache type. If you change a parameter such as the destination IP address for a flow exporter, it is automatically changed for all the flow monitors that use the flow exporter. The same flow monitor can be used in conjunction with different flow samplers to sample the same type of network traffic at different rates on different interfaces. The following sections provide more information on Flexible NetFlow components:
Records
In Flexible NetFlow a combination of key and nonkey fields is called a record. Flexible NetFlow records are assigned to Flexible NetFlow flow monitors to define the cache that is used for storing flow data. Flexible NetFlow includes several predefined records that can help you get started using Flexible NetFlow. To use Flexible NetFlow to its fullest potential, you need to create your own customized records, as described in the following section(s):
User-Defined Records
Flexible NetFlow enables you to define your own records for a Flexible NetFlow flow monitor cache by specifying the key and nonkey fields to customize the data collection to your specific requirements. When you define your own records for a Flexible NetFlow flow monitor cache, they are referred to as user-defined records. The values in nonkey fields are added to flows to provide additional information about the traffic in the flows. A change in the value of a nonkey field does not create a new flow. In most cases the values for nonkey fields are taken from only the first packet in the flow. Flexible NetFlow enables you to capture counter values such as the number of bytes and packets in a flow as nonkey fields.
Flexible NetFlow adds a new Version 9 export format field type for the header and packet section types. Flexible NetFlow will communicate to the NetFlow collector the configured section sizes in the corresponding Version 9 export template fields. The payload sections will have a corresponding length field that can be used to collect the actual size of the collected section.
Flow Monitors
Flow monitors are the Flexible NetFlow component that is applied to interfaces to perform network traffic monitoring.
Flow monitors consist of a user-defined record, an optional flow exporter, and a cache that is automatically created at the time the flow monitor is applied to the first interface.
Flow data is collected from the network traffic and added to the flow monitor cache during the monitoring process based on the key and nonkey fields in the flow record.
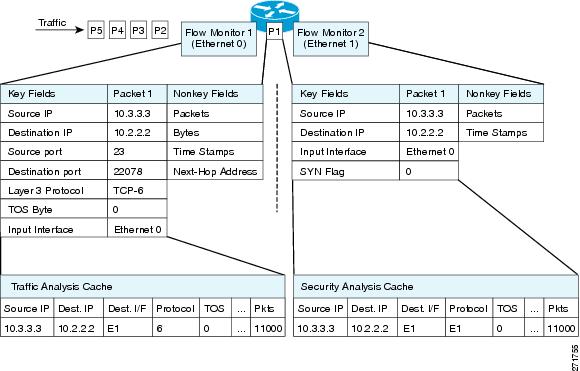
Flexible NetFlow can be used to perform different types of analysis on the same traffic. In the figure below, packet 1 is analyzed using a record designed for standard traffic analysis on the input interface and a record designed for security analysis on the output interface.
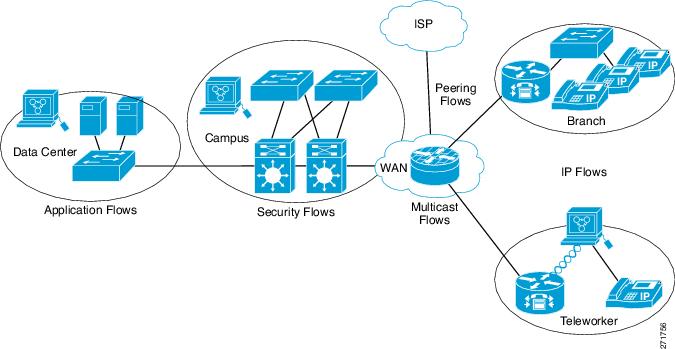
The figure below shows a more complex example of how you can apply different types of flow monitors with custom records.
Flow Exporters
Flow exporters export the data in the flow monitor cache to a remote system, such as a server running NetFlow collector, for analysis and storage. Flow exporters are created as separate entities in the configuration. Flow exporters are assigned to flow monitors to provide data export capability for the flow monitors. You can create several flow exporters and assign them to one or more flow monitors to provide several export destinations. You can create one flow exporter and apply it to several flow monitors.
NetFlow Data Export Format Version 9
The basic output of NetFlow is a flow record. Several different formats for flow records have evolved as NetFlow has matured. The most recent evolution of the NetFlow export format is known as Version 9. The distinguishing feature of the NetFlow Version 9 export format is that it is template-based. Templates provide an extensible design to the record format, a feature that should allow future enhancements to NetFlow services without requiring concurrent changes to the basic flow-record format. Using templates provides several key benefits:
- Third-party business partners who produce applications that provide collector or display services for NetFlow do not have to recompile their applications each time a new NetFlow feature is added. Instead, they should be able to use an external data file that documents the known template formats.
- New features can be added to NetFlow quickly without breaking current implementations.
- NetFlow is "future-proofed" against new or developing protocols because the Version 9 format can be adapted to provide support for them.
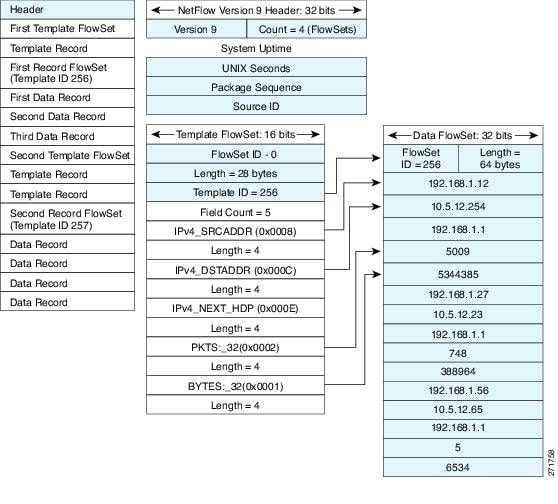
The Version 9 export format consists of a packet header followed by one or more template flow or data flow sets. A template flow set provides a description of the fields that will be present in future data flow sets. These data flow sets may occur later within the same export packet or in subsequent export packets. Template flow and data flow sets can be intermingled within a single export packet, as illustrated in the figure below.

NetFlow Version 9 will periodically export the template data so the NetFlow collector will understand what data is to be sent and also export the data flow set for the template. The key advantage to Flexible NetFlow is that the user configures a flow record, which is effectively converted to a Version 9 template and then forwarded to the collector. The figure below is a detailed example of the NetFlow Version 9 export format, including the header, template flow, and data flow sets.
For more information on the Version 9 export format, refer to the white paper titled Cisco IOS NetFlow Version 9 Flow-Record Format, available at this URL: http://www.cisco.com/en/US/tech/tk648/tk362/technologies_white_paper09186a00800a3db9.shtml.
Flow Samplers
Flow samplers are created as separate components in a router's configuration. Flow samplers are used to reduce the load on the device that is running Flexible NetFlow by limiting the number of packets that are selected for analysis.
Samplers use random sampling techniques (modes); that is, a randomly selected sampling position is used each time a sample is taken.
Flow sampling exchanges monitoring accuracy for router performance. When you apply a sampler to a flow monitor, the overhead load on the router of running the flow monitor is reduced because the number of packets that the flow monitor must analyze is reduced. The reduction in the number of packets that are analyzed by the flow monitor causes a corresponding reduction in the accuracy of the information stored in the flow monitor's cache.
Samplers are combined with flow monitors when they are applied to an interface with the ip flow monitor command.
How to Configure Flexible NetFlow New Flexible NetFlow CLI
- Configuring a Customized Flow Record
- Displaying the Current Status of a Flow Record
- Verifying the Flow Record Configuration
- Configuring a Flow Exporter for the Flow Monitor
- Creating a Customized Flow Monitor
- Displaying the Current Status of a Flow Monitor
- Displaying the Data in the Flow Monitor Cache
- Verifying the Flow Monitor Configuration
- Applying a Flow Monitor to an Interface
- Verifying That Flexible NetFlow Is Enabled on an Interface
Configuring a Customized Flow Record
Perform this task to configure a customized flow record.
Customized flow records are used to analyze traffic data for a specific purpose. A customized flow record must have at least one match criterion for use as the key field and typically has at least one collect criterion for use as a nonkey field.
There are hundreds of possible permutations of customized flow records. This task shows the steps that are used to create one of the possible permutations. Modify the steps in this task as appropriate to create a customized flow record for your requirements.
DETAILED STEPS
Displaying the Current Status of a Flow Record
DETAILED STEPS
| Step 1 | enable The enable command enters privileged EXEC mode (enter the password if prompted). Example:
Device> enable
Device#
|
| Step 2 | show flow record The show flow record command shows the current status of the flow monitor that you specify. Example:
Device# show flow record

flow record FLOW-RECORD-2:
  Description:        Used for basic IPv6 traffic analysis
  No. of users:       1
  Total field space:  53 bytes
  Fields:
    match ipv6 destination address
    collect counter bytes
    collect counter packets
flow record FLOW-RECORD-1:
  Description:        Used for basic IPv4 traffic analysis
  No. of users:       1
  Total field space:  29 bytes
  Fields:
    match ipv4 destination address
    collect counter bytes
    collect counter packets
|
Verifying the Flow Record Configuration
DETAILED STEPS
| Step 1 | enable The enable command enters privileged EXEC mode (enter the password if prompted). Example:
Device> enable
Device#
|
| Step 2 | show running-config flow record The show running-config flow record command shows the configuration commands of the flow monitor that you specify. Example:
Device# show running-config flow record

Current configuration:
!
flow record FLOW-RECORD-2
 description Used for basic IPv6 traffic analysis
 match ipv6 destination address
 collect counter bytes
 collect counter packets
!
flow record FLOW-RECORD-1
 description Used for basic IPv4 traffic analysis
 match ipv4 destination address
 collect counter bytes
 collect counter packets
 collect timestamp sys-uptime first
 collect timestamp sys-uptime last
!
|
Configuring a Flow Exporter for the Flow Monitor
Perform this optional task to configure a flow exporter for the flow monitor in order to export the data that is collected by Flexible NetFlow to a remote system for further analysis and storage.
Flow exporters are used to send the data that you collect with Flexible NetFlow to a remote system such as a NetFlow Collection Engine. Exporters use UDP as the transport protocol and use the Version 9 export format.
 Note |
Each flow exporter supports only one destination. If you want to export the data to multiple destinations, you must configure multiple flow exporters and assign them to the flow monitor. You can export to a destination using either an IPv4 or IPv6 address. |
DETAILED STEPS
| Command or Action | Purpose | |||
|---|---|---|---|---|
|
Step 1
|
enable
Example: Device> enable |
Enables privileged EXEC mode. |
||
|
Step 2
|
configure terminal
Example: Device# configure terminal |
Enters global configuration mode. |
||
|
Step 3
|
flow exporter exporter-name
Example: Device(config)# flow exporter EXPORTER-1 |
Creates a flow exporter and enters Flexible NetFlow flow exporter configuration mode. |
||
|
Step 4
|
description description
Example: Device(config-flow-exporter)# description Exports to datacenter |
(Optional) Creates a description for the flow exporter. |
||
|
Step 5
|
destination {hostname | ip-address} [vrf vrf-name]
Example: Device(config-flow-exporter)# destination 172.16.10.2 |
Specifies the hostname or IP address of the system to which the exporter sends data.
|
||
|
Step 6
|
export-protocol {netflow-v5 | netflow-v9 | ipfix}
Example: Device(config-flow-exporter)# export-protocol netflow-v9 |
Specifies the version of the NetFlow export protocol used by the exporter. |
||
|
Step 7
|
transport udp udp-port
Example: Device(config-flow-exporter)# transport udp 65 |
Configures UDP as the transport protocol and specifies the UDP port on which the destination system is listening for exported Flexible NetFlow traffic. |
||
|
Step 8
|
exit
Example: Device(config-flow-exporter)# exit |
Exits Flexible NetFlow flow exporter configuration mode and returns to global configuration mode. |
||
|
Step 9
|
flow monitor flow-monitor-name
Example: Device(config)# flow monitor FLOW-MONITOR-1 |
Enters Flexible NetFlow flow monitor configuration mode for the flow monitor that you created previously. |
||
|
Step 10
|
exporter exporter-name
Example: Device(config-flow-monitor)# exporter EXPORTER-1 |
Specifies the name of an exporter that you created previously. |
||
|
Step 11
|
end
Example: Device(config-flow-monitor)# end |
Exits Flexible NetFlow flow monitor configuration mode and returns to privileged EXEC mode. |
||
|
Step 12
|
show flow exporter exporter-name
Example: Device# show flow exporter FLOW_EXPORTER-1 |
(Optional) Displays the current status of the specified flow exporter. |
||
|
Step 13
|
show running-config flow exporter exporter-name
Example: Device<# show running-config flow exporter FLOW_EXPORTER-1 |
(Optional) Displays the configuration of the specified flow exporter. |
Creating a Customized Flow Monitor
Perform this required task to create a customized flow monitor.
Each flow monitor has a separate cache assigned to it. Each flow monitor requires a record to define the contents and layout of its cache entries.
An advanced user can create a customized format using the flow record command.
If you want to use a customized record instead of using one of the Flexible NetFlow predefined records, you must create the customized record before you can perform this task.
If you want to add a flow exporter to the flow monitor for data export, you must create the exporter before you can complete this task.
Note |
You must use the no ip flow monitor command to remove a flow monitor from all of the interfaces to which you have applied it before you can modify the parameters for the record command on the flow monitor. For information about the ip flow monitor command, refer to the Cisco IOS Flexible NetFlow Command Reference. |
DETAILED STEPS
| Command or Action | Purpose | |
|---|---|---|
|
Step 1
|
enable
Example: Device> enable |
Enables privileged EXEC mode.
|
|
Step 2
|
configure terminal
Example: Device# configure terminal |
Enters global configuration mode. |
|
Step 3
|
flow monitor monitor-name
Example: Device(config)# flow monitor FLOW-MONITOR-1 |
Creates a flow monitor and enters Flexible NetFlow flow monitor configuration mode.
|
|
Step 4
|
description description
Example: Device(config-flow-monitor)# description Used for basic ipv4 traffic analysis |
(Optional) Creates a description for the flow monitor. |
|
Step 5
|
record {record-name | netflow-original | netflow {ipv4 | ipv6} record [peer]}
Example: Device(config-flow-monitor)# record FLOW-RECORD-1 |
Specifies the record for the flow monitor. |
|
Step 6
|
cache {entries number | timeout {active | inactive | update} seconds | type {immediate | normal | permanent}}
Example: Device(config-flow-monitor)# cache type normal |
(Optional) Modifies the flow monitor cache parameters such as timeout values, number of cache entries, and the cache type.
|
|
Step 7
|
Repeat Step 6 as required to finish modifying the cache parameters for this flow monitor.
|
-- |
|
Step 8
|
statistics packet protocol
Example: Device(config-flow-monitor)# statistics packet protocol |
(Optional) Enables the collection of protocol distribution statistics for Flexible NetFlow monitors. |
|
Step 9
|
statistics packet size
Example: Device(config-flow-monitor)# statistics packet size |
(Optional) Enables the collection of size distribution statistics for Flexible NetFlow monitors. |
|
Step 10
|
exporter exporter-name
Example: Device(config-flow-monitor)# exporter EXPORTER-1 |
(Optional) Specifies the name of an exporter that was created previously. |
|
Step 11
|
end
Example: Device(config-flow-monitor)# end |
Exits Flexible NetFlow flow monitor configuration mode and returns to privileged EXEC mode. |
|
Step 12
|
show flow monitor [[name] monitor-name [cache [format {csv | record | table}]] [statistics]]
Example: Device# show flow monitor FLOW-MONITOR-2 cache |
(Optional) Displays the status and statistics for a Flexible NetFlow flow monitor. |
|
Step 13
|
show running-config flow monitor monitor-name
Example: Device# show running-config flow monitor FLOW_MONITOR-1 |
(Optional) Displays the configuration of the specified flow monitor. |
Displaying the Current Status of a Flow Monitor
DETAILED STEPS
| Step 1 | enable The enable command enters privileged EXEC mode (enter the password if prompted). Example:
Device> enable
Device#
|
| Step 2 | show flow monitor monitor-name The show flow monitor command shows the current status of the flow monitor that you specify. Example:
Device# show flow monitor FLOW-MONITOR-1

Flow Monitor FLOW-MONITOR-1:
  Description:       Used for basic ipv4 traffic analysis
  Flow Record:       FLOW-RECORD-1
  Flow Exporter:     EXPORTER-1
  Cache:
    Type:              normal
    Status:            allocated
    Size:              1000 entries / 50052 bytes
    Inactive Timeout:  15 secs
    Active Timeout:    1800 secs
    Update Timeout:    1800 secs
|
Displaying the Data in the Flow Monitor Cache
The interface on which you applied the input flow monitor must be receiving traffic that meets the criteria defined by the NetFlow original record before you can display the flows in the flow monitor cache.
DETAILED STEPS
| Step 1 | enable The enable command enters privileged EXEC mode (enter the password if prompted). Example:
Device> enable
Device#
|
| Step 2 | show flow monitor name monitor-name cache format record The show flow monitor name monitor-name cache format record command string displays the status, statistics, and flow data in the cache for a flow monitor. Example: Device# show flow monitor name FLOW-MONITOR-1 cache format record Cache type: Normal Cache size: 1000 Current entries: 4 High Watermark: 4 Flows added: 101 Flows aged: 97 - Active timeout ( 1800 secs) 3 - Inactive timeout ( 15 secs) 94 - Event aged 0 - Watermark aged 0 - Emergency aged 0 IPV4 DESTINATION ADDRESS: 172.16.10.5 ipv4 source address: 10.10.11.1 trns source port: 25 trns destination port: 25 counter bytes: 72840 counter packets: 1821 IPV4 DESTINATION ADDRESS: 172.16.10.2 ipv4 source address: 10.10.10.2 trns source port: 20 trns destination port: 20 counter bytes: 3913860 counter packets: 7326 IPV4 DESTINATION ADDRESS: 172.16.10.200 ipv4 source address: 192.168.67.6 trns source port: 0 trns destination port: 3073 counter bytes: 51072 counter packets: 1824 Device# show flow monitor name FLOW-MONITOR-2 cache format record Cache type: Normal Cache size: 1000 Current entries: 2 High Watermark: 3 Flows added: 95 Flows aged: 93 - Active timeout ( 1800 secs) 0 - Inactive timeout ( 15 secs) 93 - Event aged 0 - Watermark aged 0 - Emergency aged 0 IPV6 DESTINATION ADDRESS: 2001:DB8:4:ABCD::2 ipv6 source address: 2001:DB8:1:ABCD::1 trns source port: 33572 trns destination port: 23 counter bytes: 19140 counter packets: 349 IPV6 DESTINATION ADDRESS: FF02::9 ipv6 source address: FE80::A8AA:BBFF:FEBB:CC03 trns source port: 521 trns destination port: 521 counter bytes: 92 counter packets: 1 |
Verifying the Flow Monitor Configuration
DETAILED STEPS
| Step 1 | enable The enable command enters privileged EXEC mode (enter the password if prompted). Example:
Device> enable
Device#
|
| Step 2 | show running-config flow monitor The show running-config flow monitor command shows the configuration commands of the flow monitor that you specify. Example:
Device# show running-config flow monitor FLOW-MONITOR-1

Current configuration:
!
flow monitor FLOW-MONITOR-1
 description Used for basic ipv4 traffic analysis
 record FLOW-RECORD-1
 exporter EXPORTER-1
 cache entries 1000
!
|
Applying a Flow Monitor to an Interface
Before it can be activated, a flow monitor must be applied to at least one interface. Perform this required task to activate a flow monitor.
DETAILED STEPS
| Command or Action | Purpose | |
|---|---|---|
|
Step 1
|
enable
Example: Device> enable |
Enables privileged EXEC mode.
|
|
Step 2
|
configure terminal
Example: Device# configure terminal |
Enters global configuration mode. |
|
Step 3
|
interface type number
Example: Device(config)# interface GigabitEthernet 0/0/0 |
Specifies an interface and enters interface configuration mode. |
|
Step 4
|
{ip | ipv6} flow monitor monitor-name {input | output}
Example: Device(config-if)# ip flow monitor FLOW-MONITOR-1 input |
Activates a flow monitor that was created previously by assigning it to the interface to analyze traffic. |
|
Step 5
|
Repeat Steps 3 and 4 to activate a flow monitor on any other interfaces in the device over which you want to monitor traffic.
|
-- |
|
Step 6
|
end
Example: Device(config-if)# end |
Exits interface configuration mode and returns to privileged EXEC mode. |
|
Step 7
|
show flow interface type number
Example: Device# show flow interface GigabitEthernet 0/0/0 |
Displays the status of Flexible NetFlow (enabled or disabled) on the specified interface. |
|
Step 8
|
show flow monitor name monitor-name cache format record
Example: Device# show flow monitor name FLOW_MONITOR-1 cache format record |
Displays the status, statistics, and flow data in the cache for the specified flow monitor. |
Verifying That Flexible NetFlow Is Enabled on an Interface
DETAILED STEPS
| Step 1 | enable The enable command enters privileged EXEC mode (enter the password if prompted). Example:
Device> enable
Device#
|
| Step 2 | show flow interface type number The show flow interface command verifies that Flexible NetFlow is enabled on an interface. Example: Device# show flow interface GigabitEthernet 0/0/0 Interface GigabitEthernet0/0/0 FNF: monitor: FLOW-MONITOR-1 direction: Input traffic(ip): on FNF: monitor: FLOW-MONITOR-2 direction: Input traffic(ipv6): on Device# show flow interface GigabitEthernet 1/0/0 Interface GigabitEthernet1/0/0 FNF: monitor: FLOW-MONITOR-1 direction: Output traffic(ip): on FNF: monitor: FLOW-MONITOR-2 direction: Input traffic(ipv6): on |
Configuration Examples for Flexible NetFlow New Flexible NetFlow CLI
Example: Configuring a Normal Flow Record Cache with a Limited Number of Flows
The following example is designed to monitor the type of service (ToS) field usage on all interfaces in the router. An exporter is not configured because this example is intended to be used to capture additional data for analysis on the router using the show flow monitor command.
This example starts in global configuration mode.
!
flow record QOS_RECORD
 description UD: Flow Record to monitor the use of TOS within this router/network
 match interface input
 match interface output
 match ipv4 tos
 collect counter packets
 collect counter bytes
 exit
!
flow monitor QOS_MONITOR
 description UD: Flow Monitor which watches the limited combinations of interface and TOS
 record QOS_RECORD
 cache type normal
 cache entries 8192   ! 2^5 (combos of interfaces) * 256 (values of TOS)
 exit
!
interface GigabitEthernet0/0/0
 ip flow monitor QOS_MONITOR input
 exit
!
interface GigabitEthernet0/1/0
 ip flow monitor QOS_MONITOR input
 exit
!
interface GigabitEthernet0/2/0
 ip flow monitor QOS_MONITOR input
 exit
!
The display from the show flow monitor command shows the current status of the cache.
Router# show flow monitor QOS_MONITOR cache

  Cache type: 										 Normal
  Cache size:                              8192
  Current entries:                            2
  High Watermark:                             2
  Flows added:                                2
  Updates sent         (  1800 secs)          0
Example: Configuring a Customized Flow Record Cache for Monitoring IPv6 Traffic
The following example creates a customized flow record cache for monitoring IPv6 traffic.
This example starts in global configuration mode.
!
ip cef
ipv6 cef
!
flow record FLOW-RECORD-2
 description Used for basic IPv6 traffic analysis
 match ipv6 destination address
 collect counter bytes
 collect counter packets
!
flow monitor FLOW-MONITOR-2
 description Used for basic IPv6 traffic analysis
 record FLOW-RECORD-2
 cache entries 1000
!
interface GigabitEthernet0/0/0
 ipv6 address 2001:DB8:2:ABCD::2/48
 ipv6 flow monitor FLOW-MONITOR-2 input
!
interface GigabitEthernet1/0/0
 ipv6 address 2001:DB8:3:ABCD::1/48
 ipv6 flow monitor FLOW-MONITOR-2 output
!
Example: Configuring Flexible NetFlow Multiple Export Destinations
The following example shows how to configure Flexible NetFlow multiple export destinations.
This example starts in global configuration mode.
!
flow exporter EXPORTER-1
 destination 172.16.10.2
 transport udp 90
 exit
!
flow exporter EXPORTER-2
 destination 172.16.10.3
 transport udp 90
 exit
!
flow monitor FLOW-MONITOR-1
 record netflow-original
 exporter EXPORTER-2
 exporter EXPORTER-1
 exit
!
ip cef
!
interface GigabitEthernet0/0/0
 ip address 172.16.6.2 255.255.255.0
 ip flow monitor FLOW-MONITOR-1 input
!
Additional References
Related Documents
MIBs
Technical Assistance
| Description |
Link |
|---|---|
| The Cisco Support and Documentation website provides online resources to download documentation, software, and tools. Use these resources to install and configure the software and to troubleshoot and resolve technical issues with Cisco products and technologies. Access to most tools on the Cisco Support and Documentation website requires a Cisco.com user ID and password. |
Feature Information for Flexible NetFlow - New Flexible NetFlow CLI
The following table provides release information about the feature or features described in this module. This table lists only the software release that introduced support for a given feature in a given software release train. Unless noted otherwise, subsequent releases of that software release train also support that feature.
Use Cisco Feature Navigator to find information about platform support and Cisco software image support. To access Cisco Feature Navigator, go to www.cisco.com/go/cfn. An account on Cisco.com is not required.
| Table 1 | Feature Information for Flexible NetFlow - New Flexible NetFlow CLI |
| Feature Name |
Releases |
Feature Information |
|---|---|---|
| Flexible NetFlow - New Flexible NetFlow CLI |
Cisco IOS XE Release 3.2SE |
The Flexible NetFlow - New Flexible NetFlow CLI feature introduces the commands used to configure Flexible NetFlow. The following commands were introduced or modified: cache (Flexible NetFlow), clear flow exporter, clear flow monitor, clear sampler, collect counter, collect interface, collect routing, collect timestamp absolute, collect transport tcp, debug flow exporter, debug flow monitor, debug flow record, debug sampler, description (Flexible NetFlow), destination, dscp (Flexible NetFlow), exporter, flow exporter, flow monitor, flow record, ip flow monitor, match flow, match interface (Flexible NetFlow), match ipv4, match ipv4 destination, match ipv4 section, match ipv4 source, match ipv4 ttl, match ipv6, match ipv6 destination, match ipv6 hop-limit, match ipv6 source, match transport, match transport icmp ipv4, match transport icmp ipv6, mode (Flexible NetFlow), option (Flexible NetFlow), record, sampler, show flow exporter, show flow interface, show flow monitor, show flow record, show sampler, source (Flexible NetFlow), template data timeout, transport (Flexible NetFlow). |
Cisco and the Cisco logo are trademarks or registered trademarks of Cisco and/or its affiliates in the U.S. and other countries. To view a list of Cisco trademarks, go to this URL: www.cisco.com/go/trademarks. Third-party trademarks mentioned are the property of their respective owners. The use of the word partner does not imply a partnership relationship between Cisco and any other company. (1110R)
Any Internet Protocol (IP) addresses and phone numbers used in this document are not intended to be actual addresses and phone numbers. Any examples, command display output, network topology diagrams, and other figures included in the document are shown for illustrative purposes only. Any use of actual IP addresses or phone numbers in illustrative content is unintentional and coincidental.
 Feedback