Cisco Wide Area Application Services Monitoring Guide (Software Version 5.0.1)
Bias-Free Language
The documentation set for this product strives to use bias-free language. For the purposes of this documentation set, bias-free is defined as language that does not imply discrimination based on age, disability, gender, racial identity, ethnic identity, sexual orientation, socioeconomic status, and intersectionality. Exceptions may be present in the documentation due to language that is hardcoded in the user interfaces of the product software, language used based on RFP documentation, or language that is used by a referenced third-party product. Learn more about how Cisco is using Inclusive Language.
- Updated:
- March 18, 2015
Chapter: Monitoring WAAS Using Cisco Network Analysis Module
Monitoring WAAS Using Cisco Network Analysis Module
This chapter describes Cisco Network Analysis Module (NAM), which you can use to monitor your WAAS devices.
This chapter contains the following sections:
•![]() Configuring NAM Monitoring of WAAS Devices
Configuring NAM Monitoring of WAAS Devices
•![]() Monitoring and Analyzing Traffic Using the NAM
Monitoring and Analyzing Traffic Using the NAM
Information About NAM
NAM monitors network and application response time (ART) by analyzing the exchanges of TCP packets between clients and application servers. The NAM Traffic Analyzer software enables network managers to understand, manage, and improve how applications and services are delivered to end users by combining flow-based and packet-based analysis into one solution.
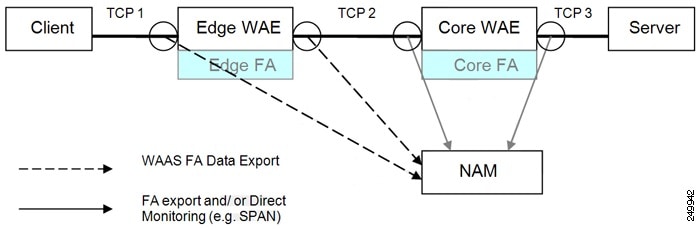
The Cisco NAM includes an embedded, web-based Traffic Analyzer GUI that provides quick access to the configuration menus and presents easy-to-read performance monitoring and analysis on network traffic. A FlowAgent (FA) runs on WAAS devices to collect TCP packet data and send the flow data to NAM for analyzing and reporting. See Figure 5-1.
Figure 5-1 NAM Monitoring of WAAS Devices
For more information about NAM, see the following documentation URLs:
•![]() Complete NAM documentation set:
Complete NAM documentation set:
http://www.cisco.com/en/US/products/sw/cscowork/ps5401/tsd_products_support_series_home.html
•![]() Cisco WAAS NAM Virtual Service Blade Installation and Configuration Guide:
Cisco WAAS NAM Virtual Service Blade Installation and Configuration Guide:
http://www.cisco.com/en/US/products/sw/cscowork/ps5401/prod_installation_guides_list.html
Information About NAM Monitoring Functions
NAM provides the following monitoring functions:
•![]() Monitoring Client-Edge Connections—By monitoring the TCP connections between the clients and the WAAS edge device (connection TCP-1 in Figure 5-1), the following ART metrics can be measured:
Monitoring Client-Edge Connections—By monitoring the TCP connections between the clients and the WAAS edge device (connection TCP-1 in Figure 5-1), the following ART metrics can be measured:
–![]() Total Delay (TD) as experienced by the client
Total Delay (TD) as experienced by the client
–![]() Total Transaction Time as experienced by the client
Total Transaction Time as experienced by the client
–![]() Bandwidth usage (bytes/packets) before compression
Bandwidth usage (bytes/packets) before compression
–![]() Number of transactions and connections
Number of transactions and connections
–![]() Network round-trip time (RTT) broken down into two segment: client-edge and edge-server
Network round-trip time (RTT) broken down into two segment: client-edge and edge-server
•![]() Monitoring Edge-Core Optimized Connections—By monitoring the spoofed TCP connections between the edge and core WAAS devices (connection TCP-2 in Figure 5-1), the following additional ART metric can be measured: Bandwidth usage (bytes/packets) after compression.
Monitoring Edge-Core Optimized Connections—By monitoring the spoofed TCP connections between the edge and core WAAS devices (connection TCP-2 in Figure 5-1), the following additional ART metric can be measured: Bandwidth usage (bytes/packets) after compression.
•![]() Monitoring Edge-Core Connections—By monitoring the TCP connections between the core WAAS devices and the servers (connection TCP-3 in Figure 5-1), additional ART metrics can be measured:
Monitoring Edge-Core Connections—By monitoring the TCP connections between the core WAAS devices and the servers (connection TCP-3 in Figure 5-1), additional ART metrics can be measured:
–![]() Application (Server) Delay (without the proxy acceleration/caching server)
Application (Server) Delay (without the proxy acceleration/caching server)
–![]() Network RTT between the core WAAS device and the servers
Network RTT between the core WAAS device and the servers
The sections that follow show how to configure WAAS to enable monitoring by NAM and how to configure NAM to monitor specific WAAS functions.
Configuring NAM Monitoring of WAAS Devices
This section contains the following topics:
•![]() Configuring WAAS Monitored Servers
Configuring WAAS Monitored Servers
•![]() Configuring WAAS Data Sources in NAM
Configuring WAAS Data Sources in NAM
Configuring Basic WAAS Setup
Before you can monitor WAAS traffic, you must first set up basic NAM configuration by completing the following tasks:
•![]() Connect to a NAM server by providing the server's IP address, protocol, and port.
Connect to a NAM server by providing the server's IP address, protocol, and port.
•![]() Establish account credentials.
Establish account credentials.
•![]() Associate a WAAS device group or WAAS Express device group with configured policies.
Associate a WAAS device group or WAAS Express device group with configured policies.
•![]() Enable Flow Agent.
Enable Flow Agent.
Follow the steps below to complete basic NAM configuration. Only device group level policy configurations are applicable for NAM.
Step 1 ![]() From the WAAS Central Manager, choose Configure > Network Analysis Module > Basics > Setup. The Setup window appears. (See Figure 5-2).
From the WAAS Central Manager, choose Configure > Network Analysis Module > Basics > Setup. The Setup window appears. (See Figure 5-2).
Figure 5-2 NAM Setup Window
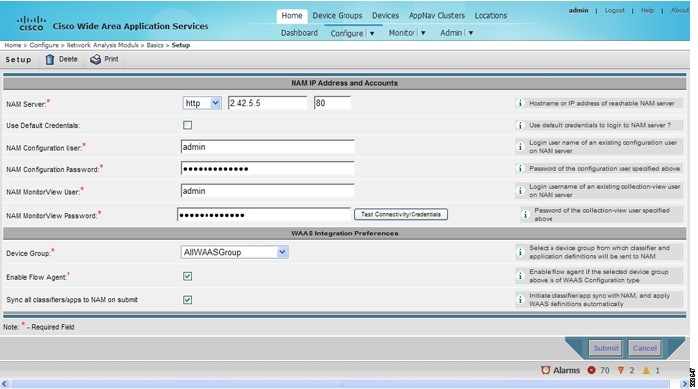
Step 2 ![]() Choose either HTTP or HTTPS, depending on which access was configured during NAM installation.
Choose either HTTP or HTTPS, depending on which access was configured during NAM installation.
Step 3 ![]() Enter the hostname and IP address of the NAM server.
Enter the hostname and IP address of the NAM server.
Step 4 ![]() Configure the credentials: use the preconfigured login credentials by selecting the Use Default Credentials option, or configure the credentials manually by filling in the fields with valid values.
Configure the credentials: use the preconfigured login credentials by selecting the Use Default Credentials option, or configure the credentials manually by filling in the fields with valid values.
Step 5 ![]() Configure the WAAS Integration Preferences to configure a WAAS device group to work with the NAM server as follows:
Configure the WAAS Integration Preferences to configure a WAAS device group to work with the NAM server as follows:
a. ![]() Choose the device group from which applications and classifier definitions are pushed to the NAM when performing a synchronization operation.
Choose the device group from which applications and classifier definitions are pushed to the NAM when performing a synchronization operation.
b. ![]() Choose the Enable Flow Agent option to data export.
Choose the Enable Flow Agent option to data export.
c. ![]() Choose the Sync all classifiers/apps to NAM on submit to initiate synchronization with the NAM.
Choose the Sync all classifiers/apps to NAM on submit to initiate synchronization with the NAM.
Step 6 ![]() Click Submit.
Click Submit.
For additional information about configuring NAM, see the NAM chapter in the Cisco Wide Area Application Services Configuration Guide.
Configuring WAAS Monitored Servers
To monitor the response time for a server, you need to add the server IP address in the NAM configuration setup, as follows:
Step 1 ![]() From the WAAS Central Manager menu, choose Configure > Network Analysis Module > Basics > Monitored Servers. The NAM WAAS Servers Monitoring window appears. See Figure 5-3.
From the WAAS Central Manager menu, choose Configure > Network Analysis Module > Basics > Monitored Servers. The NAM WAAS Servers Monitoring window appears. See Figure 5-3.
Figure 5-3 WAAS Servers Monitoring Window
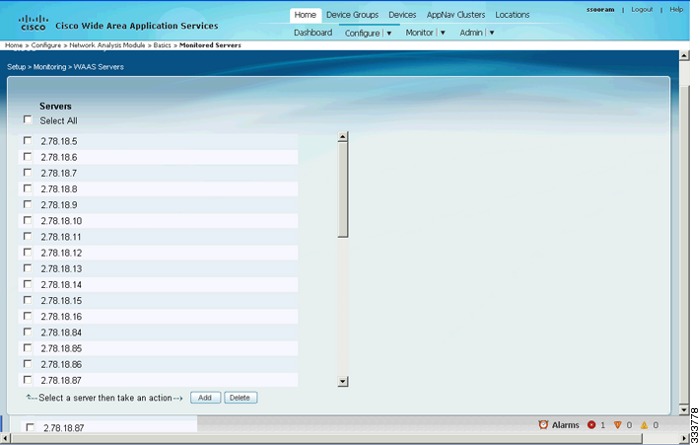
Step 2 ![]() Choose the IP address of one or more servers to monitor.
Choose the IP address of one or more servers to monitor.
Step 3 ![]() Click Add. The Add WAAS Servers(s) window appears.
Click Add. The Add WAAS Servers(s) window appears.
Step 4 ![]() Click Submit to add the server IP address(es).
Click Submit to add the server IP address(es).
Configuring WAAS Data Sources in NAM
You usually don't need to add WAAS devices because export-enabled WAAS devices are detected and added automatically.
To manually add a WAAS device to the list of devices monitored by NAM, follow these steps:
Step 1 ![]() From the WAAS Central Manager menu, choose Configure > Network Analysis Module > Basics > Monitored Servers. The NAM Data Source Configuration window appears. (See Figure 5-4).
From the WAAS Central Manager menu, choose Configure > Network Analysis Module > Basics > Monitored Servers. The NAM Data Source Configuration window appears. (See Figure 5-4).
Figure 5-4 NAM Data Sources
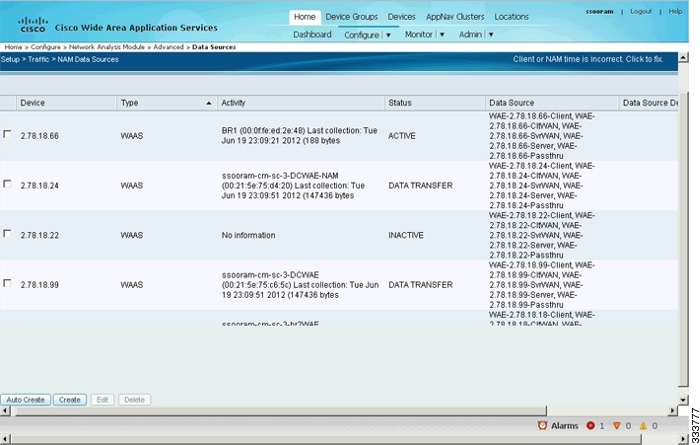
Step 2 ![]() From the list of Types, choose WAAS device.
From the list of Types, choose WAAS device.
Step 3 ![]() In the IP field, enter the device IP address.
In the IP field, enter the device IP address.
Step 4 ![]() Check the check boxes for the data sources that you want to monitor. See Table 5-1 for more information.
Check the check boxes for the data sources that you want to monitor. See Table 5-1 for more information.
Step 5 ![]() Click Submit to add the new data source.
Click Submit to add the new data source.
For additional information about configuring and using NAM, see the User Guide for Cisco Network Analysis Module Traffic Analyzer.
NAM Deployment Scenarios
The NAM uses WAAS data sources to monitor traffic collected from different WAAS segments: Client, Client WAN, Server WAN, and Server. Each WAAS segment is represented by a data source. You can set up the NAM to monitor and report other traffic statistics of the WAAS data sources (such as application, host, and conversation information) in addition to the monitored ART metrics.
The use of the data source depends upon on the WAAS deployment scenario. Table 5-2 describes several common WAAS deployment scenarios and their applicable data sources.
Monitoring and Analyzing Traffic Using the NAM
The monitoring and analyzing traffic using the NAM feature provides intuitive workflows and interactive reporting capabilities.
The monitoring and analyzing dashboards allow you to view network traffic, application performance, site performance, and alarms at a glance. From there, you can isolate one area, for example an application with response time issues, and then drill down to the dashboard for further investigation.
The section contains the following topics:
•![]() Performance Analysis Dashboards
Performance Analysis Dashboards
NAM Metrics
You can use the NAM to report a variety of metrics, depending on which data sources you are monitoring, as shown in Table 5-3.
You can also configure data sources from the core WAE. You can add the Server, Server-WAN, and Passthrough data sources to monitor application performance analytics as observed from the server LAN, WAN, and the client LAN.
Top Talkers Dashboards
This section includes the following topics:
Traffic Summary
The Top Talkers Summary dashboard allows you to view the Top N Applications, Top N Application Groups, Top N Hosts (In and Out), IP Distribution by Bytes, Top N DSCP, and Top N VLAN that is being monitored on your network. It provides auto-monitoring of traffic from all WAAS devices. You can view the Traffic Summary Dashboard by going to Monitor > Network Analysis Module > Overview. (See Figure 5-5).
Figure 5-5 NAM Monitoring Overview
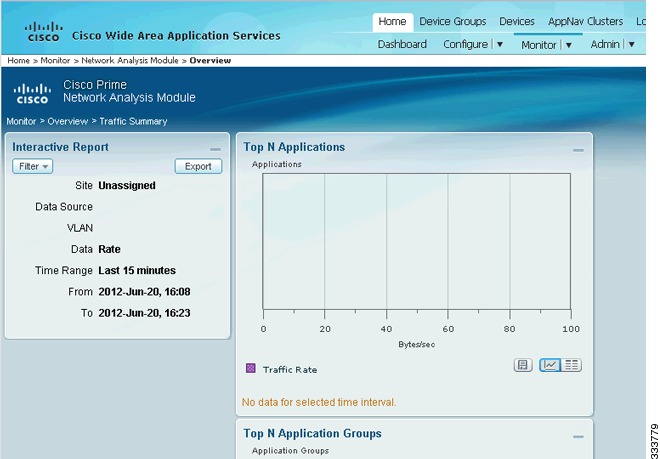
The charts shown on this dashboard are as follows:
•![]() Top N Applications
Top N Applications
The Top N Applications Chart enables you to view the traffic rate (bytes per second or bits per second) or traffic volume (bytes or bits), depending on the Interactive Report filter selection (data rate or cumulative, respectively).
•![]() Top N Application Groups
Top N Application Groups
This chart shows a detailed analysis of the Top N application groups and the traffic rate or volume for this interval.
•![]() Top N Hosts (In and Out)
Top N Hosts (In and Out)
This chart displays the traffic rate (bytes per second or bits per second) or traffic volume (bytes or bits).
•![]() IP Distribution by Bytes
IP Distribution by Bytes
This chart shows the percentages of bytes that are distributed to IP protocols (for example, IPv4 TCP).
•![]() Top N DSCP
Top N DSCP
This chart shows statistics for the top DSCP aggregation groups.
•![]() Top N VLAN
Top N VLAN
This chart shows the Top N VLAN statistics. In this chart, you might see VLAN 0, which is for traffic that does not have any VLAN tags.
Top Talkers Details
While you are in the process of deploying WAAS devices, you can get data to assist in the WAAS planning and configuration.
When you go to Monitor > Network Analysis Module > Top Talkers Details, you will see the window that assists you in the predeployment process. Use the Interactive Report window to select the traffic you want to analyze for optimization. The window displays the Top Applications, Top Network Links, Top Clients, and Top Servers.
Based on the results, you can then configure the WAAS products to optimize your network.
Throughput Dashboards
This section includes the following topics:
Network
The Network dashboard enables you to view LAN versus WAN throughput for WAAS users both in the incoming and outgoing directions. To view these reports, configure interface groups that comprise WAN and LAN interfaces. The displayed information represents the total data collected since the collection was created or since the NAM was restarted. To view the Network dashboard, go to Monitor > Network Analysis Module > Throughput > Network.
Choose an interface group view from the Interface Selector on the left side of the window to see traffic in the charts. Click the arrow icon to the left of the NDE data source name to display all interfaces groups, and then select an interface group view. If the charts show no data, and you see the message "Interface needs to be selected," you have not yet chosen an interface group view.
After you choose the interface group view, you see the following charts populated:
•![]() Interface Traffic (Ingress % Utilization and Egress % Utilization)
Interface Traffic (Ingress % Utilization and Egress % Utilization)
•![]() Top N Applications—Ingress
Top N Applications—Ingress
•![]() Top N Applications—Egress
Top N Applications—Egress
•![]() Top N Hosts—Ingress
Top N Hosts—Ingress
•![]() Top N Hosts—Egress
Top N Hosts—Egress
•![]() Top N DSCP Aggr—Ingress
Top N DSCP Aggr—Ingress
•![]() Top N DSCP Aggr—Egress
Top N DSCP Aggr—Egress
You can enter the interface speed manually through the Interface capacity table, or the speed can be automatically configured if the SNMP settings for the NDE device are entered in the data source table.
Top Applications
In the Top Applications dashboard, you can view the top applications by the traffic rate over a selected time and for the specified site and/or data source.
Applications Over Time shows you all of the applications that have been running for the time period interval. The color-coded legend shows you what the applications are running.
Application
In the Application Analysis window, you can see the traffic level for a given application over a selected period of time. It is available under the Monitor > Network Analysis Module > Throughput > Application. This window shows you the following:
•![]() A graph of application traffic over time.
A graph of application traffic over time.
•![]() Top hosts that transmit and receive traffc on that application for the selected time period.
Top hosts that transmit and receive traffc on that application for the selected time period.
•![]() Application Configuration that shows the criteria by which the NAM classifies packets as that application. This criteria is typically a list of TCP and/or UDP ports that identify the application. Some applications are identified by heuristic or other state-based algorithms.
Application Configuration that shows the criteria by which the NAM classifies packets as that application. This criteria is typically a list of TCP and/or UDP ports that identify the application. Some applications are identified by heuristic or other state-based algorithms.
Hosts Detail
On the "Top N Hosts - Traffic In" or "Top N Hosts - Traffic Out" chart, you can choose Hosts Detail to see the All Hosts window and the detailed information about all hosts. The All Hosts window displays the following information:
•![]() Hos—Host address
Hos—Host address
•![]() Application—Application type
Application—Application type
•![]() In Bytes/sec—Number of bytes per second incoming
In Bytes/sec—Number of bytes per second incoming
•![]() In Packets/sec—Number of packets per second incoming
In Packets/sec—Number of packets per second incoming
•![]() Out Bytes/sec—Number of bytes per second outgoing
Out Bytes/sec—Number of bytes per second outgoing
•![]() Out Packets/sec—Number of packets per second outgoing
Out Packets/sec—Number of packets per second outgoing
Performance Analysis Dashboards
This section includes the following topics:
Application
The Application dashboard provides the transaction time performance for an application as well as the original and optimized traffic volume reported by the flow agent. Information about how the transaction time is broken up across client, WAN, and server segments is also provided. For example, if the transaction time is dominated by the server segment time (due to a slow server), WAAS may not be able to improve the performance as much as when it is dominated by the WAN network time. To view the Application performance analysis dashboard, go to Monitor > Network Analysis Module > Performance Analysis > Application.
The charts available on this dashboard are as follows:
•![]() Transaction Time (Client Experience)
Transaction Time (Client Experience)
•![]() Traffic Volume and Compression Ratio
Traffic Volume and Compression Ratio
•![]() Average Concurrent Connections (Optimized vs. Passthru)
Average Concurrent Connections (Optimized vs. Passthru)
•![]() Multi-Segment Network Time (Client LAN - WAN - Server LAN)
Multi-Segment Network Time (Client LAN - WAN - Server LAN)
Conversation Multisegments
The Conversation Multiple Segments dashboard correlates data from different data sources and allows you to view and compare response time metrics from multiple WAAS segments (data sources). To view the Conversation Multiple Segments dashboard, go to Monitor > Network Analysis Module > Performance Analysis > Conversation Multisegments.
The Response Time Across Multiple Segments window shows the response time metrics of the selected server or client-server pair from applicable data sources.
 Feedback