Cisco Wide Area Application Services Monitoring Guide (Software Version 5.0.1)
Bias-Free Language
The documentation set for this product strives to use bias-free language. For the purposes of this documentation set, bias-free is defined as language that does not imply discrimination based on age, disability, gender, racial identity, ethnic identity, sexual orientation, socioeconomic status, and intersectionality. Exceptions may be present in the documentation due to language that is hardcoded in the user interfaces of the product software, language used based on RFP documentation, or language that is used by a referenced third-party product. Learn more about how Cisco is using Inclusive Language.
- Updated:
- June 28, 2012
Chapter: Monitoring WAAS Using WAAS Central Manager
- Accessing the Central Manager
- Using the WAAS System Dashboard
- Viewing Alarms
- Viewing Device Information
- Viewing Monitoring Reports
- Monitoring Logs and System Messages
- Viewing System Properties
- Running CLI Commands from the WAAS Central Manager GUI
- show cms info Command
- show wccp status Command Output
- show wccp statistics Command Output
- show statistics connection Command Output
- show statistics connection optimized http Command Output
- show statistics dre Command Output
- show statistics tfo Command Output
- show interface GigabitEthernet Command Output
- show ip access-list Command Output
Monitoring WAAS Using WAAS Central Manager
This chapter describes how to use WAAS Central Manager to monitor network health, device health, and traffic interception of your WAAS system.
This chapter contains the following sections:
•![]() Accessing the Central Manager
Accessing the Central Manager
•![]() Using the WAAS System Dashboard
Using the WAAS System Dashboard
•![]() Monitoring Logs and System Messages
Monitoring Logs and System Messages
•![]() Running CLI Commands from the WAAS Central Manager GUI
Running CLI Commands from the WAAS Central Manager GUI
For more information about using WAAS Central Manager, see the "Monitoring and Troubleshooting Your WAAS Network" chapter in the Cisco Wide Area Application Services Configuration Guide.
Accessing the Central Manager
From a secure web browser, log in to WAAS Central Manager using either its hostname or IP address on port 8443 as follows:
https://CM-Host-Name_or_IP Address:8443
You must have proper username and password credentials to log in to WAAS Central Manager.
You initially open to a view of the WAAS System Dashboard, from which you can monitor your WAAS system. When you choose a device from the Devices menu, you move to the a view of the Device Dashboard, from which you can monitor specific device activity and performance.
Using the WAAS System Dashboard
The WAAS Central Manager GUI allows you to view general and detailed information about your WAAS network from the System Dashboard window, which is shown in Figure 1-1.
Figure 1-1 System Dashboard Window
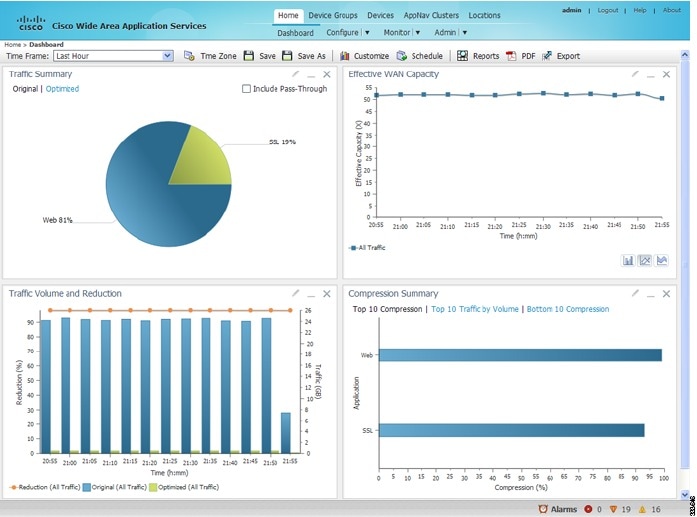
The dashboard provides a snapshot of your WAAS network. You can use the menu at the top of the dashboard window to view more detailed information about your devices, and to configure, monitor, and administer your network.
The Alarms section of the dashboard, in the gray status bar area at the bottom right of the window, provides instant access to any alarms, as described in the "Viewing Alarms" section.
Viewing Alarms
The Alarms panel at the bottom right side of the Central Manager window provides a near real-time view of incoming alarms and refreshes every two minutes to reflect updates to the system alarm database. The alarms are classified as Critical, Major, or Minor depending on the impact the issue might have upon the WAAS environment. You can click Alarms to display the panel, which is shown in Figure 1-2.
Figure 1-2 Alarms Panel
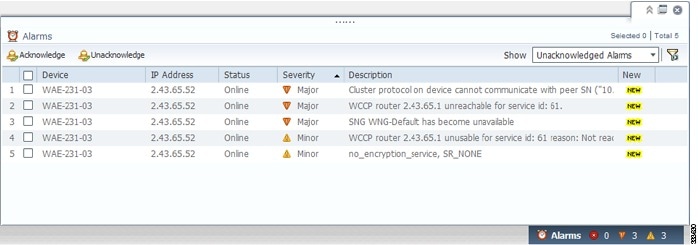
The Alarms panel contains a filtering option that allows you to control which alarms are shown in the panel. You can check the check box next to an alarm name, and then click the Acknowledge taskbar icon to enter any comments you have about the alarm.
For a complete list of alarm conditions, see the Alarm Book located in the WAAS Software Download area on Cisco.com.
Viewing Device Information
The WAAS Central Manager GUI allows you to view basic and detailed information about a device from the following two windows:
•![]() Devices Window—Displays a list of all the devices in your WAAS network with basic information about each device such as the device status and the current software version installed on the device.
Devices Window—Displays a list of all the devices in your WAAS network with basic information about each device such as the device status and the current software version installed on the device.
•![]() Device Dashboard Window—Displays detailed information about a specific device, and provides menu access to reports and other information about the device.
Device Dashboard Window—Displays detailed information about a specific device, and provides menu access to reports and other information about the device.
Devices Window
The Devices window displays a list of all the devices in your WAAS network with basic information about each device such as the device status and the current software version installed on the device. You can use either of these actions to display the Devices window:
•![]() Click the Devices menu in the Central Manager window.
Click the Devices menu in the Central Manager window.
•![]() Roll over the Devices menu in the Central Manager window and click All Devices.
Roll over the Devices menu in the Central Manager window and click All Devices.
An example of the Devices window is shown in Figure 1-3.
Figure 1-3 Devices Window

This window displays information about each device, including its management status, which is one of the following: Online, Offline, Pending, or Inactive. If a device's status is offline, you can use the command-line interface to verify its status and its participation in traffic optimization. For more information, see the "Running CLI Commands from the WAAS Central Manager GUI" section.
The Devices window also displays the device status for each device in your network in an alarm light bar, which has one of the following values:
•![]() Green—No alarms (the system is in excellent health)
Green—No alarms (the system is in excellent health)
•![]() Yellow—Minor alarms
Yellow—Minor alarms
•![]() Orange—Major alarms
Orange—Major alarms
•![]() Red—Critical alarms
Red—Critical alarms
If the device status is anything other than green, you can roll over the light bar to see a popup message with further details about the status. If you click the popup message, the Troubleshooting Devices window is displayed (see Figure 1-4).
Figure 1-4 Troubleshooting Devices Window
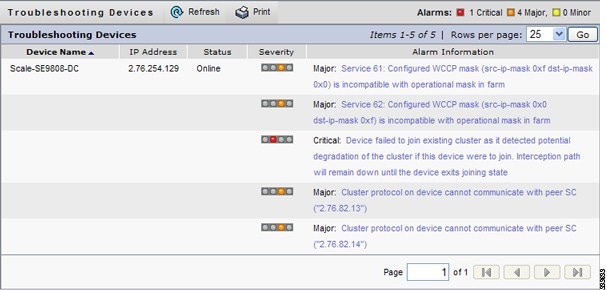
When you roll over an Alarm Information message, a set of troubleshooting links displays in the top part of the window to help you with tracking down the problem. Table 1-1 shows the links you may see.
|
|
|
|---|---|
Update Software |
Displays the Software Update window for this device. This link appears only if the device software version is lower than the Central Manager. |
Edit/Monitor Device |
Displays the Device Dashboard window for configuration. |
Telnet to Device |
Initiates a Telnet session using the device IP address. |
View Device Log |
Displays system message logs filtered for this device. |
Run Show Commands |
Displays the device show command tool. For more information, see the "Running CLI Commands from the WAAS Central Manager GUI" section. |

Note ![]() You can view the Troubleshooting Devices window for all devices by choosing Monitor > Troubleshoot > Alerts from the global context.
You can view the Troubleshooting Devices window for all devices by choosing Monitor > Troubleshoot > Alerts from the global context.
Device Dashboard Window
The Device Dashboard window provides detailed information about a WAAS device such as the device model, IP address, interception method, and device-specific charts. (See Figure 1-5.)
To access the Device Dashboard window, choose Devices > device-name.
Note ![]() When you are using the Device Dashboard, the menu choices that are available are different than when you are using the System Dashboard.
When you are using the Device Dashboard, the menu choices that are available are different than when you are using the System Dashboard.
Figure 1-5 Device Dashboard Window
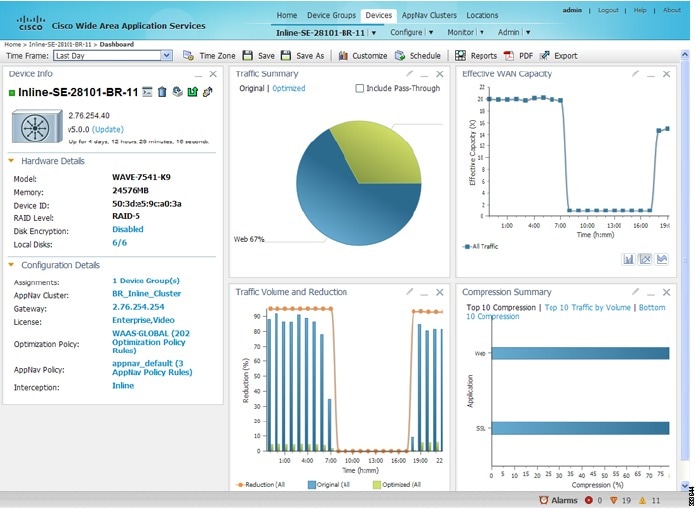
The Device Dashboard window provides an overview of the device, including hardware and configuration details, and summaries of its traffic and compression statistics. You can initiate a number of device-specific actions from this window, including:
•![]() Click the Update link (if shown) to update the software on the device.
Click the Update link (if shown) to update the software on the device.
•![]() Click the Telnet icon to establish a Telnet session into the device and issue CLI commands.
Click the Telnet icon to establish a Telnet session into the device and issue CLI commands.
•![]() Click other icons to delete, reboot, or update the configuration of the device.
Click other icons to delete, reboot, or update the configuration of the device.
•![]() Click the Device-Name menu and then select actions such as assigning the device to a device group or viewing and unlocking which users have access to the device.
Click the Device-Name menu and then select actions such as assigning the device to a device group or viewing and unlocking which users have access to the device.
•![]() Click the Edit icon in a chart to modify which data is shown.
Click the Edit icon in a chart to modify which data is shown.
•![]() Click the Customize icon in the task bar to customize charts and reports.
Click the Customize icon in the task bar to customize charts and reports.
Note ![]() The Device Dashboard window for a WAAS Express device looks slightly different. It lacks some WAE-specific information and controls.
The Device Dashboard window for a WAAS Express device looks slightly different. It lacks some WAE-specific information and controls.
Viewing Monitoring Reports
The WAAS Central Manager GUI provides access to a number of reports you can use to monitor your network. Some reports display system-wide monitoring information, while others are only available from the Device Dashboard to display device-specific information.
This section contains the following topics:
For more information about the available monitoring reports, see the "Monitoring and Troubleshooting Your WAAS Network" chapter in the Cisco Wide Area Application Services Configuration Guide.
Viewing Network Reports
You can monitor overall system information in the WAAS Central Manager GUI with several system-level reports. This section provides examples of these reports:
•![]() Viewing Network Summary Information
Viewing Network Summary Information
For more information, see the "Monitoring and Troubleshooting Your WAAS Network" chapter in the Cisco Wide Area Application Services Configuration Guide.
Viewing Network Summary Information
The Network Summary Report provides you with an overall view of network health and performance. To display this report, choose Monitor > Network > Summary Report in the System Dashboard. Figure 1-6 shows an example report.
Figure 1-6 Network Summary Report
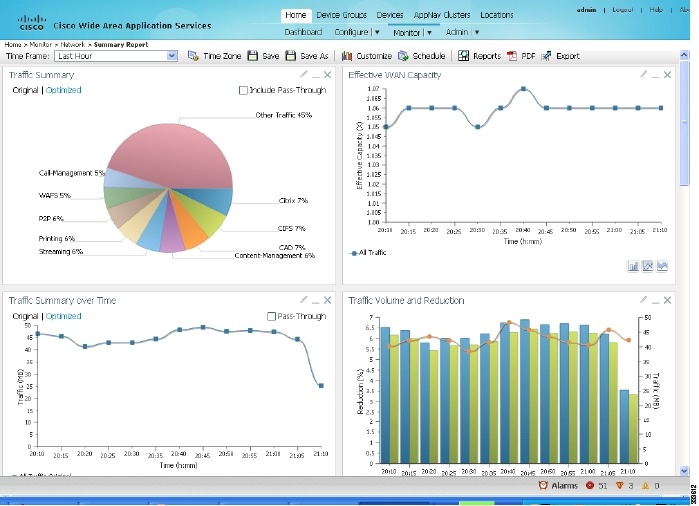
The Network Summary Report includes summary information about traffic, capacity, compression, and network applications.
Viewing Network Topology
You can use the Network Topology Report (see Figure 1-7) at the system level to display a graphical representation of all connections between WAAS devices. At the device level, the topology report lists all peer devices connected to a specific WAE, so you can see the relationship between devices in your WAAS network.
To view this report, choose Monitor > Network > Topology in either the System Dashboard or the Device Dashboard.
Figure 1-7 Topology Report
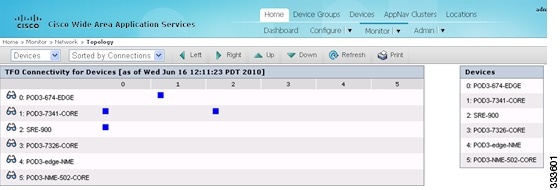
The topology information is important for troubleshooting and for deployment-sizing exercises, especially for large deployments where any site-to-site communication is required.
Viewing Optimization Reports
You can view connection optimization statistics for your network connections in the Central Manager GUI. This section contains the following topics:
•![]() Viewing Connection Statistics
Viewing Connection Statistics
For more information about optimization statistics and reports, see the "Monitoring and Troubleshooting Your WAAS Network" chapter in the Cisco Wide Area Application Services Configuration Guide.
Viewing TCP Statistics
You can use the TCP Summary Report to view a summary of TCP optimization statistics for your WAAS system (from the System Dashboard) or for a specific device (from the Device Dashboard). Figure 1-5 shows an example of the report.
To display this report, choose Monitor > Optimization > TCP Summary Report from either dashboard. The report contains the following optimization charts:
•![]() Traffic Summary
Traffic Summary
•![]() Effective WAN Capacity
Effective WAN Capacity
•![]() Traffic Volume and Reduction
Traffic Volume and Reduction
•![]() Compression Summary
Compression Summary
•![]() Traffic Summary over Time
Traffic Summary over Time
•![]() Compression Summary over Time
Compression Summary over Time
•![]() Network Traffic Summary
Network Traffic Summary
Viewing Connection Statistics
You can use the Connection Statistics Report to view all of the TCP connections handled by a device, as seen in Figure 1-8. To display this report, choose Monitor > Optimization > Connection Statistics in the Device Dashboard.
Figure 1-8 Connection Statistics Report
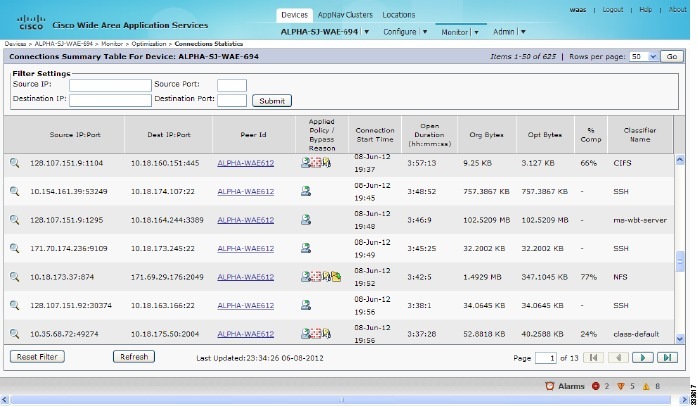
The table lists all the active connections served by the selected WAE. The output provides key details about the flow by highlighting type of traffic, peer ID, percent compression, applied policies, and so forth.
To view additional connection details for a specific connection, click the magnifying glass icon to the left of the connection. The Connection Details Report appears, as shown in Figure 1-9.
Figure 1-9 Connection Details Report
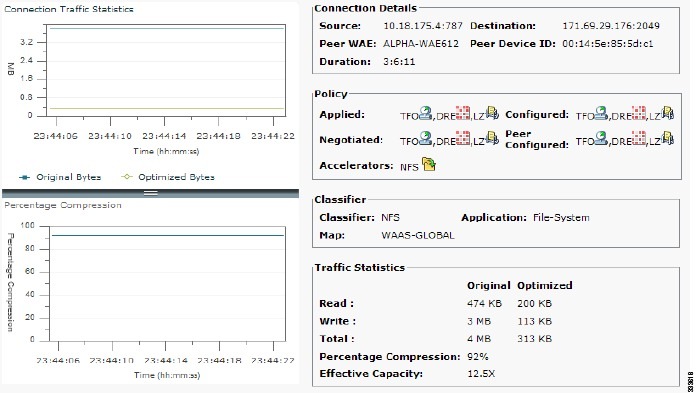
The Connection Details Report provides connection addresses, port information, policy information, and traffic statistics. The report window also displays graphs that plot real-time traffic statistics; these statistics are refreshed every two seconds.
Viewing Connection Trends
You can use the Connection Trend Report to view all of the traffic processed by a device, as seen in Figure 1-10. To display this report, choose Monitor > Optimization > Connection Trend Report in the Device Dashboard.
Figure 1-10 Connection Trend Report
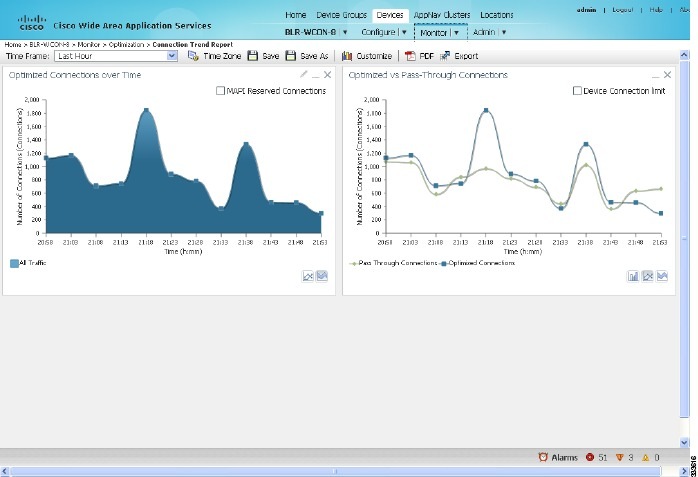
The Connection Trend Report provides data on the optimized and pass-through connections of all the traffic processed on the device. You can use this data to monitor the connection trends of all the applications on the device.
Viewing Acceleration Reports
The WAAS Central Manager GUI provides a number of statistical reports to help you monitor the performance boosts provided by different application accelerators.
This provides an example of one acceleration report:
•![]() Viewing HTTPS Acceleration Statistics
Viewing HTTPS Acceleration Statistics
Similar reports are available for all of the available accelerators.
For more information, including a complete list of acceleration reports, see the "Monitoring and Troubleshooting Your WAAS Network" chapter in the Cisco Wide Area Application Services Configuration Guide.
Viewing HTTPS Acceleration Statistics
The HTTPS Acceleration Report, shown in Figure 1-11, displays details about HTTPS acceleration in your network (in the System Dashboard) or for a specific device (in the Device Dashboard). To view this report, choose Monitor > Acceleration > HTTPS Acceleration Report in either dashboard.
Figure 1-11 HTTPS Acceleration Report

Viewing AppNav Reports
You can use the AppNav Report to monitor the status of an AppNav controller by choosing Monitor > AppNav Report from the Device Dashboard.
The AppNav Report shows a number of statistics about AppNav performance, as seen in Figure 1-12.
Figure 1-12 AppNav Report
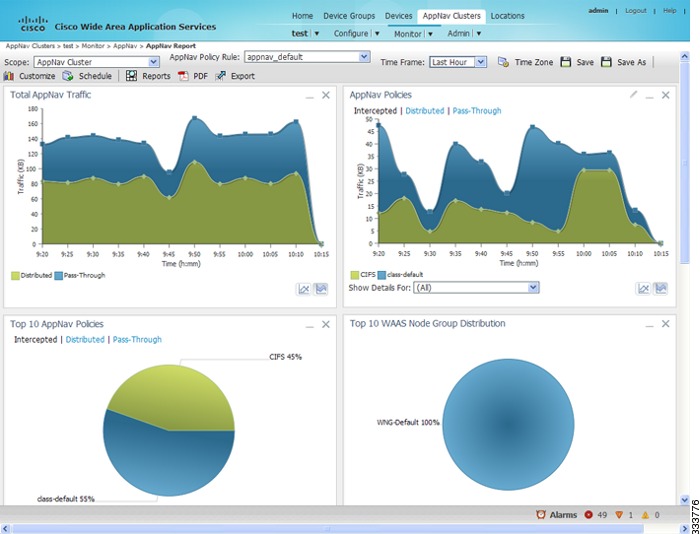
You can view information about intercepted and pass-through traffic, top AppNav policies, and the top reasons for AppNav distributing or passing data through.
Viewing Platform Reports
The platform reports allow you to monitor resource and utilization for your network. This section shows an example of one platform report: the Resource Utilization Report.
You can view resource utilization for a device by choosing Monitor > Platform > Resource Utilization in the Device Dashboard (see Figure 1-13).
Figure 1-13 Resource Utilization Report
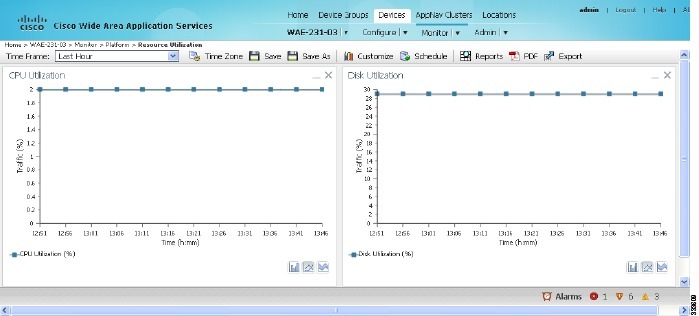
The resource utilization report shows the percentage of CPU usage and disk utilization for the device.
Monitoring Logs and System Messages
The WAAS Central Manager logs information and messages about events and actions so you can track what has happened in your WAAS network. This section contains the following topics:
•![]() Viewing the System Message Log
Viewing the System Message Log
For more information, see the "Monitoring and Troubleshooting Your WAAS Network" chapter in the Cisco Wide Area Application Services Configuration Guide.
Viewing the System Message Log
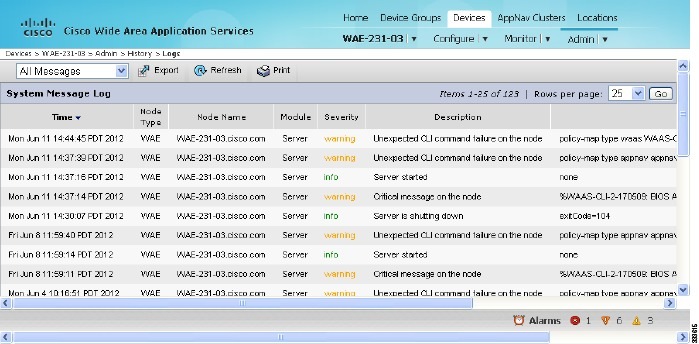
You can use the system message log feature of the WAAS Central Manager GUI to view information about events that have occurred in your WAAS network. To view this log, an example of which is shown in Figure 1-14, choose Admin > Logs > System Messages in the System Dashboard.
Figure 1-14 System Message Log Window
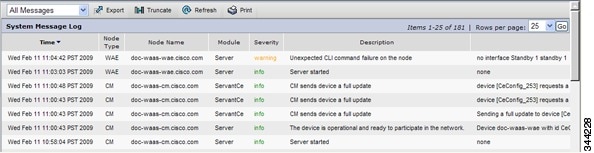
You can customize which messages are shown the log and how many lines to display in the log window.
Viewing the Audit Trail Log
Any time an activity changes the WAAS network, the Central Manager audits that user activity, storing the time and action taken into a log. You can view this audit trail (see Figure 1-15) by choosing Admin > Logs > Audit Trail Log in the System Dashboard.
Figure 1-15 Audit Trail Log Window
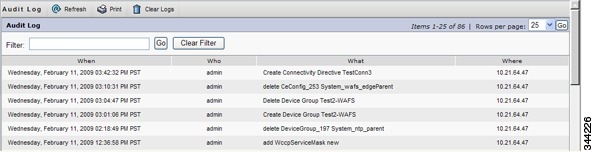
Note that you can add filtering and select the number of rows to display in the log window.
Viewing the Device Log
You can view audit information for a specific device (see Figure 1-16) in your WAAS network by choosing Admin > Logs > Device Logs from the Device Dashboard window.
Figure 1-16 Device Log Window
You can add filtering and select the number of rows to display in the log window. You can also export the log to a comma-separated values (csv) file.
Viewing System Properties
You can view and modify the current system properties by choosing Configure > System Properties from the System Dashboard. The Config Properties window appears (see Figure 1-17).
Figure 1-17 System Properties Window
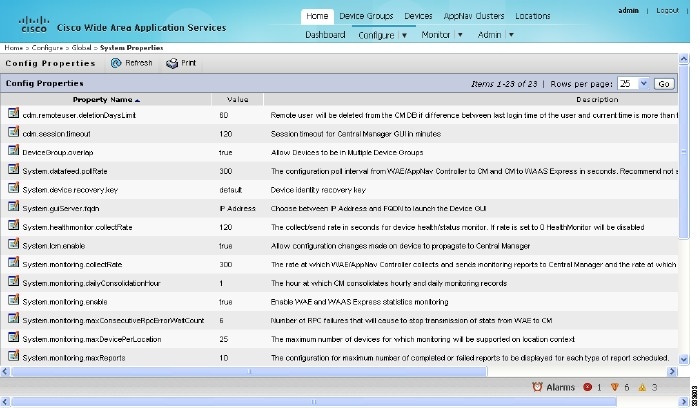
For more information, see the Cisco Wide Area Application Services Configuration Guide chapter on "Configuring Other System Settings."
Running CLI Commands from the WAAS Central Manager GUI
To run command-line interface (CLI) commands from the WAAS Central Manager GUI, first select a device in the dashboard, and then choose Monitor > CLI Commands > Show Commands.
The CLI includes numerous show commands, which are described in detail in the Cisco Wide Area Application Services Command Reference.
This section provides examples of several of the show commands, to give you an idea of the kind of information you can display. To access the show commands, follow these steps:
Step 1 ![]() Select a device in the dashboard.
Select a device in the dashboard.
Step 2 ![]() Choose Monitor > CLI Commands > Show Commands. The WAAS Show Commands window displays.
Choose Monitor > CLI Commands > Show Commands. The WAAS Show Commands window displays.
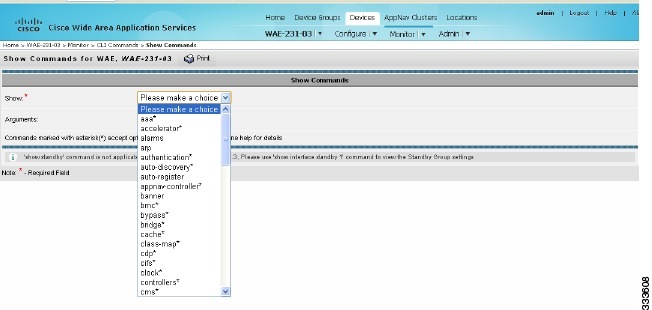
Step 3 ![]() Choose which command you want to run from the Show Commands dropdown list, as shown in Figure 1-18.
Choose which command you want to run from the Show Commands dropdown list, as shown in Figure 1-18.
Step 4 ![]() Add any required or optional options for the command.
Add any required or optional options for the command.
Step 5 ![]() Click Submit.
Click Submit.
The command output displays in a popup window.
Figure 1-18 WAAS Show Commands
This section contains the following topics:
•![]() show wccp status Command Output
show wccp status Command Output
•![]() show wccp statistics Command Output
show wccp statistics Command Output
•![]() show statistics connection Command Output
show statistics connection Command Output
•![]() show statistics connection optimized http Command Output
show statistics connection optimized http Command Output
•![]() show statistics dre Command Output
show statistics dre Command Output
•![]() show statistics tfo Command Output
show statistics tfo Command Output
•![]() show interface GigabitEthernet Command Output
show interface GigabitEthernet Command Output
•![]() show ip access-list Command Output
show ip access-list Command Output
show cms info Command
The show cms info command output provides the WAE registration information with the last configuration synchronization time with WAAS Central Manager, which is useful when you suspect an application policy configuration issue.
WAE-231-03# show cms info
Device registration information :
Device Id = 3806
Device registered as = WAAS Appnav Controller
Current WAAS Central Manager = 2.43.65.50
Registered with WAAS Central Manager = 2.43.65.50
Status = Online
Time of last config-sync = Fri Jun 8 05:27:47 2012
CMS services information :
Service cms_ce is running
show wccp status Command Output
The show wccp status command output displays the current status of WCCP, including which services are enabled on the device.
WAE-231-03# show wccp status
WCCP Interception :
Configured State : Enabled
Services Enabled on this WAE:
TCP Promiscuous 61
TCP Promiscuous 62
The show wccp command can be used with different options. For more information about using this command, see the Cisco Wide Area Application Services Command Reference.
show wccp statistics Command Output
The show wccp statistics command output includes three packets received counters, one of which should be incrementing to indicate that the WAE is receiving redirected packets.
WAE-231-03# show wccp statistics
Transparent GRE packets received: 0 <<< Packet received counters
Transparent non-GRE packets received: 212389542 <<<
Transparent non-GRE non-WCCP packets received: 0 <<<
Total packets accepted: 158369766 <<<
Invalid packets received: 0
Packets received with invalid service: 0
Packets received on a disabled service: 0
Packets received too small: 0
Packets dropped due to zero TTL: 0
Packets dropped due to bad buckets: 42
Packets dropped due to no redirect address: 0
Packets dropped due to loopback redirect: 0
Pass-through pkts on non-owned bucket: 0
Connections bypassed due to load: 0 <<< Bypass counter
Packets sent back to router: 3
GRE packets sent to router (not bypass): 0
Packets sent to another WAE: 0
...
If the device is under heavy load and no new flows can be optimized, the Connections bypassed due to load counter increments. A nonzero value for this counter indicates that the device is under overload or has previously gone into overload and should be further investigated.
show statistics connection Command Output
The show statistics connection command output displays all connection statistics for a WAAS device.
sjc22-00a-WAE-674# show statistics connection
Current Active Optimized Flows: 7
Current Active Optimized TCP Plus Flows: 2
Current Active Optimized TCP Only Flows: 12
Current Active Optimized TCP Preposition Flows: 0
Current Active Auto-Discovery Flows: 16
Current Reserved Flows: 40
Current Active Pass-Through Flows: 25
Historical Flows: 597
D:DRE,L:LZ,T:TCP Optimization RR:Total Reduction Ratio
A:AOIM,C:CIFS,E:EPM,G:GENERIC,H:HTTP,I:ICA,M:MAPI,N:NFS,S:SSL,W:WAN SECURE,V:VID
EO
X: SMB Signed Connection
ConnID Source IP:Port Dest IP:Port PeerID Accel RR
445095 10.34.209.79:54455 199.47.216.147:80 58:8d:09:d1:bc:c1 THDL 87.1%
447076 10.34.209.123:50028 171.70.151.151:1344 58:8d:09:d1:bc:c1 TG 00.0%
447268 10.34.209.106:56632 171.71.160.68:445 58:8d:09:d1:bc:c1 TCDL 07.9%
447293 10.34.209.123:63628 172.25.210.42:22 58:8d:09:d1:bc:c1 T 00.0%
447296 10.34.209.106:62564 128.107.191.124:12834 58:8d:09:d1:bc:c1 TG 00.0%
447349 10.34.215.74:31787 10.32.176.206:7878 00:21:5e:76:1d:64 TL 04.8%
447350 10.34.209.106:64183 128.107.191.124:12834 58:8d:09:d1:bc:c1 TG 00.0%
...
The show statistics command can be used with different options. For more information about using this command, see the Cisco Wide Area Application Services Command Reference.
show statistics connection optimized http Command Output
The show statistics connection optimized http command output displays the connection optimized by the http application accelerator.
sjc22-00a-WAE-674# show statistics connection optimized http
Current Active Optimized Flows: 14
Current Active Optimized TCP Plus Flows: 2
Current Active Optimized TCP Only Flows: 11
Current Active Optimized TCP Preposition Flows: 0
Current Active Auto-Discovery Flows: 16
Current Reserved Flows: 40
Current Active Pass-Through Flows: 27
Historical Flows: 593
D:DRE,L:LZ,T:TCP Optimization RR:Total Reduction Ratio
A:AOIM,C:CIFS,E:EPM,G:GENERIC,H:HTTP,I:ICA,M:MAPI,N:NFS,S:SSL,W:WAN SECURE,V:VID
EO
X: SMB Signed Connection
ConnID Source IP:Port Dest IP:Port PeerID Accel RR
445095 10.34.209.79:54455 199.47.216.147:80 58:8d:09:d1:bc:c1 THDL 87.2%
The show statistics connection optimized command can be used with different options. For more information about using this command, see the Cisco Wide Area Application Services Command Reference.
show statistics dre Command Output
The show statistics dre command output displays overall Data Redundancy Eliminate (DRE) statistics. The command output includes compression ratios for both encode and decode and details about DRE age, cache size available, and used percentage.
sjc22-00a-WAE-674# show statistics dre
Cache:
Status: Usable, Oldest Data (age): 739d
Total usable disk size: 311289 MB, Used: 35.12% <<< Cache
Connections: Total (cumulative): 428069 Active: 18
Encode:
Overall: msg: 8879839, in: 36648 MB, out: 19474 MB, ratio: 46.86% <<< Encode
DRE: msg: 8294549, in: 36366 MB, out: 21154 MB, ratio: 41.83%
DRE Bypass: msg: 6273500, in: 278 MB
LZ: msg: 6917737, in: 10361 MB, out: 8365 MB, ratio: 19.26% <<< LZ
LZ Bypass: msg: 1962102, in: 11071 MB
Avg latency: 0.335 ms, Avg msg size: 4327 B
Message size distribution:
0-1K=18% 1K-5K=65% 5K-15K=7% 15K-25K=4% 25K-40K=3% >40K=1%
Decode:
Overall: msg: 2677837, in: 615 MB, out: 2931 MB, ratio: 79.00% <<< Decode
DRE: msg: 1511198, in: 648 MB, out: 2296 MB, ratio: 71.75%
DRE Bypass: msg: 2346105, in: 635 MB
LZ: msg: 1254878, in: 401 MB, out: 1089 MB, ratio: 63.15% <<< LZ
LZ Bypass: msg: 1422959, in: 214 MB
Avg latency: 0.059 ms, Avg msg size: 1148 B
Message size distribution:
0-1K=85% 1K-5K=9% 5K-15K=1% 15K-25K=1% 25K-40K=2% >40K=0%
The show statistics dre command can be used with the detail option to show more detailed information.
show statistics tfo Command Output
The show statistics tfo command output displays Traffic Flow Optimization (TFO) statistics for a WAE.
sjc22-00a-WAE-674# show statistics tfo
Total number of connections : 428073
No. of active connections : 21
No. of pending (to be accepted) connections : 0
No. of bypass connections : 135585
No. of normal closed conns : 301317
No. of reset connections : 126735
Socket write failure : 1060
Socket read failure : 0
WAN socket close while waiting to write : 285
AO socket close while waiting to write : 205
WAN socket error close while waiting to read : 0
AO socket error close while waiting to read : 6435
DRE decode failure : 0
DRE encode failure : 0
Connection init failure : 0
WAN socket unexpected close while waiting to read : 57305
Exceeded maximum number of supported connections : 0
Buffer allocation or manipulation failed : 0
Peer received reset from end host : 59283
DRE connection state out of sync : 0
Memory allocation failed for buffer heads : 0
Unoptimized packet received on optimized side : 2162
...
The show statistics tfo command can be used with different options. For more information about using this command, see the Cisco Wide Area Application Services Command Reference.
show interface GigabitEthernet Command Output
The show interface GigabitEthernet command displays GigabitEthernet interface device information. A speed and duplex mismatch is one of the most common reasons for poor performance.
WAE-231-03# show interface GigabitEthernet 1/0
Description this is my interception interface
lsp: Link State Propagation
flow sync: AppNav Controller is in the process of flow sync
Ethernet Address : 50:3d:e5:9d:ea:79
Internet Address : --
Netmask : --
Admin State : Down
Operation State : Down
Maximum Transfer Unit Size : 1500
Input Errors : 0
Input Packets Dropped : 0
Packets Received : 0
Output Errors : 0
Output Packets Dropped : 0
Load Interval : 30
Input Throughput : 0 bits/sec, 0 packets/sec
Output Throughput : 0 bits/sec, 0 packets/sec
Packets Sent : 0
Auto-negotiation : On <<< Auto-negotiate status
Full Duplex : Yes <<< Full duplex status
Speed : 1000 Mbps <<< Speed
Interception Statistics
Input Packets Forwarded/Bridged : 0
Input Packets Redirected : 0
Input Packets Punted : 0
Input Packets Dropped : 0
Output Packets Forwarded/Bridged : 0
Output Packets Injected : 0
Output Packets Dropped : 0
The show interface command can be used with different options. For more information about using this command, see the Cisco Wide Area Application Services Command Reference.
show ip access-list Command Output
The show ip access-list command displays the access lists that are defined and applied to specific interfaces or appliances on a WAAS device.
WAE-231-03# show ip access-list
Space available:
49 access lists
499 access list conditions
32619 TCAM Entries
Standard IP access list myacl
1 permit 192.168.1.0 0.0.0.255
(implicit deny any: 0 matches, SN=0, ANC=0)
total invocations: 0 (SN=0, ANC=0)
[Legend: SN = Service Node ACL Hits, ANC = AppNav Controller ACL Hits]
Interface access list references:
None Configured
Application access list references:
No applications registered.
 Feedback