Introduction
This document describes the steps required to integrate, verify, and troubleshoot the integration of SecureX with Web Security Appliance (WSA)
Prerequisites
Requirements
Cisco recommends that you have knowledge of these topics:
- Web Security Appliance (WSA)
- Optional Virtualization of images
Components Used
- Web Security Appliance (WSA)
- Security Services Exchange (SSE)
- SecureX Portal
The information in this document was created from the devices in a specific lab environment. All of the devices used in this document started with a cleared (default) configuration. If your network is live, ensure that you understand the potential impact of any command.
Configure
Required URLs per Region for SecureX
Validate the WSA appliance has reachability to the URLs on port 443:
US Region
EU Region
Note: If access to SecureX with an Asia Pacific, Japan, and China URL (https://visibility.apjc.amp.cisco.com/), the integration with the appliance is not currently supported.
Prepare your WSA for SSE registration
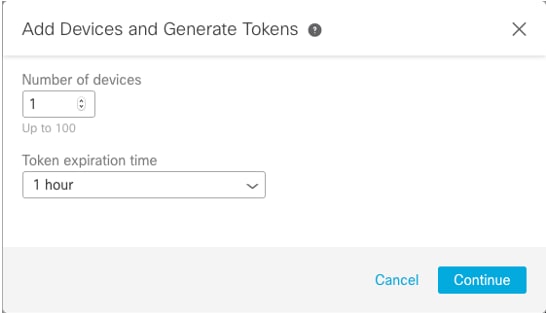
1.- On the SSE Portal, navigate to Devices and then click on the (+) Add Devices and Generate Tokens icon, as shown in the image:
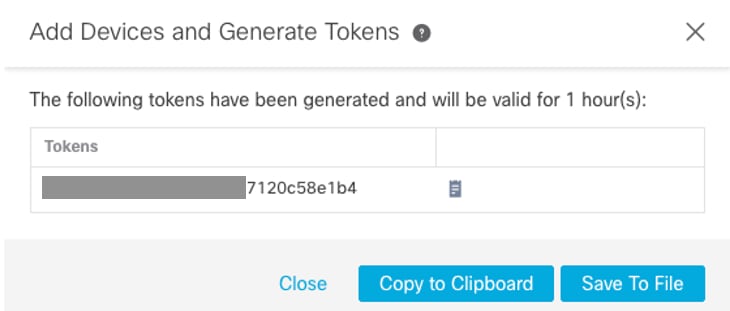
2.- Click continue and the token for the WSA is generated, as shown in the image.
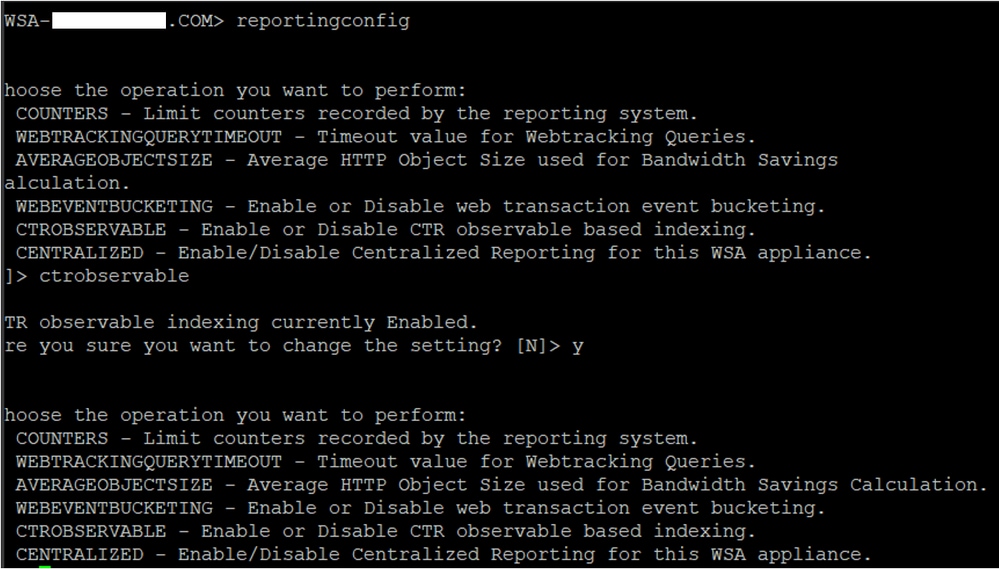
3.- Enable CTROBSERVABLE in the WSA command-line interface (CLI), under REPORTINGCONFIG you can find the option to enable CTROBSERVABLE, as shown in the image:
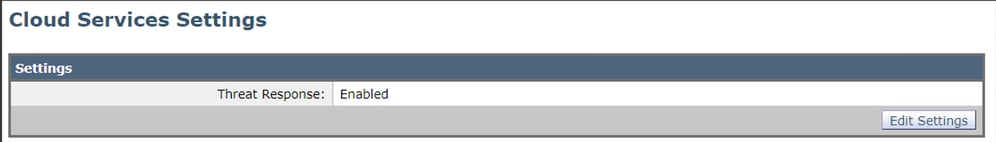
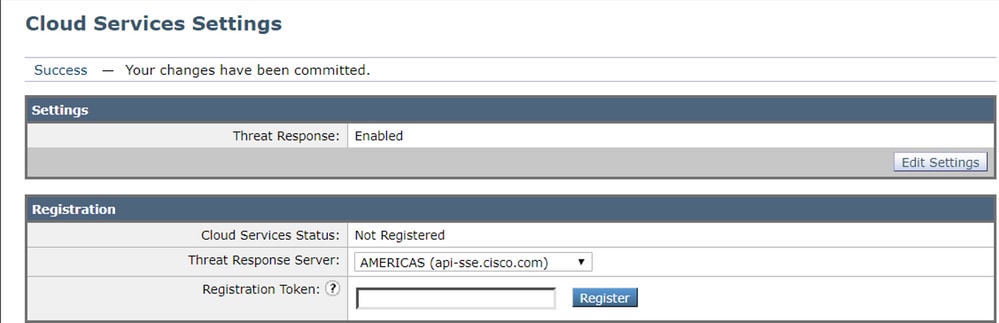
4.- Enable the Security Service Exchange (SSE) cloud portal, Navigate to Network >Cloud Services Settings > Edit settings, click Enable and Submit, as shown in the image:
5.- Select the cloud you want to connect to:
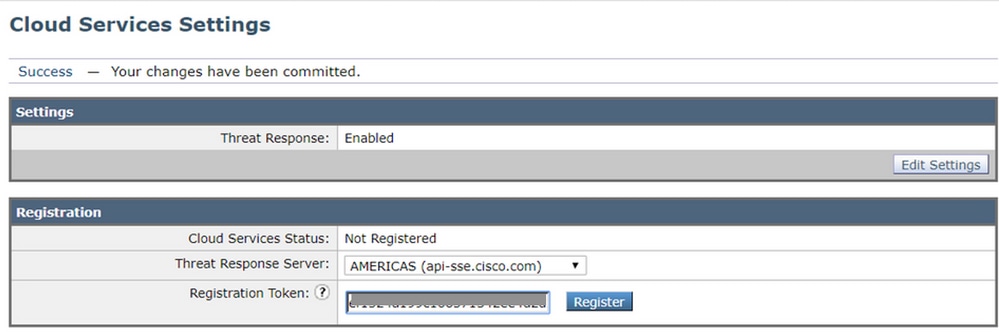
6.- Enter the token you generated on SEE (ensure you use the token before the expiration time):
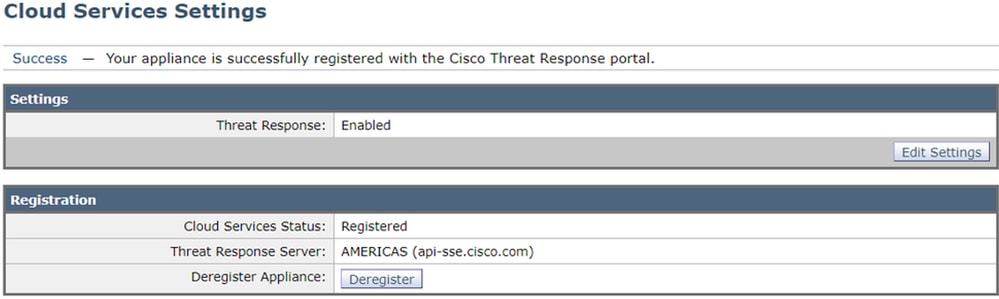
7.- Once the token is registered, you see a message that indicates the device is successfully registered
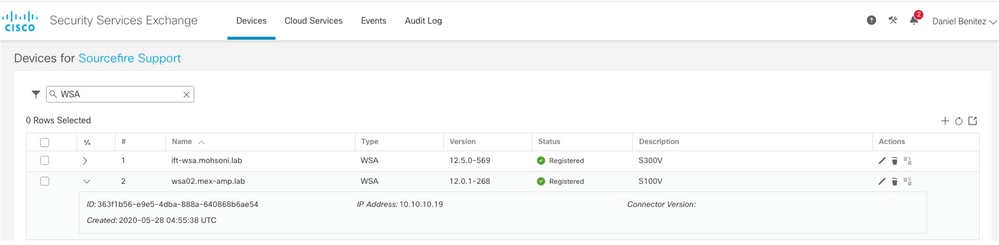
8.- After this, you see the device registered on SSE portal:
Integrate your device to SecureX
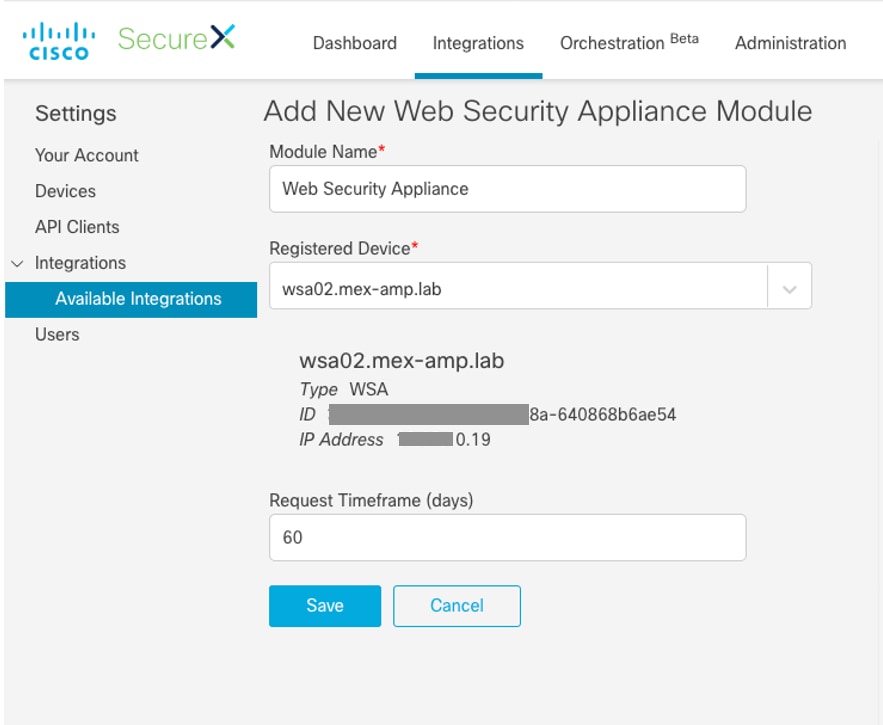
Step 1. To integrate the WSA with SecureX, navigate to Integrations>Add New module and select Web Security Appliance, then select your device, set up the Request Timeframe, and click Save, as shown in the image.
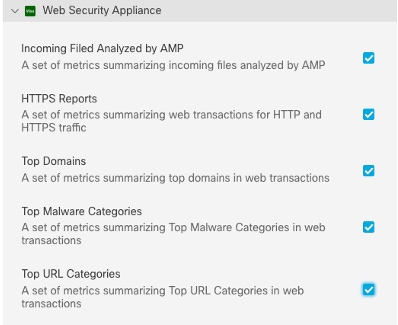
Step 2. To create your Dashboard, click the + New Dashboard icon, select a name and Tile that you want to use for the Dashboard.
Verify
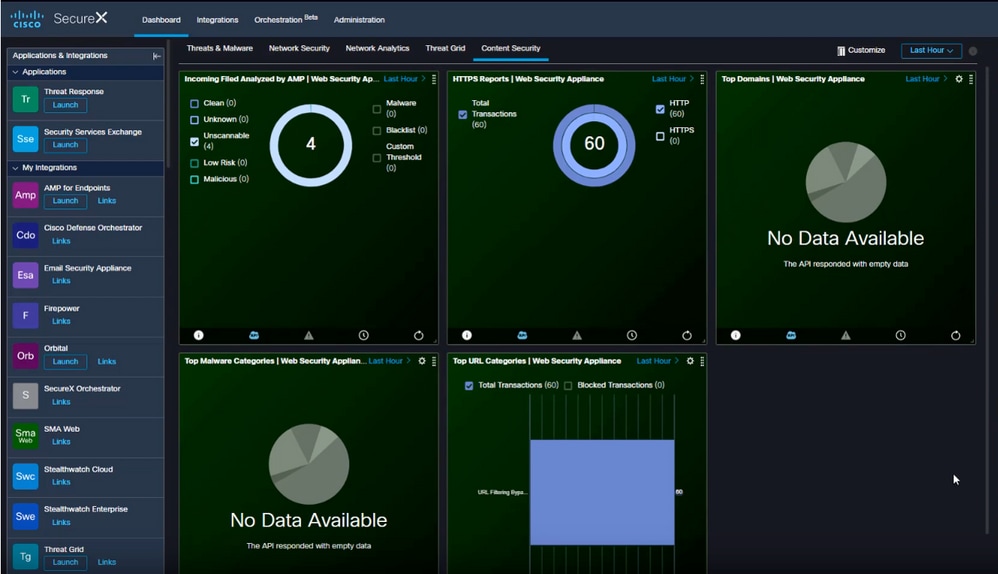
After you perform the integration you can see the Dashboard information populated form SSE, you can click on any of the Threats detected and the SSE portal is launched with the Event Type filter on it.
Troubleshoot
Validate device enrollment from CLI
Step 1. Run the curl command in the backend to check the connection status. Look for the status field under exchange from the curl output along with fields like FQDN(Fully qualified domain name), enrolment. The registered device is in the enrolled state:
/usr/local/bin/curl -XGET -v http://localhost:8823/v1/contexts/default
  "exchange": [
                     {
                      "type": "registration",
                      "status": "Enrolled",
                      "name": "",
                      "description": "Device has been enrolled."
Step 2. From this output you can also check the queries made from the connector:
type": "administration",
         "statistics": {
            "transactionsProcessed": 20,
           "failedTransactions": 0,
           "lastFailedTransaction": "0001-01-01T00:00:00Z",
            "requestFetchFailures": 0,
            "responseUploadFailures": 0,
            "commandsProcessed": 20,
            "commandsFailed": 0,
            "lastFailedCommand": "0001-01-01T00:00:00Z"
Step 3. You can also check the heartbeats made from the connector to SSE (5 minutes by default):
refresh": {
              "registration": {
                "timestamp": "2010-06-29T03:51:45Z",
                "timeTaken": 1.387869786,
                "successCount": 6,
                "failureCount": 0
Step 4. In order to check the Connector logs on WSA, you need to navigate to:
/data/pub/sse_connectord_logs/sse_connectord_log.current
The information that can be found in the sse_connectord_log.current
- Registration transaction with SSE
- Logs fro an Enrichment Query
- Logs for deregistration with the SSE Portal
Video
You can find the information contained in this document in this video

 Feedback