Cisco Annual Internet Report (2018–2023) White Paper
Available Languages
Bias-Free Language
The documentation set for this product strives to use bias-free language. For the purposes of this documentation set, bias-free is defined as language that does not imply discrimination based on age, disability, gender, racial identity, ethnic identity, sexual orientation, socioeconomic status, and intersectionality. Exceptions may be present in the documentation due to language that is hardcoded in the user interfaces of the product software, language used based on RFP documentation, or language that is used by a referenced third-party product. Learn more about how Cisco is using Inclusive Language.
The Cisco Annual Internet Report is a global forecast/analysis that assesses digital transformation across various business segments (enterprise, small-to-medium business, public sector, and service provider). The report covers fixed broadband, Wi-Fi, and mobile (3G, 4G, 5G) networking. Quantitative projections are provided on the growth of Internet users, devices and connections as well as network performance and new application requirements. Qualitative analyses and assessments are also provided in four strategic areas: applications, security, infrastructure transformation, and empowering employees and teams.
Global Internet adoption and devices and connection
Internet users
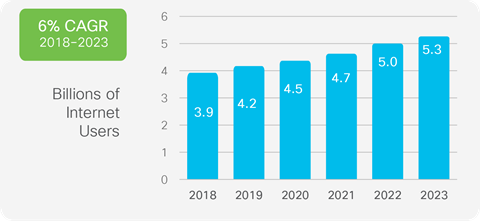
Nearly two-thirds of the global population will have Internet access by 2023. There will be 5.3 billion total Internet users (66 percent of global population) by 2023, up from 3.9 billion (51 percent of global population) in 2018.
Devices and connections
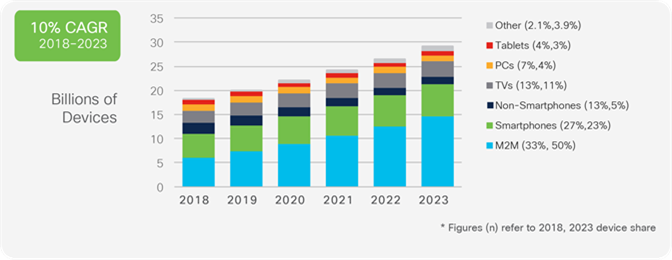
The number of devices connected to IP networks will be more than three times the global population by 2023. There will be 3.6 networked devices per capita by 2023, up from 2.4 networked devices per capita in 2018. There will be 29.3 billion networked devices by 2023, up from 18.4 billion in 2018.
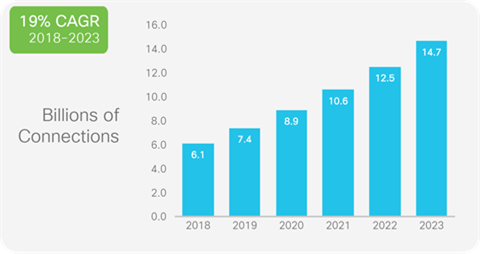
M2M connections will be half of the global connected devices and connections by 2023. The share of Machine-To-Machine (M2M) connections will grow from 33 percent in 2018 to 50 percent by 2023. There will be 14.7 billion M2M connections by 2023.
The consumer segment will have nearly three-fourths share of total devices and connections by 2023. Globally, consumer segment’s share of total devices and connections will be 74 percent, with the business segment claiming the remaining 26 percent.
Internet of Things (IoT) by application
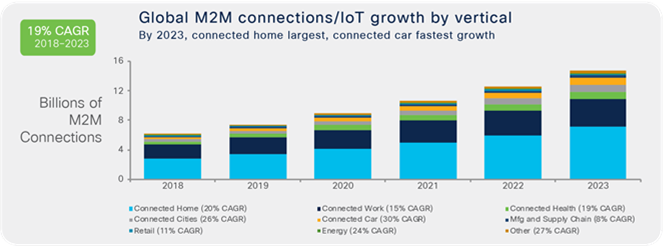
Within the M2M connections category (which is also referred to as IoT), connected home applications will have the largest share and connected car will be the fastest growing application type. Connected home applications will have nearly half or 48 percent of M2M share by 2023 and Connected car applications will grow the fastest at 30 percent CAGR over the forecast period (2018–2023).
Mobility growth
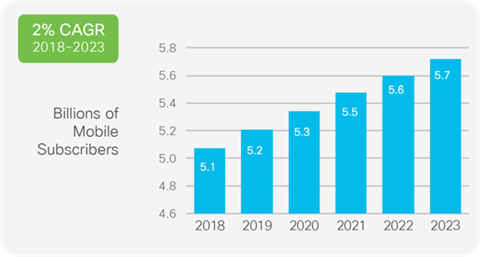
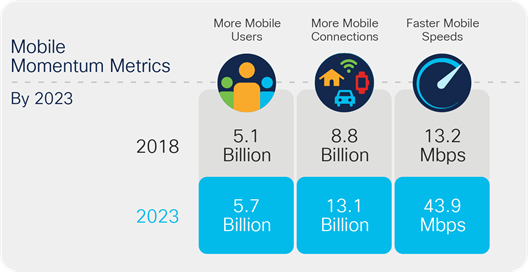
Over 70 percent of the global population will have mobile connectivity by 2023. The total number of global mobile subscribers will grow from 5.1 billion (66 percent of population) in 2018 to 5.7 billion (71 percent of population) by 2023.
5G devices and connections will be over 10 percent of global mobile devices and connections by 2023. By 2023, global mobile devices will grow from 8.8 billion in 2018 to 13.1 billion by 2023 – 1.4 billion of those will be 5G capable.
The fastest growing mobile device category is M2M followed by smartphones. The mobile M2M category is projected to grow at a 30 percent CAGR from 2018 to 2023. Smartphones will grow at a 7 percent CAGR within the same period.
Global network performance
Accelerating speeds
Fixed broadband speeds will more than double by 2023. By 2023, global fixed broadband speeds will reach 110.4 Mbps, up from 45.9 Mbps in 2018.
Mobile (cellular) speeds will more than triple by 2023. The average mobile network connection speed was 13.2 Mbps in 2018 and will be 43.9 Mbps by 2023.
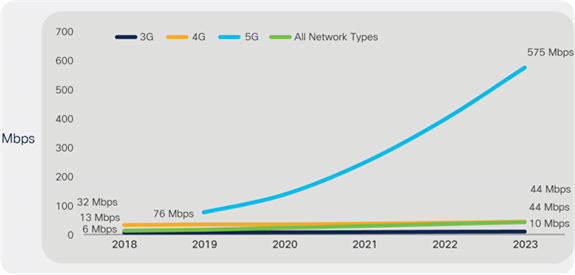
5G speeds will be 13 times higher than the average mobile connection by 2023. The average 5G connection speed will reach 575 Mbps by 2023.
Wi-Fi speeds from mobile devices will triple by 2023. Globally, the average Wi-Fi speeds will grow from 30.3 Mbps in 2018 to 92 Mbps by 2023.
Tiered pricing (Mobile)
The usage per month of the average top 1 percent of mobile users is steadily decreasing. Globally, the top 1 percent of mobile users generated 5 percent of mobile data in 2019. Back in 2010, the top 1 percent of mobile users generated 52 percent of mobile data.
Mobile applications
Nearly 300 million mobile applications will be downloaded by 2023. Globally, 299.1 billion mobile applications will be downloaded by 2023. Social media, gaming and business applications will be the most popular downloads.
Wi-Fi momentum
Wi-Fi hotspots will grow four-fold from 2018 to 2023. Globally, there will be nearly 628 million public Wi-Fi hotspots by 2023, up from 169 million hotspots in 2018.
Wi-Fi6 hotspots will grow 13-fold from 2020 to 2023 and will be 11 percent of all public Wi-Fi hotspots by 2023.
Security analysis
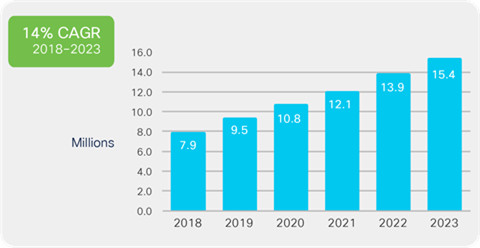
The number of breaches and total records exposed per breach continue to grow. Globally, there was a 776% growth in attacks between 100 Gbps and 400 Gbps Y/Y from 2018 to 2019, and the total number of DDoS attacks will double from 7.9 million in 2018 to 15.4 million by 2023.
Regional summaries
This section provides regional summaries for Internet users, devices and connections, and network performance. The Cisco Annual Internet Report covers six distinct geographic regions (in alphabetical order): Asia Pacific (APAC), Central and Eastern Europe (CEE), Latin America (LATAM), Middle East and Africa (MEA), North America (NA) and Western Europe (WE). Summary of regional growth rates:
● Asia Pacific (APAC)
◦ By 2023, APAC will have 3.1 billion Internet users (72 percent of regional population), up from 2.1 billion (52 percent of regional population) in 2018.
◦ By 2023, APAC will have 3.1 billion mobile users (72 percent of regional population), up from 2.7 billion (65 percent of regional population) in 2018.
◦ By 2023, APAC will have 13.5 billion networked devices/connections, up from 8.6 billion in 2018.
◦ By 2023, APAC will have 49 percent of all networked devices mobile-connected and 51 percent will be wired or connected over Wi-Fi.
◦ By 2023, APAC’s average fixed broadband speed will reach 157.1 Mbps, which represents 2.5-fold growth from 2018 (62.8 Mbps).
◦ By 2023, APAC’s average mobile connection speed will reach 45.7 Mbps, which represents 3.2-fold growth from 2018 (14.3 Mbps).
◦ By 2023, APAC’s average Wi-Fi speeds from mobile devices will reach 116 Mbps, which represents 3.4-fold growth from 2018 (34.5 Mbps).
● Central and Eastern Europe (CEE)
◦ By 2023, CEE will have 388 million Internet users (78 percent of regional population), up from 323 million (65 percent of population) in 2018.
◦ By 2023, CEE will have 404 million mobile users (81 percent of regional population), up from 394 million (79 percent of regional population) in 2018.
◦ By 2023, CEE will have 2.0 billion networked devices/connections, up from 1.2 billion in 2018.
◦ By 2023, CEE will have 48 percent of all networked devices mobile-connected and 52 percent will be wired or connected over Wi-Fi.
◦ By 2023, CEE’s average fixed broadband speed will reach 87.7 Mbps, which represents 2.5-fold growth from 2018 (35.0 Mbps).
◦ By 2023, CEE’s average mobile connection speed will reach 43.0 Mbps, which represents 3.3-fold growth from 2018 (12.9 Mbps).
◦ By 2023, CEE’s average Wi-Fi speeds from mobile devices will reach 53 Mbps, which represents 2.3-fold growth from 2018 (22.6 Mbps).
● Latin America (LATAM)
◦ By 2023, LATAM will have 470 million Internet users (70 percent of regional population), up from 387 million (60 percent of regional population) in 2018.
◦ By 2023, LATAM will have 520 million mobile users (78 percent of regional population), up from 482 million (75 percent of regional population) in 2018.
◦ By 2023, LATAM will have 2.1 billion networked devices/connections, up from 1.4 billion in 2018.
◦ By 2023, LATAM will have 49 percent of all networked devices mobile-connected and 51 percent will be wired or connected over Wi-Fi.
◦ By 2023, LATAM’s average fixed broadband speed will reach 59.3 Mbps, which represents 3.8-fold growth from 2018 (15.7 Mbps).
◦ By 2023, LATAM’s average mobile connection speed will reach 28.8 Mbps, which represents 3.6-fold growth from 2018 (8.0 Mbps).
◦ By 2023, LATAM’s average Wi-Fi speeds from mobile devices will reach 35.0 Mbps, which represents 3.3-fold growth from 2018 (10.6 Mbps).
● Middle East and Africa (MEA)
◦ By 2023, MEA will have 611 million Internet users (35 percent of regional population), up from 381 million (24 percent of regional population) in 2018.
◦ By 2023, MEA will have 1.0 billion mobile users (57 percent of regional population), up from 827 million (53 percent of regional population) in 2018.
◦ By 2023, MEA will have 2.6 billion networked devices/connections, up from 1.7 billion in 2018.
◦ By 2023, MEA will have 75 percent of all networked devices mobile-connected and 25 percent will be wired or connected over Wi-Fi.
◦ By 2023, MEA’s average fixed broadband speed will reach 41.2 Mbps, which represents 4.2-fold growth from 2018 (9.7 Mbps).
◦ By 2023, MEA’s average mobile connection speed will reach 24.8 Mbps, which represents 3.6-fold growth from 2018 (6.9 Mbps).
◦ By 2023, MEA’s average Wi-Fi speeds from mobile devices will reach 26 Mbps, which represents 3.7-fold growth from 2018 (7.0 Mbps).
● North America (NA)
◦ By 2023, NA will have 345 million Internet users (92 percent of regional population), up from 328 million (90 percent of regional population) in 2018.
◦ By 2023, NA will have 329 million mobile users (88 percent of regional population), up from 313 million (86 percent of regional population) in 2018.
◦ By 2023, NA will have 5.0 billion networked devices/connections, up from 3.0 billion in 2018.
◦ By 2023, NA will have 25 percent of all networked devices mobile-connected and 75 percent will be wired or connected over Wi-Fi.
◦ By 2023, NA’s average fixed broadband speed will reach 141.8 Mbps, which represents 2.5-fold growth from 2018 (56.6 Mbps).
◦ By 2023, NA’s average mobile connection speed will reach 58.4 Mbps, which represents 2.7-fold growth from 2018 (21.6 Mbps).
◦ By 2023, NA’s average Wi-Fi speeds from mobile devices will reach 110 Mbps, which represents 2.3-fold growth from 2018 (46.9 Mbps).
● Western Europe (WE)
◦ By 2023, WE will have 370 million Internet users (87 percent of regional population), up from 345 million (82 percent of regional population) in 2018.
◦ By 2023, WE will have 365 million mobile users (85 percent of regional population), up from 357 million (84 percent of regional population) in 2018.
◦ By 2023, WE will have 4.0 billion networked devices/connections, up from 2.4 billion in 2018.
◦ By 2023, WE will have 31 percent of all networked devices mobile-connected and 69 percent will be wired or connected over Wi-Fi.
◦ By 2023, WE’s average fixed broadband speed will reach 123.0 Mbps, which represents 2.7-fold growth from 2018 (45.6 Mbps).
◦ By 2023, WE’s average mobile connection speed will reach 62.4 Mbps, which represents 2.6-fold growth from 2018 (23.6 Mbps)
◦ By 2023, WE’s average Wi-Fi speeds from mobile devices will reach 97 Mbps, which represents 3.2-fold growth from 2018 (30.8 Mbps)
Section 1: Users/ Devices and connections
A. Growth in Internet users
Globally, the total number of Internet users is projected to grow from 3.9 billion in 2018 to 5.3 billion by 2023 at a CAGR of 6 percent. In terms of population, this represents 51 percent of the global population in 2018 and 66 percent of global population penetration by 2023 (Figure 1).
While the growth in the number of Internet users is a global trend, we do see regional variations (Table 1). While the region with the highest adoption throughout the forecast period is North America (followed by Western Europe), the fastest growth is projected to occur in the Middle East and Africa (10 percent CAGR expected from 2018 to 2023).
Table 1. Internet users as a percentage of regional population
| Region |
2018 |
2023 |
| Global |
51% |
66% |
| Asia Pacific |
52% |
72% |
| Central and Eastern Europe |
65% |
78% |
| Latin America |
60% |
70% |
| Middle East and Africa |
24% |
35% |
| North America |
90% |
92% |
| Western Europe |
82% |
87% |
B. Shifts in mix of devices and connections
Globally, devices and connections are growing faster (10 percent CAGR) than both the population (1.0 percent CAGR) and the Internet users (6 percent CAGR). This trend is accelerating the increase in the average number of devices and connections per household and per capita. Each year, various new devices in different form factors with increased capabilities and intelligence are introduced and adopted in the market. A growing number of M2M applications, such as smart meters, video surveillance, healthcare monitoring, transportation, and package or asset tracking, are contributing in a major way to the growth of devices and connections. By 2023, M2M connections will be half or 50 percent of the total devices and connections.
M2M connections will be the fastest-growing device and connections category, growing nearly 2.4-fold during the forecast period (19 percent CAGR) to 14.7 billion connections by 2023.
Smartphones will grow the second fastest, at a 7 percent CAGR (increasing by a factor of 1.4). Connected TVs (which include flat-panel TVs, set-top boxes, digital media adapters [DMAs], Blu-ray disc players, and gaming consoles) will grow next fastest (at a little less than a 6 percent CAGR), to 3.2 billion by 2023. PCs will continue to decline (a 2.3 percent decline) over the forecast period. However, there will more PCs than tablets throughout the forecast period and by the end of 2023 (1.2 billion PCs vs. 840 million tablets).
By 2023, the consumer share of the total devices, including both fixed and mobile devices, will be 74 percent, with business claiming the remaining 26 percent. Consumer share will grow at a slightly slower rate, at a 9.1 percent CAGR relative to the business segment, which will grow at a 12.0 percent CAGR.
Globally, the average number of devices and connections per capita will grow from 2.4 in 2018 to 3.6 by 2023 (Table 2).
Among the countries that will have the highest average of per capita devices and connections by 2023 are the United States (13.6), South Korea (12.1), and Japan (11.1).
Table 2. Average number of devices and connections per capita
| Region |
2018 |
2023 |
| Global |
2.4 |
3.6 |
| Asia Pacific |
2.1 |
3.1 |
| Central and Eastern Europe |
2.5 |
4.0 |
| Latin America |
2.2 |
3.1 |
| Middle East and Africa |
1.1 |
1.5 |
| North America |
8.2 |
13.4 |
| Western Europe |
5.6 |
9.4 |
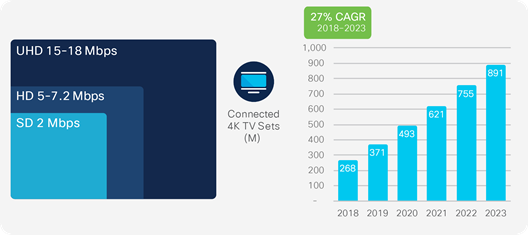
It is important to track the changing mix of devices and connections and growth in multidevice ownership as it affects traffic patterns. Video devices, in particular, can have a multiplier effect on traffic. An Internet-enabled HD television that draws couple - three hours of content per day from the Internet would generate as much Internet traffic as an entire household today, on an average. Video effect of the devices on traffic is more pronounced because of the introduction of Ultra-High-Definition (UHD), or 4K, video streaming. This technology has such an effect because the bit rate for 4K video at about 15 to 18 Mbps is more than double the HD video bit rate and nine times more than Standard-Definition (SD) video bit rate. We estimate that by 2023, two-thirds (66 percent) of the installed flat-panel TV sets will be UHD, up from 33 percent in 2018 (Figure 3).
C. M2M applications across many industries accelerate IoT growth
Internet of Things (IoT) have become a prevalent system in which people, processes, data, and things connect to the Internet and each other. Globally, M2M connections will grow 2.4-fold, from 6.1 billion in 2018 to 14.7 billion by 2023 (Figure 4). There will be 1.8 M2M connections for each member of the global population by 2023.
Connected home applications, such as home automation, home security and video surveillance, connected white goods, and tracking applications, will represent 48 percent, or nearly half, of the total M2M connections by 2023, showing the pervasiveness of M2M in our lives (Figure 5). Connected car applications such as fleet management, in-vehicle entertainment systems, emergency calling, Internet, vehicle diagnostics and navigation etc. will be the fastest-growing category, at a 30 percent CAGR. Connected cities applications will have the second-fastest growth, at 26 percent CAGR.
While traditionally the traffic from M2M connections has been less than that from the end user devices such as smartphones, TV sets and PCs, we estimate that the amount of traffic is growing faster than the number of connections because of the increase of deployment of video applications on M2M connections and the increased use of applications, such as telemedicine and smart car navigation systems, which require greater bandwidth and lower latency.
D. Mobility on the rise
Globally, the total number of mobile subscribers (those subscribing to a cellular service) is going to grow from 5.1 billion in 2018 to 5.7 billion by 2023 at a CAGR of 2 percent. In terms of population this represents 66% of global population in 2018 and 71% of global population penetration by 2023 (Figure 6). Relative to the growth in Internet users we see slow down occurring in the mobile subscriber growth – this is primarily as the penetration levels have already crossed 60 percent range.
While there are regional differences in the mobile subscriber penetration of the regional population (Table 3), the range of variations is much smaller relative to the overall Internet users that we saw in the previous analysis. While the region with the highest adoption throughout the forecast period is North America, followed by Western Europe, the fastest growth is going to occur in Middle East and Africa at 4 percent CAGR from 2018 to 2023. While the adoption rates for mobile (above 60 percent of the population in 2018) are already quite high across all regions, we do see that Middle East and Africa has a bit of catch up to do and that is reflected in higher growth rates relative to other regions.
Table 3. Mobile subscribers as a percentage of regional population
| Region |
2018 |
2023 |
| Global |
66% |
71% |
| Asia Pacific |
65% |
72% |
| Central and Eastern Europe |
79% |
81% |
| Latin America |
75% |
78% |
| Middle East and Africa |
53% |
57% |
| North America |
86% |
88% |
| Western Europe |
84% |
85% |
The ever-changing mix and growth of wireless devices that are accessing mobile networks worldwide is one of the primary contributors to global mobile traffic growth. Each year several new devices in different form factors and increased capabilities and intelligence are introduced in the market. In the last couple of years, we have seen a rise of phablets and more recently we have seen many new M2M connections coming into the mix. There were 8.8 billion global mobile devices and connections in 2018, which will grow to 13.1 billion by 2023 at a CAGR of 8 percent (Figure 7).
By 2023, there will be 8.7 billion handheld or personal mobile-ready devices and 4.4 billion M2M connections (e.g., GPS systems in cars, asset tracking systems in shipping and manufacturing sectors, or medical applications making patient records and health status more readily available, et al.). Regionally, North America and Western Europe are going to have the fastest growth in mobile devices and connections with 16 percent and 11 percent CAGR from 2018 to 2023, respectively.
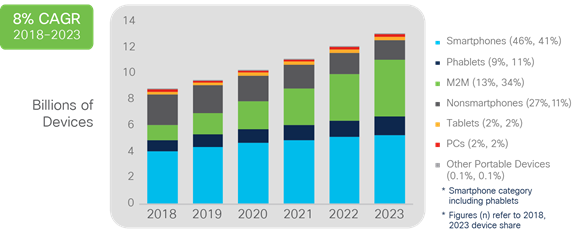
We see a rapid decline in the share of non-smartphones from 27 percent in 2018 (2.4 billion) to 11 percent by 2023 (1.5 billion). Another significant trend is the growth of smartphones (including phablets) from 4.9 billion in 2018 to 6.7 billion by 2023 at the second highest CAGR of 7 percent. Even though smartphones are growing absolutely, the relative share is declining from 56 percent in 2018 to 51 percent by 2023. This is because of the most noticeable growth in M2M connections. M2M mobile connections will cross over a third (34 percent) of total devices and connections by 2023. The M2M category is going to grow at 30 percent CAGR from 2018 to 2023. Along with the overall growth in the number of mobile devices and connections, there is clearly a visible shift in the device mix.
Defining Cell Network Advances—2G, 3G, 4G and 5G Projections
Mobile devices are evolving from lower-generation network connectivity (2G) to higher-generation network connectivity (3G, 3.5G, 4G or LTE and now also 5G). Combining device capabilities with faster, higher bandwidth and more intelligent networks will facilitate broad experimentation and adoption of advanced multimedia applications that contribute to increased mobile and Wi-Fi traffic.
The explosion of mobile applications and the expanded reach of mobile connectivity to a growing number of end users has prompted the need for optimized bandwidth management and new network monetization models to sustain a maturing mobile industry. In a highly competitive mobile market, we have seen the growth of global 4G deployments as well as early-stage 5G implementations.
Last year we saw that 4G surpassed all other connection types, in this year’s analysis we’ve combined 3G and below networks into one category – 4G will surpass that category by 2019 and will be the predominant mobile network connectivity throughout the remaining forecast period. By 2023, 4G connections will be 46% of total mobile connections, compared to 42% in 2018 (Figure 8). The global mobile 4G connections will grow from 3.7 billion in 2018 to 6.0 billion by 2023 at a CAGR of 10 percent. 5G connections will appear on the scene in 2019 and will grow over 100-fold from about 13 million in 2019 to 1.4 billion by 2023. 5G connectivity is emerging from nascency to a strong contender for mobile connectivity driven by mobile IoT growth. By 2023, there will be 11% devices and connections with 5G capability.
Starting this year, we are combining our analysis of 2G and 3G into 3G and below category as the lack of source data has made it difficult to split the two categories. There were 55% 3G and below connections in 2018, but by the end of the forecast period, these will decline to 29%.
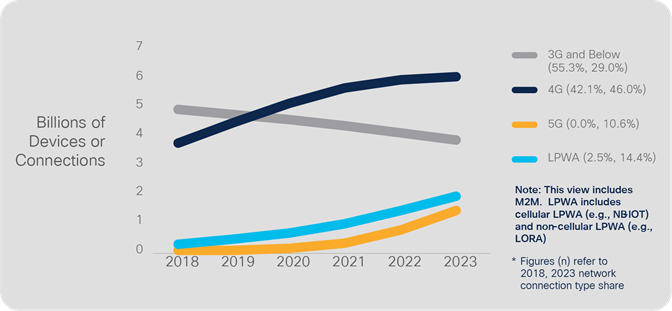
We also include Low-Power Wide-Area (LPWA) connections in our analysis. This type of ultra-narrowband wireless network connectivity is meant specifically for M2M modules that require low bandwidth and wide geographic coverage. It provides high coverage with low power consumption, module, and connectivity costs, thereby creating new M2M use cases for Mobile Network Operators (MNOs) that cellular networks alone could not have addressed. Examples include utility meters in residential basements, gas or water meters that do not have power connection, streetlights, and pet or personal asset trackers. The share of LPWA connections (all M2M) will grow from about 2.5 percent in 2018 to 14 percent by 2023, from 223 million in 2018 to 1.9 billion by 2023.
This transition from 3G and below to 4G and now 5G deployment is a global trend (Table 4). In fact, by 2023, nearly 60 percent of the mobile devices and connections globally will have 4G+ capability, surpassing 3G and below-capable devices and connections by several fold. North America will have the highest share of its devices and connections on 4G+ connectivity – 62 percent, by 2023. Middle East and Africa at 73% will have the highest share of its devices and connections on 3G and below by 2023. By 2023, North America with 37 percent and Western Europe with 28 percent share will be the two regions with highest LPWA adoption. By 2023, North America will be the region with highest share of connections on 5G at 17 percent.
Table 4. Mobile connections by network type – 2023 regional percentage share
| Region |
3G and Below |
4G |
5G |
LPWA |
| Global |
29 |
46 |
11 |
14 |
| Asia Pacific |
23 |
52 |
13 |
12 |
| Central and Eastern Europe |
31 |
50 |
2 |
16 |
| Latin America |
37 |
50 |
2 |
16 |
| Middle East and Africa |
73 |
22 |
1 |
4 |
| North America |
1 |
45 |
17 |
37 |
| Western Europe |
13 |
43 |
16 |
28 |
The top three 5G countries in terms of percent of devices and connections share on 5G will be China (20.7%), Japan (20.6%), and United Kingdom (19.5%), by 2023.
Mobile IoT adoption—M2M
The phenomenal growth in mobile end-user devices and M2M connections is a clear indicator of the growth of mobile IoT, which is bringing together people, processes, data, and things to make networked connections more relevant and valuable.
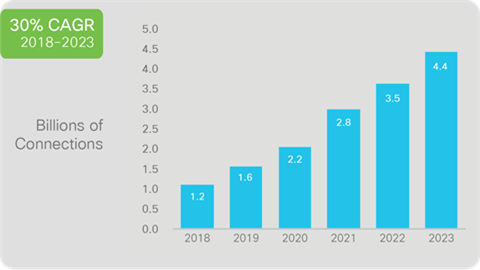
Globally, mobile M2M connections will grow from 1.2 billion in 2018 to 4.4 billion by 2023, a 30 percent CAGR—a four-fold growth. (Figure 9).
Section 2: Network performance and user experience
A. Wi-Fi continues to gain momentum
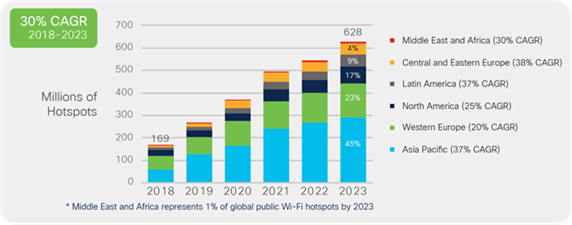
One of the main solutions to meet the demands of the increasing demand for bandwidth has long been leveraging Wi-Fi networks, which enables operators to scale capacity to meet their subscribers’ needs. With advances and ratifications in Wi-Fi standards, dense environments with many concurrently connecting devices and IoT connections such as airports, public transportation, retail, healthcare, smart cities, stadiums etc. result in public wi-fi use cases across industry segments. Globally, there will be nearly 628 million public Wi-Fi hotspots by 2023, up from 169 million hotspots in 2018, a fourfold increase.
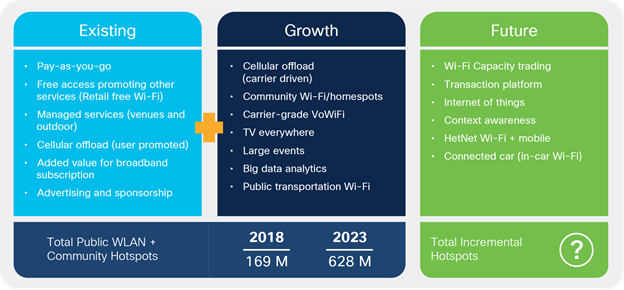
By 2023, Asia Pacific will have the highest share of global public Wi-Fi hotspots at 46 percent. Public Wi-Fi along with community hotspots are included in the forecast. Community hotspots or homespots have emerged as a potentially significant element of the public Wi-Fi landscape. In this model, subscribers allow part of the capacity of their residential gateway to be open to casual use. The homespots may be provided by a broadband or other provider directly or through a partner. Asia Pacific will lead in adoption of homespots. By 2023, China will lead in total number of homespots, followed by the United States and Japan.
Retail establishments will have the highest number of hotspots by 2023 globally, and the fastest growth is in healthcare facilities (hospitals), where hotspots will triple over the forecast period. The primary objective of Wi-Fi in hospitals is to improve the delivery of healthcare services and staff productivity, with a secondary benefit being Internet access for patients, their families, and their guests.
Integral to these verticals and looking into the future are the game-changing IoT devices and connections. According to the WBA Alliance, there is a need to find a dynamic way for IoT devices to search for a computable network and automatically roam between Wi-Fi and mobile networks at scale without intervention. Additionally, interest in data analytics and recommendation engines resulting in Wi-Fi advertising and location services is growing as service providers search for new ways to monetize Wi-Fi and generate new revenue streams.
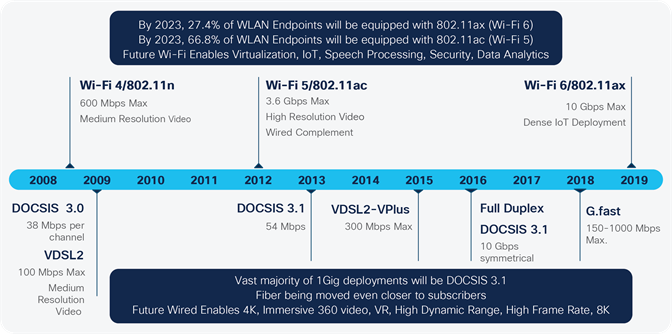
Critical enablers of Hotspot 2.0 adoption are higher speed Wi-Fi gateways and the adoption of the IEEE 802.11ac or Wi-Fi 5 and the latest 802.11ax or Wi-Fi 6 standards. Globally, Wi-Fi 6 hotspots will grow 13-fold from 2020-2023 and will be 11% of all public Wi-Fi hotspots by 2023.
The prevalence of IEEE 802.11ac, the latest Wi-Fi standard, will gain momentum from 2018 through 2023. By 2023, 66.8 percent of all WLAN endpoints will be equipped with 802.11ac or Wi-Fi 5. IEEE 802.11n or Wi-Fi 4, which was ratified in 2007, provides a range of speeds that allow users to view medium-resolution video streaming because of the higher throughput. IEEE 802.11ac, with very high theoretical speeds, is considered a true wired complement and can enable higher definition video streaming and services with use cases that require higher data rates. The latest 802.11ax or Wi-Fi 6 is also called the High-Efficiency Wireless (HEW), has the goal of improving the average throughput per user by a factor of at least four times in dense user environments. It will enable dense IoT deployments. By 2023, 27.4 percent of all WLAN endpoints will be equipped with 802.11ax (Figure 12).
Wi-Fi has a powerful role to play alongside other small cell technologies in delivering key use cases going forward in the 5G Era.
B. Effects of accelerating speeds on traffic growth
Broadband speed is a crucial enabler of IP traffic. Broadband-speed improvements result in increased consumption and use of high-bandwidth content and applications. The global average broadband speed continues to grow and will more than double from 2018 to 2023, from 45.9 Mbps to 110.4 Mbps. Table 5 shows the projected broadband speeds from 2018 to 2023. Several factors influence the fixed broadband-speed forecast, including the deployment and adoption of Fiber-To-The-Home (FTTH), high-speed DSL, and cable broadband adoption, as well as overall broadband penetration. Among the countries covered by this study, Japan, South Korea, and Sweden lead in terms of broadband speed largely because of their wide deployment of FTTH.
Table 5. Fixed broadband speeds (in Mbps), 2018–2023
| Region |
2018 |
2019 |
2020 |
2021 |
2022 |
2023 |
CAGR (2018–2023) |
| Global |
45.9 |
52.9 |
61.2 |
77.4 |
97.8 |
110.4 |
20% |
| Asia Pacific |
62.8 |
74.9 |
91.8 |
117.1 |
137.4 |
157.1 |
20% |
| Latin America |
15.7 |
19.7 |
34.5 |
41.2 |
51.5 |
59.3 |
30% |
| North America |
56.6 |
70.1 |
92.7 |
106.8 |
126.0 |
141.8 |
20% |
| Western Europe |
45.6 |
53.2 |
72.3 |
87.4 |
105.6 |
123.0 |
22% |
| Central and Eastern Europe |
35.0 |
37.2 |
57.0 |
65.5 |
77.8 |
87.7 |
20% |
| Middle East and Africa |
9.7 |
11.7 |
25.0 |
29.0 |
34.9 |
41.2 |
33% |
Consider how long it takes to download an HD movie at these speeds: at 10 Mbps, it takes 20 minutes; at 25 Mbps, it takes 9 minutes; but at 100 Mbps, it takes only 2 minutes. High-bandwidth speeds will be essential to support consumer cloud storage, making the download of large multimedia files as fast as a transfer from a hard drive. Table 6 shows the percentage of broadband connections that will be faster than 10 Mbps (96 percent by 2023), 25 Mbps (88 percent by 2023), and 100 Mbps (39 percent by 2023) by region.
Table 6. Broadband speed greater than 10 Mbps, 2018–2023
| Region |
Greater Than 10 Mbps |
|||||
|
|
2018 |
2019 |
2020 |
2021 |
2022 |
2023 |
| Global |
74% |
79% |
80% |
85% |
90% |
96% |
| Asia Pacific |
82% |
87% |
88% |
90% |
93% |
98% |
| Latin America |
43% |
52% |
56% |
63% |
70% |
76% |
| North America |
81% |
84% |
86% |
89% |
93% |
97% |
| Western Europe |
71% |
75% |
77% |
82% |
86% |
91% |
| Central and Eastern Europe |
67% |
67% |
69% |
70% |
72% |
74% |
| Middle East and Africa |
25% |
31% |
35% |
39% |
44% |
50% |
| Region |
Greater Than 25 Mbps |
|||||
|
|
2018 |
2019 |
2020 |
2021 |
2022 |
2023 |
| Global |
51% |
60% |
63% |
74% |
80% |
88% |
| Asia Pacific |
61% |
71% |
72% |
85% |
89% |
97% |
| Latin America |
20% |
26% |
45% |
60% |
65% |
74% |
| North America |
59% |
66% |
84% |
95% |
98% |
99% |
| Western Europe |
48% |
54% |
71% |
81% |
89% |
98% |
| Central and Eastern Europe |
41% |
45% |
53% |
58% |
61% |
65% |
| Middle East and Africa |
9% |
11% |
15% |
19% |
20% |
22% |
| Region |
Greater Than 100 Mbps |
|||||
|
|
2018 |
2019 |
2020 |
2021 |
2022 |
2023 |
| Global |
11% |
20% |
24% |
29% |
34% |
39% |
| Asia Pacific |
14% |
20% |
26% |
33% |
42% |
53% |
| Latin America |
1% |
1% |
1% |
1% |
2% |
2% |
| North America |
16% |
23% |
31% |
37% |
40% |
46% |
| Western Europe |
10% |
13% |
15% |
17% |
19% |
22% |
| Central and Eastern Europe |
3% |
3% |
4% |
4% |
5% |
6% |
| Middle East and Africa |
0% |
1% |
1% |
1% |
1% |
2% |
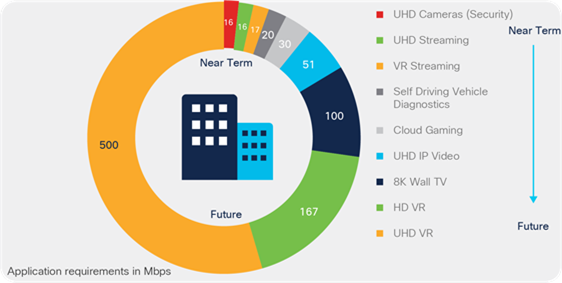
Several countries also have users that currently experience greater than 125 Mbps, paving the path for the future demands of video. Video and other applications continue to be of enormous demand in today’s home, but there will be significant bandwidth demands with the application requirements of the future, even beyond the forecast period of 2023. In Figure 13, a scenario with video applications of the future is explored; today’s bandwidth needs are a sliver of the future needs.
Mobile speeds
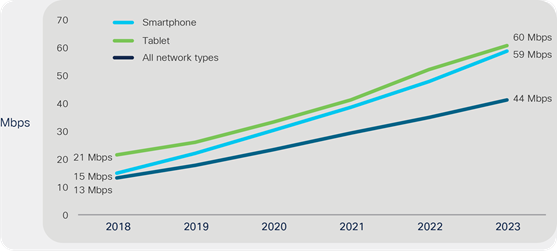
Globally, the average mobile network connection speed in 2018 was 13.2 Mbps. The average speed will more than triple and will be 43.9 Mbps by 2023.
Anecdotal evidence supports the idea that overall use increases when speed increases, although there is often a delay between the increase in speed and the increased use, which can range from a few months to several years. The reverse can also be true with the burstiness associated with the adoption of wild card applications with IoT, VR and AR, cloud gaming on tablets and smartphones, where there is a delay in experiencing the speeds that the devices can support.
Table 7. Average mobile network connection speeds (in Mbps) by region and country
| Region |
2018 |
2019 |
2020 |
2021 |
2022 |
2023 |
CAGR (2018–2023) |
| Global speed: All handsets |
13.2 |
17.7 |
23.5 |
29.4 |
35.9 |
43.9 |
27% |
| Asia Pacific |
14.3 |
18.0 |
24.7 |
32.4 |
39.0 |
45.7 |
26% |
| Latin America |
8.0 |
11.2 |
15.7 |
21.1 |
24.8 |
28.8 |
29% |
| North America |
21.6 |
27.0 |
34.9 |
42.4 |
50.6 |
58.4 |
22% |
| Western Europe |
23.6 |
31.2 |
40.1 |
48.2 |
54.4 |
62.4 |
21% |
| Central and Eastern Europe |
12.9 |
15.7 |
21.3 |
30.3 |
36.1 |
43.0 |
27% |
| Middle East and Africa |
6.9 |
9.4 |
13.3 |
17.6 |
20.3 |
24.8 |
29% |
Current and historical speeds are based on data from Ookla’s Speedtest.net. Forward projections for mobile data speeds are based on third-party forecasts for the relative proportions of 2G, 3G, 3.5G, and 4G among mobile connections through 2023.
A crucial factor promoting the increase in mobile speeds over the forecast period is the increasing proportion of 4G mobile connections and the rise of 5G connections. The effect of 4G and 5G connections on traffic is significant, because they contribute to a disproportionate amount of mobile data traffic.
Wi-Fi speeds from mobile devices
Globally, Wi-Fi connection speeds originated from dual-mode mobile devices will triple by 2023. The average Wi-Fi network connection speed (30.3 Mbps in 2018) will exceed 91.6 Mbps by 2023. Asia Pacific will experience the highest Wi-Fi speeds, 116.1 Mbps, by 2023 (Table 8).
Wi-Fi speeds inherently depend on the quality of the broadband connection to the premises. The speed also depends on the Wi-Fi standard in the CPE device.
The latest standards, Wi-Fi6 and Wi-Fi 5, are considered to be a true wired complement and can enable higher definition video streaming and services that require higher data rates. Also, an important factor in the use of Wi-Fi technology is the number and availability of hotspots.
Table 8. Projected average Wi-Fi network connection speeds (in Mbps) by region and country
| Region |
2018 |
2019 |
2020 |
2021 |
2022 |
2023 |
CAGR (2018–2023) |
| Global |
30.3 |
36.3 |
50.8 |
58.9 |
72.9 |
91.6 |
25% |
| Asia Pacific |
34.5 |
42.2 |
62.3 |
80.2 |
98.5 |
116.1 |
27% |
| Latin America |
10.6 |
12.1 |
25.1 |
27.3 |
30.4 |
34.6 |
27% |
| North America |
46.9 |
56.8 |
70.7 |
87.3 |
98.4 |
109.5 |
18% |
| Western Europe |
30.8 |
36.3 |
53.4 |
64.7 |
79.4 |
97.4 |
26% |
| Central and Eastern Europe |
22.6 |
24.1 |
30.0 |
35.4 |
42.9 |
52.7 |
18% |
| Middle East and Africa |
7.0 |
7.9 |
16.3 |
18.6 |
21.9 |
25.7 |
30% |
C. Tiered pricing/Security analysis
Tiered pricing
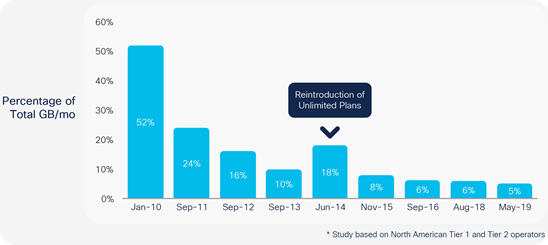
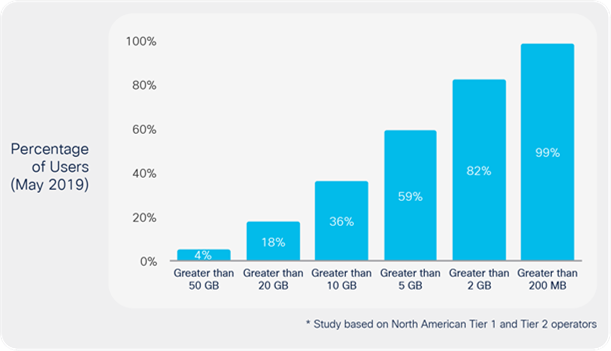
An increasing number of service providers worldwide are moving from unlimited data plans to tiered mobile data packages. To make an estimate of the impact of tiered pricing on traffic growth, we repeated a case study based on the data of several tier 1 and tier 2 North American service providers. The study tracks data usage from the time frame of the introduction of tiered pricing 7 years ago. The findings in this study are based on Cisco’s analysis of data provided by a third-party data-analysis firm. This firm maintains a panel of volunteer participants who have provided their mobile bill details including GB of data usage. The data in this study reflects usage associated with devices (from January 2010 and May 2019) and also refers to the study from the previous update for longer-term trends. The overall study spans 7 years. Cisco’s analysis of the data consists of categorizing the pricing plans, operating systems, devices, and data usage by users; incorporating additional third-party information about device characteristics; and performing exploratory and statistical data analysis. The results of the study represent actual data from a few tier 1 and tier 2 mobile data operators from North American markets, global forecasts that include emerging markets and more providers may lead to varied estimates.
The usage per month of the average top 1 percent of mobile data users has been steadily decreasing compared to that of overall usage. At the beginning of the 7-year study, 52 percent of the traffic was generated by the top 1 percent. With the reintroductions and promotions of unlimited plans by tier 2 operators in the study, the top 1 percent generated 18 percent of the overall traffic per month by June 2014. By May 2019, just 5 percent of the traffic was generated by the top 1 percent of users.
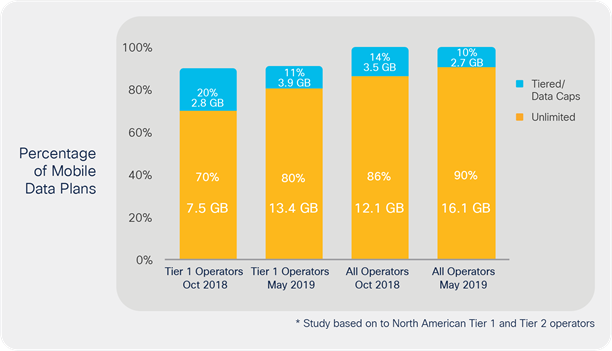
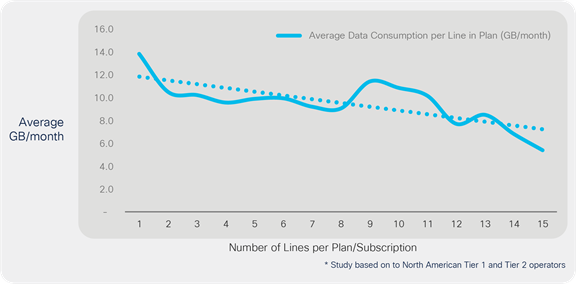
The number of mobile shared data plans is now a majority at 79% of the total plans. Average mobile data consumption per line is decreasing as the number of lines increase.
Security analysis
Users expect their online experience to be always available and always secure—and their personal and business assets to be safe. The last several years have been easily the most eventful period from a security threat perspective, with many serious data breaches that have been discussed widely in the media. Given the scope of the monetary and brand damage associated with data breaches, cybersecurity is treated as a business risk rather than merely an IT issue. Advances in technology is the main driver for economic growth but has also led to a higher incidence of cyberattacks. The leading trends such as ecommerce, mobile payments, cloud computing, Big Data and analytics, IoT, AI, machine learning, and social media, all increase cyber risk for users and businesses. Compounding the problem, the nature of the threats is becoming more diverse. The list includes Distributed Denial-of-Service (DDoS), ransomware, Advanced Persistent Threats (APTs), viruses, worms, malware, spyware, botnets, spam, spoofing, phishing, hacktivism and potential state-sanctioned cyberwarfare.
There were a total of 1,272 breaches with a total of nearly 163 million records exposed as of the month of November in 2019. The number of records exposed per data breach averaged 128,171 year-to-date in 2019, according to 2019 Identity Theft Resource Center, with the highest number of breaches in the banking category and the healthcare industry experienced the breach of the highest percentage of sensitive records. Average cost of a lost or stolen record continues to increase, according to the IBM Security and Ponemon Institute 2018 Cost of Data Breach Study and it is globally $150 in 2019 compared to an average of $148 in 2018. Cloud and digital transformation increased the total cost of a data breach. Extensive cloud migration, use of mobile platforms, and IoT devices were all significant cost increase drivers. Organizations in the United States had the highest total average cost at $8.19 million, followed by the Middle East at $5.97 million. In contrast, India and Brazilian organizations had the lowest total average cost at $1.83 million and $1.35 million, respectively.
A Distributed-Denial-of-Service (DDoS) attack occurs when multiple systems flood the bandwidth or resources of a targeted system, usually one or more web servers. Such an attack is often the result of multiple compromised systems flooding the targeted system with traffic. DDoS attacks represent the dominant threat observed by most service providers. Infrastructure outages also continue to be a threat with over half of operators experiencing this issue. Amplification attackers, who have tools for carrying out a DDoS attack, exploit vulnerabilities in the network and compute resources. Security vendors continue to make sure these attacks are financially unviable for the cybercriminals.

Next-generation applications
With the many millions of users and devices connecting to the network, faster speeds and connectivity and the multiple technological advancements in the architecture next-generation applications which have extremely complex requirements are and will become more the norm.
And with the many next-generation applications being created new models of business are being created as well. Artificial intelligence and machine learning and many other applications are now taking advantage of the digital transformation which is very much underway and creating new models of business and impacting various industries.
Take the music industry for example - Watson BEAT helped create a better soundtrack than an original composition with the help of a cognitive machine. The IBM® Spectrum Computing team asked IBM Watson® Beat to come up with killer beats for its latest Red Bull Racing video—and the AI composer used its neural network to lay down a unique track.
Or the Healthcare industry, where applications like Infervision use Artificial Intelligence and Deep learning and work in conjunction with radiologists to diagnose lung cancer faster.
Another example of a next-generation application is predictive analytics which involves using advanced analytic techniques that leverage historical data to uncover real-time insights and to predict future events. Predictive analytics can help transform the way a business operates and can be used for many Industrial IoT solutions - using sensor data to predict equipment failure, weather patterns, crop rotation and yield predictions and various other impacts on agriculture and the food industry and many other IoT solutions.
Applications such as reinforcement learning have revolutionized the automotive industry with creating autonomous driving cars and the financial services industry with new ways of portfolio management.
New next-generation applications and their rapidly evolving used cases and real-life examples are being built everyday - the most successful of which will involve shifting technologies and evolving business models.
Mobile applications drive future consumer, Small to Medium Business (SMB) and enterprise application needs. By 2023, 299.1 billion mobile applications will be downloaded globally. Social media, gaming and business applications will drive volume.
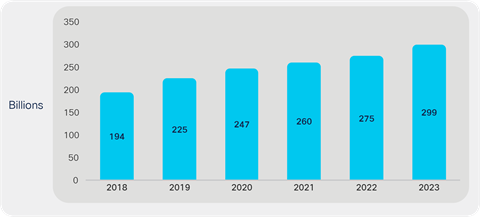
Asia Pacific will have the highest percentage (40.3 percent) of all mobile applications downloaded with183.2 billion by 2023 up from 120.7 billion mobile applications in 2018.
Section 3: Multi-domain architecture
A. Reimagine applications
Across virtually every business sector, there is an increased demand for new or enhanced applications that increase workforce productivity or improve customer experiences.
IT departments are often challenged to transform infrastructures to accommodate new technologies. The Internet of Things (IoT), Artificial Intelligence (AI), Machine Learning (ML), and business analytics are changing how developers build smart applications to simplify customer transactions and deliver new business insights.
Many enterprises have adopted multicloud strategies with unified management solutions to support microservices and containerized applications at the network edge. With a wide variety of Software-as-a-Service (SaaS) options, it is now possible to build intelligent business platforms that seamlessly connect applications, integrate IoT solutions, and enable customizable big data analyses. Enterprise, commercial, and consumer applications can all be reimagined with the appropriate infrastructure and the right partner to help you architect your purpose-built solution.
What role does AI play in delivering new insights and business intelligence from your apps?
AI platforms and applications are enabling enterprise application developers to leverage ML capabilities to provide enhanced accuracy, user experience, efficiency, and capabilities. AI is projected to be utilized everywhere from edge to core to cloud. Technology providers should continue to partner and support rapid deployment, interoperability, and standardization of AI solutions.
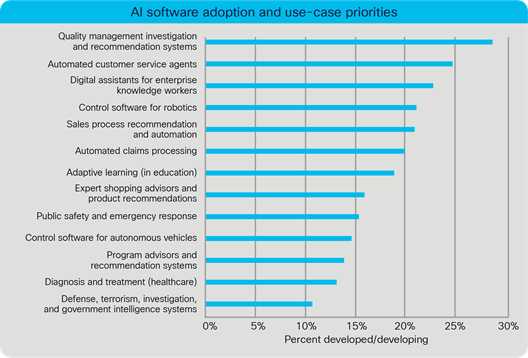
Recommended action: The role of AI in enterprises is changing how your customers buy, your suppliers deliver, and your competitors compete. With AI/ML offerings being made available in more ready- to-use and customized consumption models, an application developer can AI-enable any application with ease. You will need to deploy AI-optimized and AI-scalable solutions, ranging from bundles for specific markets to best-of-breed packages.
Can edge networks optimize your business and IoT applications?
According to our analysis, IoT devices will account for 50 percent (14.7 billion) of all global networked devices by 2023. Device manufacturers, business intelligence software firms, mobile carriers, systems integrators, and infrastructure vendors will all play unique but complementary roles across the IoT landscape.
Edge networks and computing allow enterprise architectures to optimize processing for business-critical analysis of data sets from IoT applications and communications. According to the Uptime Institute, half of all workloads will be run outside the enterprise data center by 2021, either in cloud/ non-cloud data centers or at the network edge. Low-latency real-time communications and high-definition video applications will leverage the multi-access edge enabled by 5G and Wi-Fi 6.
Recommended action: IoT applications are diverse and can be complex. You should explore mobile connectivity options and determine the best approach for your IoT initiatives. Assess your need for geographic coverage. In the longer term, prepare to shift your focus from managing connectivity to managing data across your IoT applications.
How will you future-proof today’s applications for tomorrow’s scale and capabilities requirements?
At the core of your digital journey, you must modernize your applications to meet today’s business demands while anticipating future needs and growth. For many organizations, containerized applications and microservices are providing the flexibility and resiliency needed to keep pace with technology innovations and competitive business pressures.
By 2022, microservices architectures will support 90 percent of all applications—improving the ability to design, debug, update, and leverage third-party code (according to IDC). Microservices and application containerization provide independent operation scalability, unparalleled system availability, and rapid new service launches without massive reconfigurations.
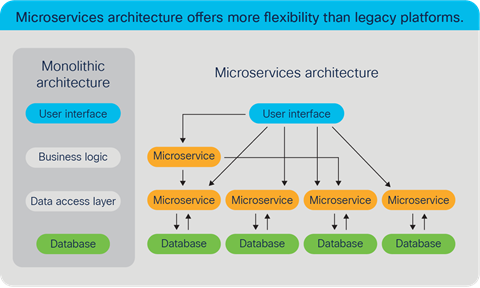
Recommended action: We live in a multicloud world (public, private, and hybrid). Your business needs to develop a multicloud strategy to enhance and extend its application capabilities to meet new competitive challenges. Your digital transformation can only happen when architectures and operations are simplified with the aid of microservices and containerization.
B. Transform infrastructure
One of the biggest issues for network managers is the growth of IT costs for network operations. The rapid growth of data and devices may be outpacing your IT team’s capabilities, and manual approaches just won’t allow you to keep up. Unfortunately, up to 95 percent of network changes are still performed manually, resulting in operational costs two to three times higher than the cost of the network. Increased IT automation, centrally and remotely managed, is essential for businesses to keep pace in the digital world. Proven innovations like software-defined networking, intelligent network edge enhancements, and unified domain controls and policies can help your organization achieve greater IT efficiency, consistency, and service quality.
Does your organization use a Software-Defined WAN (SD-WAN) solution to automate IT?
Organizations need continuous, automated network monitoring and optimization to support increasingly dynamic and digitally driven business models. Software-driven networks can accommodate these desired capabilities and create infrastructures that are flexible and programmable for changing business needs. Software-Defined Networks (SDNs) abstract the control plane from the forwarding plane, making the network more adaptable to the dynamic traffic demands of the business. In addition to SDN, policy-based automation and Intent-Based Networking (IBN) are also very important to meet the business needs of agility, portability, and scalability.
According to IDC, 40 percent of global IT leaders surveyed say they’ve currently deployed SD-WAN; nearly 55 percent more expect to deploy within 24 months. Additionally, network automation (25 percent), SDN (23 percent), and IBN (16 percent) are among the technologies that will have the most impact on networking over the next five years. (Source: Global Networking Trends Report.)
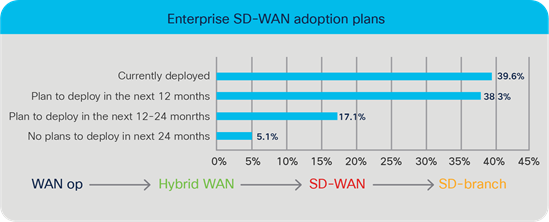
Recommended action: With the increasing adoption of hybrid cloud and enterprises’ expanding bandwidth requirements, business WAN traffic flow patterns are becoming more software based and hybrid in nature (combining Internet and Multiprotocol Label Switching [MPLS] - WAN). In response to this trend, IBN provides more intelligence and autonomy. IBN solutions can translate and maintain declarative intent through every networking phase— provisioning, deployment, management, troubleshooting, and remediation.
What role does the network edge play in your organization’s digital transformation?
Edge computing brings high-performance compute, storage, and networking resources closer to users and devices than ever before. The goals of this approach include lowering the cost of data transport and decreasing latency. SD-WAN is connecting the enterprise edge to the data center in new ways, setting the stage for cloud-managed or virtual Customer Pemises Equipment (CPE). There are various use cases driving the business need for greater edge compute capabilities. Enterprises are shifting their orchestration and management capabilities to be more function or location specific. Service providers are using their telecom edge to deliver external services to enterprise clients.
The enterprise edge is IT heavy and usually includes locations that were previously classified as remote offices and branch offices without data center facilities. Most enterprise edge locations are controlled via corporate-IT-specific provisioning and management capabilities based at the infrastructure “core” (i.e., the primary data center or public cloud). As enterprises embark on IT/operational technology convergence, endpoints are becoming more dynamic, mobile, and dispersed, forcing edge locations to be more distributed as well.
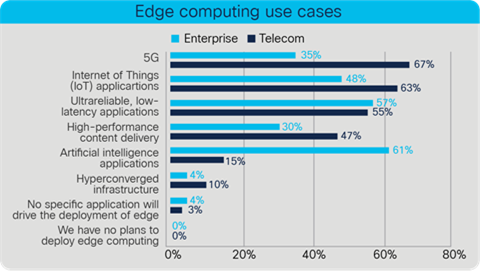
[Percent of respondents: N = 60 telecom, 23 enterprise]
Recommended action: The addition of billions of devices to the network edge drives the need for enterprises to manage and analyze data from IoT endpoints. Shifting traffic from the network core to the edge affects computing and communications architectures. Before you add edge computing capabilities, focus on making your overall IT infrastructure more efficient, more manageable, and better performing. Your edge computing strategy will only be successful if it’s built on a strong IT base.
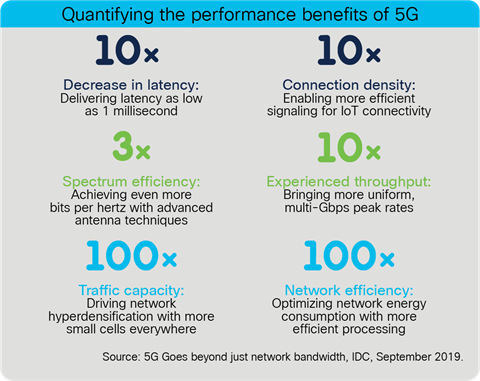
Does your organization have a comprehensive plan to capitalize on the promise of 5G?
The advent of 5G offers unprecedented opportunities for Mobile Network Operators (MNOs) to provide differentiated services to enterprises. According to a survey of global IT leaders and service providers, 5G is expected to have a significant impact on many business segments. While the use cases will vary, every business will need a comprehensive 5G plan that includes employee coverage, policy/security, analytics, and much more. While enterprises have always turned to MNOs to provide last-mile connectivity, they haven’t had visibility into the areas of the network controlled by the MNO. Today, enterprises want more than just bandwidth. They want to be able to extend the control of their network to the carrier network. Enterprises want visibility and control of the entire network (fixed and mobile), which historically hasn’t been possible.
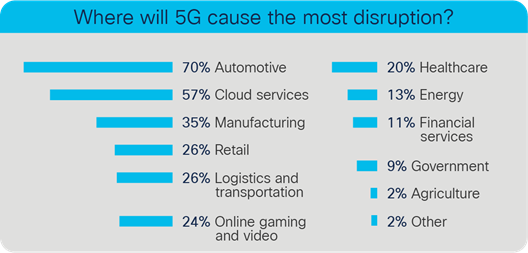
[Percent of respondents: N = 145 global IT leaders and service providers] Respondents selected top three industries.
Recommended action: Your business needs to develop a unified domain management strategy that addresses identity and access management, security, and segmentation. Your employees need to have the same quality of experience from their mobile devices when they aren’t connected to your enterprise network. Ideally, your solution should allow you to manage all enterprise endpoints from a single dashboard and flexibly provision access policies for licensed and unlicensed endpoints.
C. Secure Devices, Connections, Network and Data
Cybersecurity should be a top priority for everyone who uses the Internet for business and personal activities. Protecting your assets encompasses an ever-expanding digital landscape. Globally, there will be 29.3 billion networked devices by 2023, up from 18.4 billion in 2018. About half of those connections will support a wide variety of Internet of Things (IoT) applications (14.7 billion by 2023 compared to 6.1 billion in 2018). You need the actionable insights and scalable solutions to secure your employees’ devices, IoT connections, infrastructure, and proprietary data. You also need the right partner to help you identify and remediate breaches quickly when unauthorized events occur.
Which security incidents/attack types have you encountered in the past year?
According to Cisco’s 2019 chief information security officer benchmark study, two of the top three security issues pertain to email security. Whether you are investing in protecting the move to Microsoft Office 365 or trying to better protect against Business Email Compromise (BEC) using Domain-based Message Authentication, Reporting and Conformance (DMARC), email remains the number-one threat vector. The fact that two of the top 10 attacks are insider threat issues (file sharing and stolen credentials) shows that you must look at what’s happening inside as much as outside. Some criminals can log in rather than break in.
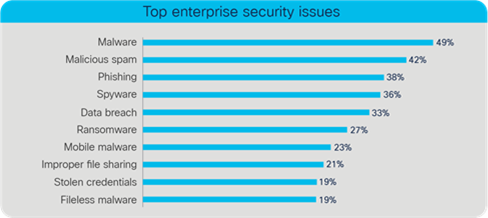
[Percent of respondents: N = 2,909]
Recommended action: Today’s security issues highlight the need for better Multi-Factor Authentication (MFA). Your security policy needs to strike the right balance between data protection and ease of use. An effective cybersecurity approach should give the right people access but not hinder authorized users with a clunky user authentication experience.
How well is your company complying with the current General Data Protection Regulation (GDPR)?
According to Cisco’s 2019 data privacy benchmark study, 59 percent of global businesses indicated they meet all or most of the GDPR’s requirements today. Another 29 percent said they will be GDPR ready within a year, leaving 9 percent who said it would take more than a year to get ready. While the GDPR applies to businesses in the EU or to the processing of personal data collected about individuals located in the EU, only 3 percent of respondents in the global survey indicated that they did not believe the GDPR applied to their organization.
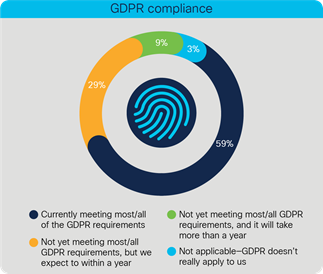
Recommended action: The top challenges to getting ready for the GDPR were identified as data security, employee training, and keeping up with the evolving regulations. Data privacy has become a board- level issue for many organizations, and customers are making sure their vendors and business partners have adequate answers to their privacy concerns before working together.
Over the past year, what was the financial impact of the biggest security breach to your organization?
We’re all aware of the potential consequences of a breach: financial loss, brand and reputational setback or ruin, shaken stockholder confidence, loss of valuable data, regulatory and noncompliance penalties, and more. There is a clear shift toward issues of perception and sentiment. There’s no let-up on the need to keep operations running, but customer experience and brand reputation are also key concerns related to cybersecurity issues.
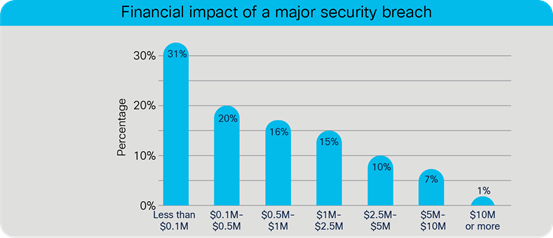
[Percent of respondents: N = 2,386]
Recommended action: All employees within an organization, especially those involved in security, should be extremely knowledgeable about incident response. Unfortunately, only 75 percent of Cisco survey respondents indicated that they knew what to do after a security breach. This is where training becomes so vital, and it needs to have greater prominence in every organization’s cybersecurity plan.
D. Empower Employees and Teams
IT infrastructures are growing in complexity—accommodating more, and more diverse, end-user devices and Internet of Things (IoT) connections. Today’s applications are more interactive and bandwidth hungry, generating massive amounts of data that supports real-time analytics and problem solving. This digital transformation requires more distributed and intelligent edge network capabilities with constantly evolving security. To achieve business agility (a top priority for businesses of all sizes), empowering global workforces with the right tools is a must. Automation, collaboration, and mobility are essential for managing IT complexity and new customer expectations and demands.
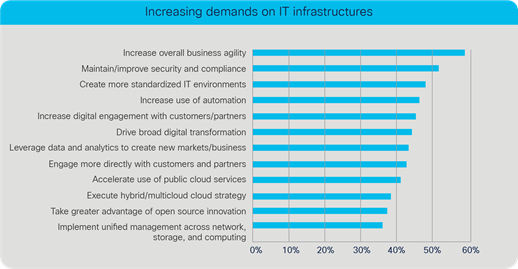
[Percentage of respondents: N = 200 IT and DevOps decision makers]
What are your main objectives for implementing a network automation strategy?
The primary objective of network teams is to continuously deliver application and service performance and protection for the business. Network automation is the process of automating the configuration, management, testing, deployment, and operation of physical and virtual networks. According to a Capgemini survey (where the top two objectives driving automation initiatives were ranked), nearly 40 percent of the organizations implementing automation initiatives are doing so to improve workforce productivity.
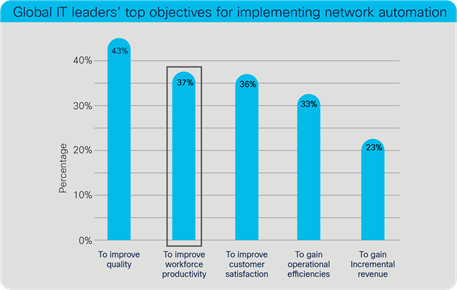
N = 705 organizations that are experimenting with or implementing initiatives]
Recommended action: According to Gartner, approximately 70 percent of data center networking tasks are performed manually, which increases time, cost, and the likelihood of errors, and reduces flexibility. Automation can improve network availability and relieve teams from time-consuming repetitive tasks, freeing them up for higher-value-add activities.
Do you use a Unified Communications and Collaboration (UCC) solution to improve your workflow?
UCC has become a mainstream productivity tool for many organizations based on how widely it has been adopted and used for business communications and collaboration. According to a survey conducted by IDC, nearly 50 percent of businesses are currently using UCC, while the “no plans for UCC” percentage has declined. Nearly 75 percent of businesses are either using UCC or plan to do so within one year.
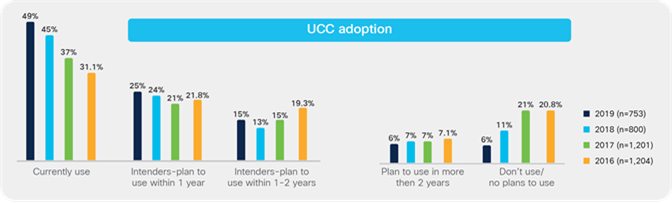
Recommended action: Increasing video usage, virtual reality, and augmented reality business applications can all improve your team’s collaboration, training, and productivity. UCC solutions can also lead to quicker and more innovative problem solving for business processes and customer interactions.
What role does wireless networking play in empowering your workforce?
Mobility is another important tool for empowering your workforce. Business users expect high-performance connectivity anywhere, anytime, on any device (via Wi-Fi or cellular networks). Additionally, wireless IoT devices are becoming more ubiquitous in many business sectors (manufacturing, healthcare, logistics, etc.). This wave of IoT applications dramatically changes wireless networking requirements in terms of scale, traffic patterns and volumes, and security.
● By 2023, IoT devices will account for 50 percent of all networked devices (nearly a third will be wireless).
● By 2023, a 5G connection will generate nearly 3X more traffic than a 4G connection.
● By 2023, there will be 628 million global public Wi-Fi hotspots, 4X more than in 2018 (169 million).
Cellular advances (4G/LTE or 5G) and Wi-Fi upgrades (Wi-Fi 6) are driven by our insatiable demand for wireless connectivity. Ongoing mobile innovations will be required to support massive IoT connection density as well as highly interactive and tactile applications.
Recommended action: Your business needs to develop a mobile strategy with policies to empower your teams and protect their assets and data. Emerging capabilities such as Open Roaming will provide seamless, always-on, and secure global roaming between different Wi-Fi 6 networks and public 5G networks.
Summary: Multi-domain innovation and integration redefines the Internet
Throughout the forecast period (2018 – 2023), network operators and IT teams will be focused on interconnecting all the different domains in their diverse infrastructures – access, campus/branch, IoT/OT, wide-area, data center, co-los, cloud providers, service providers, and security. By integrating these formerly distinct and siloed domains, IT can reduce complexity, increase agility, and improve security. The future of the Internet will establish new connectivity requirements and service assurance levels for users, personal devices and IoT nodes, all applications (consumer and business), via any network access type (fixed broadband, Wi-Fi, and cellular) with dynamic security. Through our research and analysis, we anticipate innovation and growth in the following strategic areas.
Applications: Across virtually every business sector, there is an increased demand for new or enhanced applications that improve customer experiences. The Internet of Things (IoT), Artificial Intelligence (AI), Machine Learning (ML) and business analytics are changing how developers build smart applications to simplify customer transactions and deliver new business insights. Businesses and service organizations need to understand evolving demands and deliver exceptional customer experiences by leveraging technology.
Infrastructure transformation: The rapid growth of data and devices is outpacing many IT teams’ capabilities and manual approaches won’t allow them to keep up. Increased IT automation, centrally and remotely managed, is essential for businesses to keep pace in the digital world. Service providers and enterprises are exploring software-defined everything, as well as intent-driven and context-powered infrastructures that are designed to support future application needs and flexibility.
Security: Cybersecurity is a top priority for all who rely on the Internet for business and personal online activities. Protect every surface, detect fast and remediate confidently. Protecting digital assets and content encompasses an ever-expanding digital landscape. Organizations need the actionable insights and scalable solutions to secure employees’ devices, IoT connections, infrastructure and proprietary data.
Empowering employees and teams: To achieve business agility and prepare employees for the future, empowering global workforces with the right tools is a must. Automation, collaboration and mobility are essential for managing IT complexity and new customer expectations and demands. Business teams, partners and groups in all types of organizations need to collaborate seamlessly across all application mediums that are relevant to various roles and responsibilities. Employees and teams need accurate and actionable data to solve problems and create new growth strategies.
Appendix A: Overview of Annual Internet Report methodology
Quantitative forecast methodology
The number of consumer fixed Internet users is not taken directly from an analyst source — it is estimated from analyst forecasts for consumer broadband connections, data on hotspot users, mobile-only users estimates, business-only users estimates from a variety of sources, and population forecasts from the United Nations. All of the components are together validated against what is deemed reasonable population penetration at a country level (reported or estimated). The projection for mobile users is similarly determined by looking at the mobile subscribers reported by our trusted analyst sources listed below and then benchmarked/validated against country population and other reports/estimates.
Our devices and connections methodology include installment data and sometimes shipment data from third-party analyst firms, applying our own analysis on converting the latter to an installed base, estimating country level distributions, network connectivity splits and de-duplicating for a unique count.
The projections for mobile application downloads are determined from a myriad of publicly available and syndicated sources, customized for the regions and countries within the report.
Several factors influence the fixed and Wi-Fi broadband-speed forecast, including the deployment and adoption of fiber, high-speed DSL, cable broadband adoption, Wi-Fi6 and Wi-Fi 5 technologies as well as overall broadband penetration. For the mobile speeds forecast, 4G and 5G deployments (both sub 6 GHz and millimeter (mm) wave frequency), penetration of higher resolution dual mode devices (smartphones, tablets etc.) along with sun setting of 2G and 3G around the world. We also analyze over 80 million speed test records looking at average and median speeds as a part of this study.
In getting more focused on future tactile Internet applications, the online Cisco Internet readiness tool provides a sample set of business and consumer cloud services that users are accessing—and provide an understanding of the network requirements associated with those services. Within the applications, the support of network performance characteristics is key to identifying countries’ readiness in deploying these applications. We cross reference the application requirements with several fundamental characteristics: average download speed, average upload speed, and average network latency based on millions of end user speed test records. Statistical modeling is then applied to create the projections.
The forecast relies on analyst projections for Internet users, broadband connections, video subscribers, mobile connections, and Internet application adoption. Our trusted analyst forecasts come from Ovum, Ookla Speedtest.net, IDC, IHS, Gartner, ABI Research. Strategy Analytics, HarrisX, Dell’Oro, Nielsen, Maravedis, App Annie and a variety of other sources.
Qualitative Section Methodology
This section of the report focuses on four strategic areas of digital development: applications, security, infrastructure transformation, and empowerment of employees and teams. These areas align to the multi-domain architectural challenges and opportunities that many global organizations are trying to address across their access, WAN (wide area network), and data center domains. Curated perspectives, insights and analysis from syndicated analyst firms (Gartner, IDC, et al.) as well as Cisco’s own research and sponsored surveys are applied to this portion of the Cisco Annual Internet Report.
Several interactive tools are available to help you create custom highlights and forecast charts by region, by country, by application, and by end-user segment (refer to the Cisco Annual Internet Report Highlights tool). Inquiries can be directed to ask-ciscoair@cisco.com. You can also questions and interact with the analysts via our external community page.