The Cisco
® Next-Generation Enterprise WAN (NGEW) is an end-to-end architecture that provides foundation building blocks for next-generation enterprise networks. The hierarchical design provides the scalability required by large enterprises that can be extended and replicated throughout multiple regions and topologies. This consistency leads to ease of deployment, maintenance, and troubleshooting.
Network management plays an important role within the NGEW architecture. This document outlines Cisco Prime which fills this role within NGEW.
2. Cisco Prime Components
Cisco Prime
™ products deliver unified management by supporting an intuitive workflow-oriented user experience and integrated lifecycle operations across Cisco architectures, technologies, and networks. Products in the Cisco Prime portfolio are designed to work together to offer the network administrator a transparent management experience.
Cisco Prime products help IT organizations:
• Simplify network management
• Improve operational efficiency
• Deliver predictable services
• Lower the total cost of ownership
IT organizations can now use Cisco Prime products to manage the NGEW. This overview focuses on how some of the features within Cisco Prime products can help network administrators easily deploy, monitor, and troubleshoot services that are based on the Cisco NGEW blueprint.
3. Day Zero - Challenges of Deploying NGEW Services
One of the first challenges comes when deploying a new branch office and the services that are provisioned on that office. How can Cisco Prime products help provision NGEW branch offices?
Normally a branch office is staged at a central location with just the minimal configuration to come online when installed at the remote branch-office location. This staging may be easy for a small network, but for an enterprise or large enterprise network, it is a very daunting task. How can multiple branch offices be provisioned with the least amount of time and effort? There are two steps to bringing new branch-office locations online: Configuring the network infrastructure to communicate with the branch office and deploying services on top of that infrastructure. The Cisco Prime LAN Management Solution (Cisco Prime LMS) can help with both of these tasks.
3.1 Cisco Prime LMS 4.2 New Capabilities
In addition to the functionality delivered in previous versions of LMS, significant new enhancements and features are being delivered in Cisco Prime LMS Release 4.2 - below is a summary:
Features
Functions
Benefits
Compliance and Audit Management
• An upgradable and customizable compliance engine checks for industrial compliance standards such as HIPAA, SOX, IOS/IEC 27002, NSA, PCI, DHS, DISA, CIS and other corporate, IT, and technology standards
• Check and fix compliance violations
• Services and capability reports
• Lifecycle management reports covering end of sale/life, contracts, and PSIRT
• Extensive modeling of regulatory, corporate, IT, and technology policies
• Provides visibility into network's compliance with policies
• Identifies critical risks and violations
• Prioritizes triage of compliance violations
• Recommends fix for a set of known violations based on best practices
Work Centers
• Enhancements in the Cisco EnergyWise
™ Work Center support smart Power Distribution Units (PDUs) and the ability to wake a Cisco EnergyWise host through Wake-on-LAN
• Cisco TrustSec
™ Work Center has been enhanced to support readiness assessment at the solution level and provides support for Secure Group Access (SGA) configuration
• Enhanced Smart Install Work Center supports MAC-based groups and provides the ability to configure Integrated Service Routers (ISRs) as directors
• Take advantage of new borderless network service enhancements and capabilities such as Wake-on-LAN support for Cisco EnergyWise
™, Cisco TrustSec
™ readiness assessment, and Smart Install support on ISRs
Monitoring
• Generic fault management support across Cisco and non-Cisco devices based on standard instrumentation
• Generic trap management support
• Simplified poller creation workflow
• Facilitates visibility into the basic faults occurring in the entire wired network infrastructure
• Provides visibility into traps that are not programmed into LMS
Configuration
• Embedded tool for creating custom configuration templates
• Enhancements in Template Center to support conditional and looping configuration constructs
• Provides ability to create custom configuration templates
• Provides better utilization of the configuration template capability to configure multiple interfaces with identical commands
Usability
• Simplified install and getting started workflows
• Device center enhancements
• Helps in quickly getting started with managing the network with minimal initial setup overhead
3.2 Deploying NGEW Branch Office Using Cisco Prime LMS
Cisco Prime LMS is the flagship product for managing Cisco and third-party infrastructures. Cisco Prime LMS is used to deploy branch offices, provision services, monitor networks, and report inventory on a NGEW network. NGEW branch offices can be deployed in a matter of minutes using the Cisco Prime LMS configuration template feature. The following is a step-by-step procedure for using the configuration templates to get a branch office operational quickly.
Step 1. Importing NGEW Templates
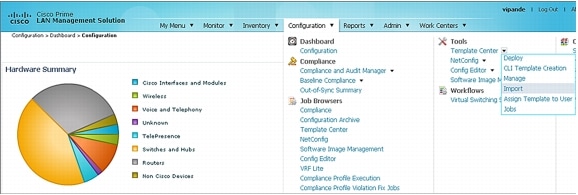
Cisco Prime LMS 4.2 provides a very convenient way to download and import templates into the application. From the main menu go to
Configuration > Template Center > Import:
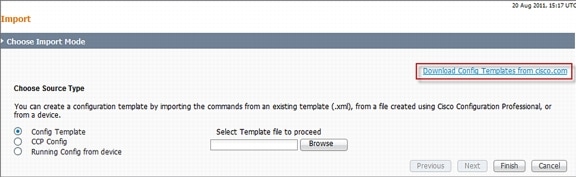
From the Import page, you can see a link
Download Config Templates from cisco.com.
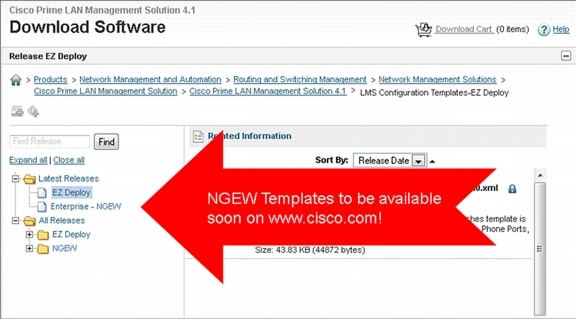
This link takes you directly to the cisco.com page, where all prebuilt LMS templates are listed. There will be a folder for NGEW in the near future (as shown in the following screenshot) where templates for pretested NGEW configurations can be downloaded.
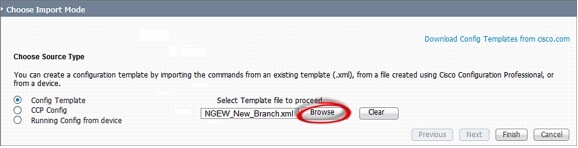
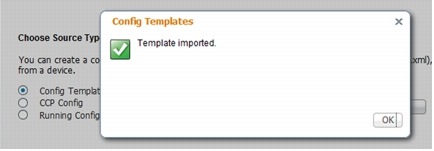
After the template is downloaded from cisco.com, the next step is to import the template into LMS using the import mode.
If you see the pop-up with a green check, you know that you have successfully imported the template.
Prebuilt templates can be modified using any text editor to adapt the template to the specifics of your network. You can also create templates from running configurations of existing devices or import them from Cisco Configuration Professional.
Step 2. Deploying NGEW Branch Office
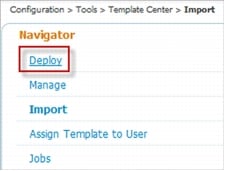
Now you can deploy the imported template using the deploy wizard. Click
Deploy from the left pane of the configuration template import mode.
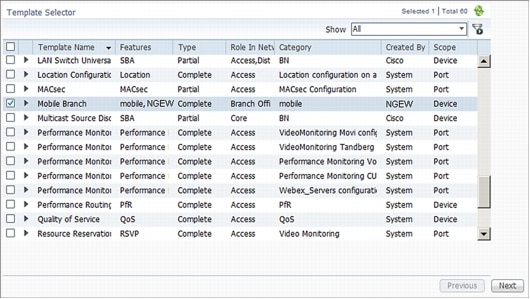
Find the NGEW template that was recently imported, and click Next to start the deploy wizard. To see what each template does, simply click the right arrow next to each of the templates.
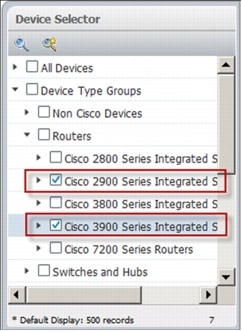
Select the devices that will be used as the new branch-office routers.
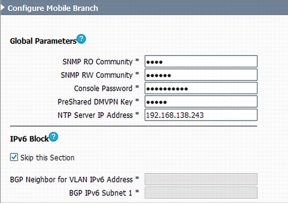
The next step generates the branch-office configuration. You may need to complete multiple configuration fields within the template. The wizard will prompt you for all information that needs to be unique for this network or a particular device using this template. Grouping of sections helps you quickly enter relevant information. Enter all of the parameters broken down by section.
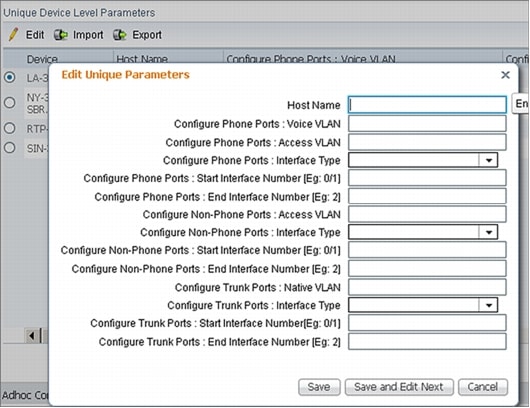
The next step allows you to enter unique values one at a time on a per-device basis. This mechanism is most efficient for up to 5 to 10 branch offices.
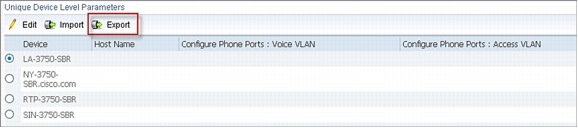
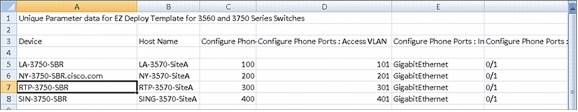
For large-scale deployments of 10+ unique branch offices where the parameters vary, there is another mechanism within the configuration template to help merge the unique variables. If a template has such unique variables, a new wizard is created automatically that allows you to export the file with devices prepopulated.
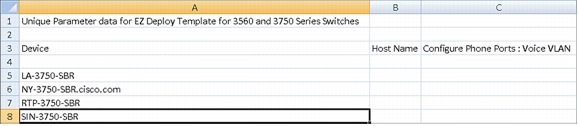
Cisco Prime LMS exports a .csv file with devices already populated, making it even easier to fill out using a spreadsheet application.
You can then fill in appropriate values:
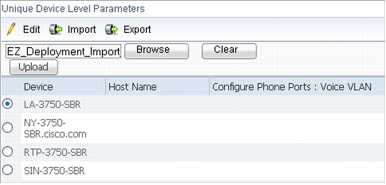
The information may then be reimported by browsing to the .csv file that has all the values filled in.
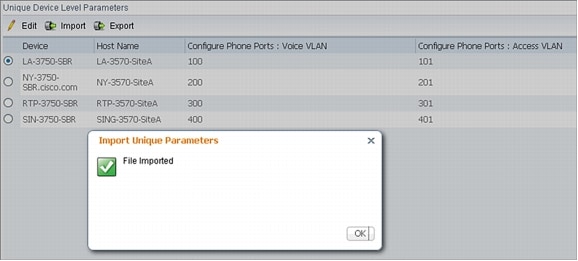
You will see a successful pop-up message with all values filled in against each of the devices.
The next step is to add other temporary commands not included in the template. The available commands will differ depending on the type of device and your role-based access permissions. You can then view the final configuration that will be passed to the device in full. This step is the final human check before pushing out the configuration. Cisco Prime LMS does other checks in the back end based on the job attributes to make sure the device and configuration are compatible and ready for the update. After the job is deployed, you can then track the job status by going to
Administrator > Job Status.
4. Day N - Monitoring and Troubleshooting Infrastructure and Services
After the NGEW branch office is deployed with all the services enabled, the next task is to make sure that those offices are operating and providing the necessary services. How do you monitor the services that are deployed on the NGEW branch offices and troubleshoot the infrastructure that they run? The Cisco Prime family of products can help monitor and troubleshoot these functions from end to end.
4.1 Infrastructure Monitoring and Troubleshooting
You can use the Cisco Prime LMS to monitor the NGEW infrastructure. With Cisco Prime LMS, you can not only monitor the basic day-to-day operational needs such as device availability, Top-N statistics, and syslogs, but you can also monitor and report on change audits and other inventory-related business needs.
4.1.1 Change Management
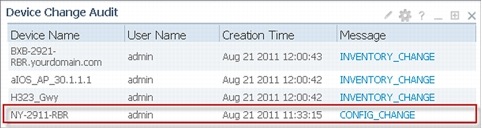
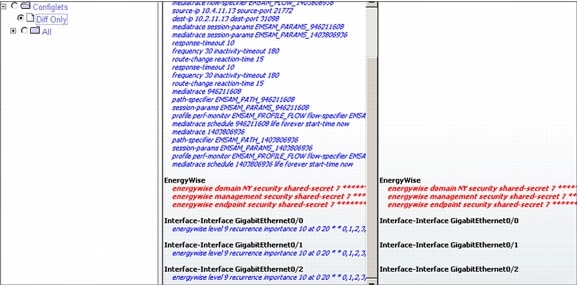
Change management, simply put, refers to retrieving information from the network in real time. These changes could be caused by replacing the device, modules, or cards within the device or other accessories within the device. Upgrading the device software or changing the device configuration would also contribute to a change that is worth tracking. You can easily track all of these changes with Cisco Prime LMS, which includes portlets that automate the task of tracking all types of change audits within the network. The following screenshot shows how you can track Inventory and Configuration audits using one of the portlets in Cisco Prime LMS:
When you click the
CONFIG_CHANGE, seeing the difference between the current and prior versions becomes a trivial task. Notice how easy it is to see the difference between the two configs:
4.1.2 Inventory and Asset Management
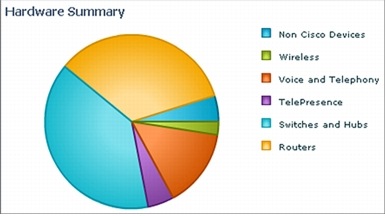
Tracking inventory is just as important as tracking the configuration changes. It is an important business function to maintain an accurate inventory of all devices on the network, including their types, installed options, and versions of software and configuration. Launching the Cisco Prime LMS Inventory dashboard quickly gives a high-level overview. You can see how many routers and switches are in the network. The graphs are clickable to further examine each type of device to see specific chassis, where it is located, and other basic system information. You can collect similar MIB-2 derived information for third-party devices as well.
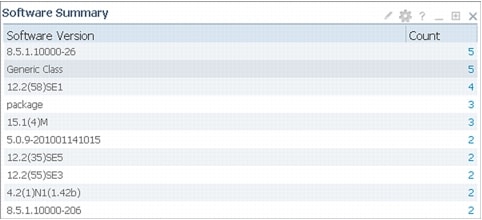
Having a chart for software images running on network devices also has its own significance. Clicking the number at the right in the screenshot that follows allows access to information similar to that of the hardware inventory. Having a table of all software versions allows you to baseline the network and to quickly spot any devices not running a standardized image.
4.1.3 Monitoring and Troubleshooting
Syslog Management
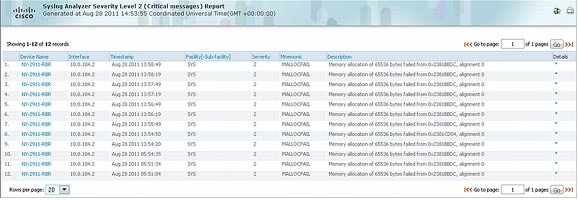
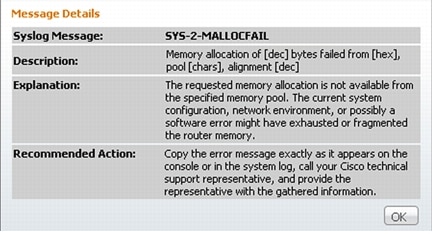
Syslogs are crucial for monitoring the network and network services. Syslogs can provide more detailed information than traps. Cisco Prime LMS takes full advantage of this fact, and helps you sift valuable meaning from the syslogs of a device. With Cisco Prime LMS, many portlets are available to give a clear view of the syslogs sent out by devices on the network. The following screenshot shows that two syslog categories that have been received need attention: memory allocation and severity level 2 syslogs. Syslog portlets are quite flexible, and you can modify them to show only syslogs that are of interest to you. You can filter them by severity or with a custom rule that you create, allowing for generation of an instant view that monitors values pertinent to this network.
As with inventory in Cisco Prime LMS, clicking the syslog type allows you to find more details and see the individual syslogs.
Cisco Prime LMS is linked with cisco.com to give you the most current information about syslog messages. By clicking
Details (shown in the right column in the previous screenshot), Cisco Prime LMS provides a detailed explanation of the syslog directly from cisco.com as well as recommended actions that you can take.
Syslog Alerts is another portlet that is quite useful in letting you know the devices that may have problems. The portlet shows any devices sending out Critical severity messages.
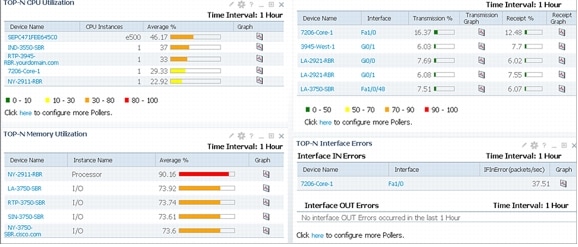
Top-N Statistics
The Monitoring dashboard is populated with the Top-N portlets for quickly spotting problems. Cisco Prime LMS has the Top-N portlets for CPU, memory, interface, errors, environmental, and other important statistics to help troubleshoot problems.
Cisco Prime LMS has many more tools to help troubleshoot network problems that are beyond the scope of this document. For more information, refer to:
http://www.cisco.com/go/lms.
4.2 Services
4.2.1 Collaboration
Cisco Prime Collaboration Manager 1.1, part of the Cisco Prime Network Management portfolio is the Enterprise platform of choice for delivering Integrated Troubleshooting with Enterprise Medianet, Cisco Mediatrace and IP Service-Level Agreement Video Operations. These capabilities are essential when video services are deployed in the branch office, Collaboration Manager can easily discover the video infrastructure and provide overall health. Cisco Prime Collaboration Manager 1.1 allows you to visualize, monitor, and troubleshoot video service for a Next Generation Enterprise WAN deployment.
New Capabilites in Cisco Prime Collaboration Manager 1.1:
• End-to-end visibility, real-time troubleshooting and inventory support for Cisco TelePresence® EX and C Series (Release 1.0 included Cisco TelePresence System endpoints only)
• Support for scheduled meetings from Cisco TelePresence Management Server (Release 1.0 included Cisco TelePresence Manager)
• At-a-glance executive summaries and out-of-the box simplified use and diagnostic reports
• Ability to initiate Performance Monitoring on-the-fly providing deeper visibility on medianet-enabled networks into flow statistics at hotspots (Release 1.0 introduced Cisco Mediatrace and IP-SLA VO)
• Integration with other Cisco Prime management systems (LMS and NAM) offering critical diagnostic information about the network along the video path
Collaboration Manager provides Real-time visualization of in-progress video collaboration sessions, detailed end-to-end visibility into the media path, at-a-glance executive summaries to identify critical outages, and simple out-of-the-box reporting to view utilization and problem trends. When a network includes medianet-capable devices, Cisco Prime Collaboration Manager provides even deeper network path visibility, down to the granularity of video flow statistics.
To help ensure a superior end-user experience, Cisco Prime Collaboration Manager Speeds troubleshooting and recovery from service-affecting problems, provides detailed analysis to quickly pinpoint service-degrading network devices, delivers reports that help you manage your key assets and track usage. In addition, Cisco Prime Collaboration Manager efficiently validates large-scale deployments. It comprehensively evaluates the inventory, health, and status of Cisco TelePresence endpoints, as well as service and network infrastructure devices.
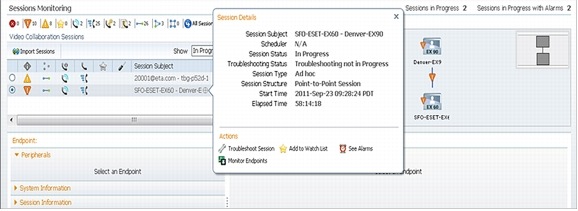
Collaboration Manager offers an easy way to see how many sessions are active at any time within the video network. Simply go to
Monitor > Session Monitoring to see the sessions that are in progress in the network. In the screen shot below you can see a video session between Tandberg EX-60 and EX-90.
This screenshot clearly tells you if the endpoint is experiencing any session errors. To further probe the cause of any problems and initiate troubleshooting, use the cursor to hover over the Session Subject and a Session Details screen will pop-up as shown in the screen shot below.
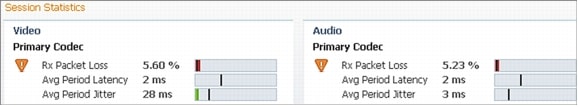
Click one of the endpoints on the right side to see detailed statistics:
Click
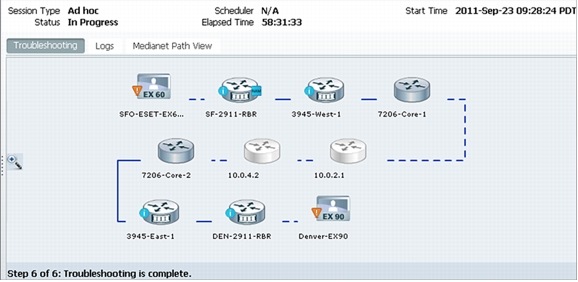
Troubleshoot Session to let Collaboration Manager quickly identify the areas in the network that might be causing the problem. Collaboration Manager gives you a visual trace between the two endpoints:
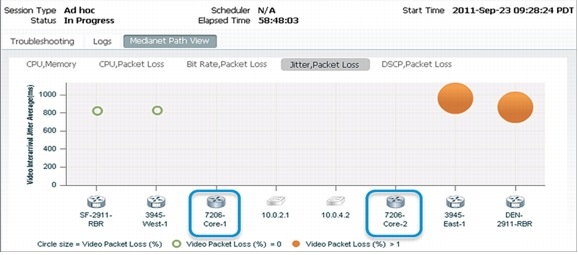
Notice that the device icons change based on the capabilities that are enabled on the devices. Medianet-capable devices have a "film strip" on the edge. Click
Medianet Path View to instantly see all the intermediate devices on the x-axis. Various other parameters such as CPU, memory, packet loss, and jitter are plotted on the y-axis. The size of the bubble indicates the magnitude of the second variable of the tab. For example, in the screenshot note that jitter is indicated by the y-axis, whereas the size of the bubble indicates packet loss.
Use the cursor to hover over the bubble to see the severity of the packet loss and, more importantly, where the packet loss is first detected. You can see in the path view in the previous screenshot that there is relatively little packet loss at the 3945-East-1 router as compared to the LA-2921-RBR router. Clicking the bubble provides additional information related to the video flow that can also help in troubleshooting video.
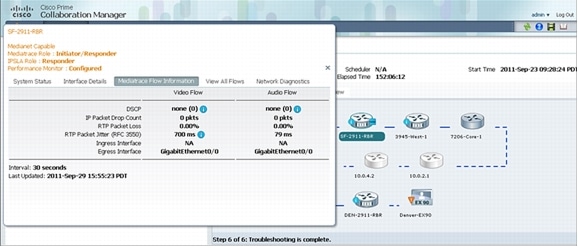
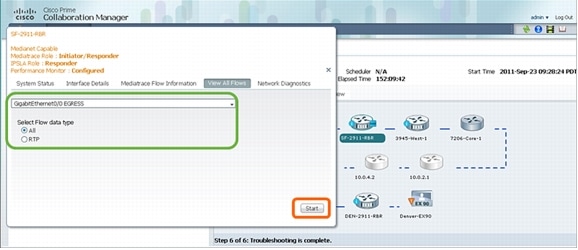
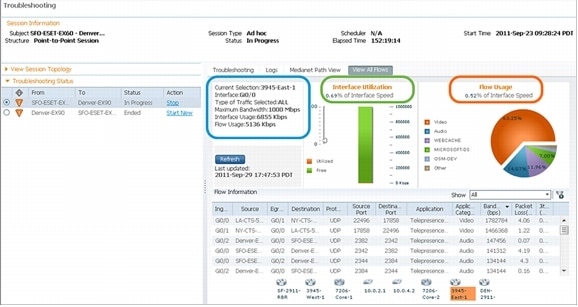
Cisco Prime Collaboration Manager 1.1 also provides the ability to the network admin to initiate Performance Monitoring on the fly. Click on the "View All Flows" tab in the above pop-up, select the Flow Data type (All/RTP) and hit "Start".
This will bring up another summary screen which will give you a good idea of how much of the interface capacity etc is being used for this session:
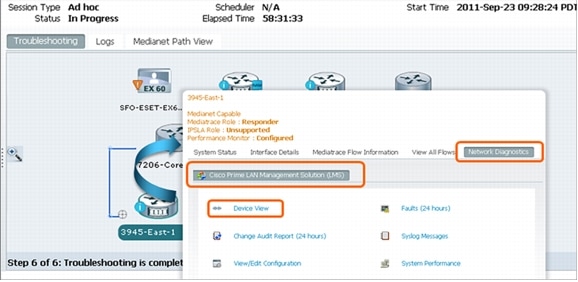
Cisco Prime Collaboration Manager 1.1 also provides Integration with other Cisco Prime management systems (LMS and NAM) offering critical diagnostic information about the network along the video path.
Once you use the "Troubleshoot Session" utility from Session Monitoring as explained earlier in this document, you can click on a Medianet enabled router in the path (ISR-G2 3945 in the screen shot below)
à go to "Network Diagnostics"
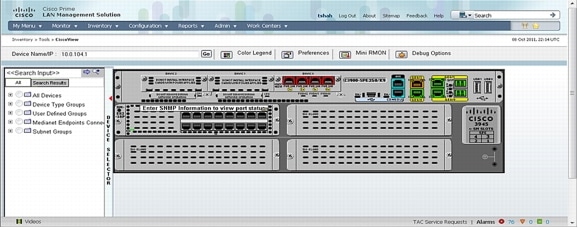
àCisco Prime LMS
à Device View and other links.
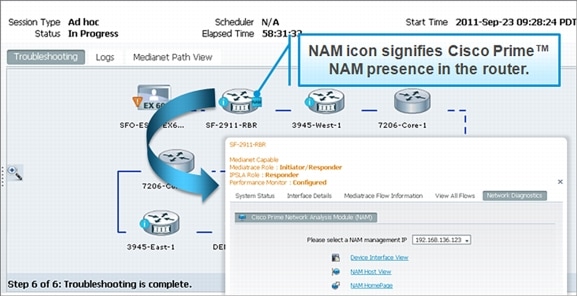
Cisco Prime Collaboration Manager also offers integration with Cisco Prime NAM. Once you use the "Troubleshoot Session" utility from Session Monitoring as explained earlier in this document, you can click on a NAM enabled router in the path (ISR-G2 2911 in the screen shot below)
à go to "Network Diagnostics"
àCisco Prime Network Analysis Module (NAM)
à Select a NAM IP and then you can get access to multiple options: Device Interface View, NAM Host View & NAM Home Page as shown below:
Cisco Prime Collaboration Manager ver 1.1 Supported Devices:
Cisco Prime Assurance Manager collects, normalizes and correlates data across multiple sources of embedded performance instrumentation, such as NetFlow, Network Based Application Recognition (NBAR), Cisco IOS
® Software Performance Agent (PA) and Cisco Medianet Performance Monitor. Branch-office and headend devices capable of exporting performance metrics in Flexible NetFlow Version 9 (FNFv9) format can export information to the Cisco Prime Assurance Manager for further analysis. Additionally, CPAM monitors the health and utilization of network devices. All the data collected is presented as views into a particular Site, Interface, Application, Service or End-User while hiding the complexity of managing multiple data sources. These correlated end-to-end views, which bring together network, traffic, application and user information simplifies monitoring and accelerates troubleshooting.
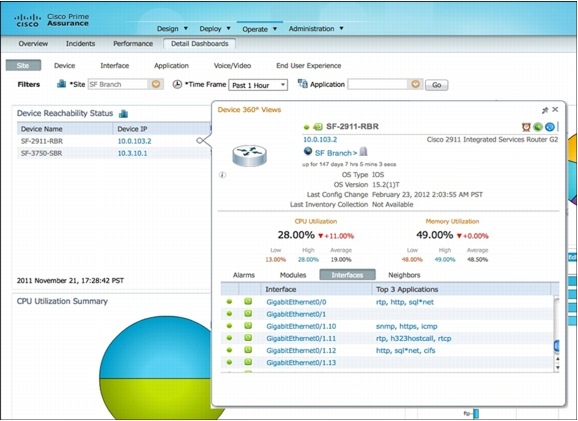
The Site Dashboard below displays the health of network devices in the site, the application traffic in the site, as well as the end-user experience of applications as indicated by the transaction time.
Cisco Prime Assurance Manager 1.1 also includes 360 degree views for devices. This further enables effective troubleshooting by bringing together all the device information like health, alarms, events, top application traffic on interfaces, etc into a single view. The troubleshooting context, in this case the site view, is maintained while viewing device specific information in the 360 degree window. As an example this enables the user to correlate the alarms with the configuration change, or identify which are the critical interfaces depending on which applications flow through them.
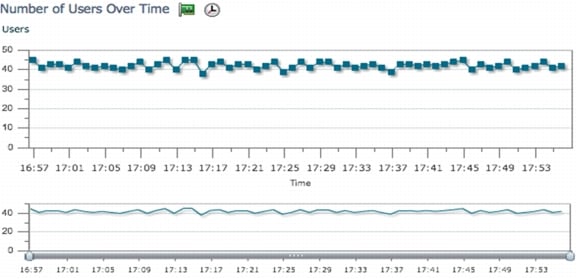
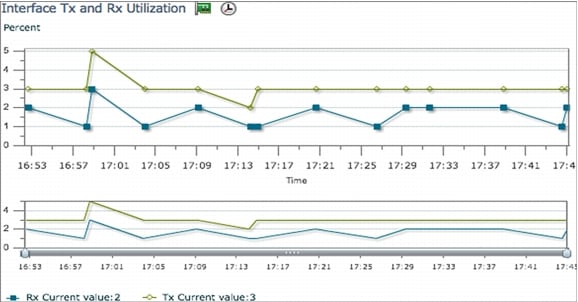
Clicking on a specific interface will bring up the Interface view, which further indicates the number of users on this interface, the interface utilization, the applications flowing through the interface. By selecting the WAN interface, the admin will get insight into trending and baselining of the branch usage.
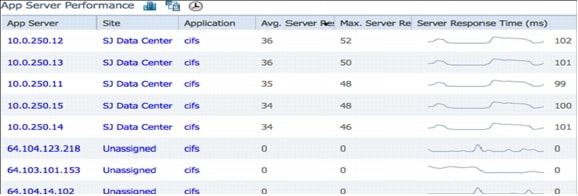
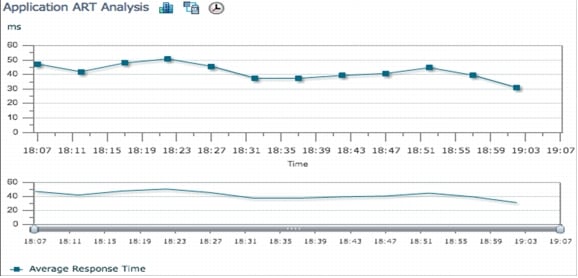
The Cisco Prime Assurance Manager can also provide end-to-end visibility into application health. The Application dashboard shows the sites having the worst experience for the application, cifs in this case. It also shows the health of the application servers, the top users of this application, the application usage trend and tools to further analyze and troubleshoot the application response time (ART).
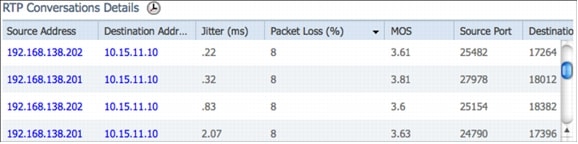
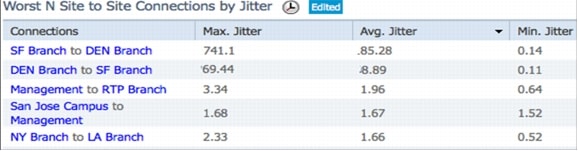
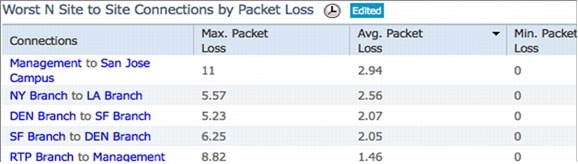
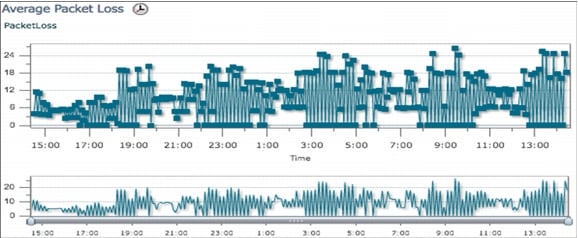
Similar to end-to-end application views, views are also available for end-to-end service performance such as Voice/Video service. The Voice/Video Dashboard shows site-to-site key performance indicators that affect service quality such as jitter and packet loss. In a large network the Cisco Prime Assurance Manager can provide service health between sites, and the Cisco Prime Collaboration Manager can be used to troubleshoot specific video sessions and identify exactly where the jitter/packet loss is getting injected between the sites.
To help troubleshoot end-user experience issues, the Cisco Prime Assurance Manager provides an End-User Experience dashboard, where the specific user's experience can be compared to that of other users from the same site. This helps in insolating the issue to the user, the site, or the application.
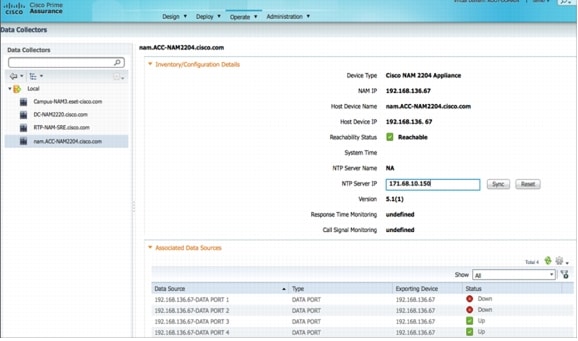
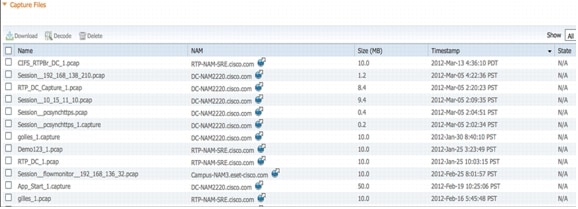
Another component of the Cisco Prime Assurance portfolio is the
Cisco Prime Network Analysis Module (NAM). The NAM can analyze live traffic streams and provide packet analysis capabilities for advanced troubleshooting. For visibility into WAN Optimized environments, the NAM collects information from the Cisco Wide Area Application Services (WAAS) Flow Agent (FA) and the Cisco IOS
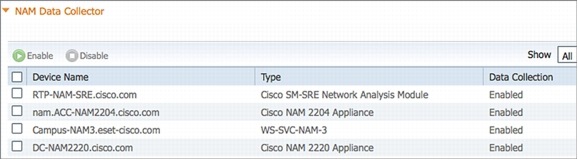
® Software Performance Agent (PA). NAM provides the network administrator with network performance dashboards such as Top-N applications, application throughput, and application response time. The Cisco Prime Assurance Manager also provides centralized management and reporting of all the NAM data from multiple NAMs.
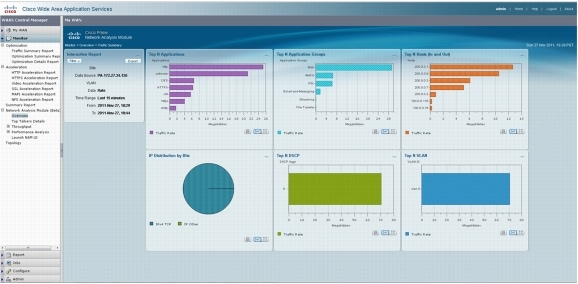
NAM can also be integrated with Cisco WAAS Central Manager (CM) to provide the network administrator with a combined view of the network performance, user experiences, and optimization statistics.
WAN optimization technology such as Cisco WAAS uses TCP proxy, which splits a TCP connection into multiple segments within the network (client segment, WAN segment, and server segment). Traditional network performance reporting, which relies on Switched Port Analyzer (SPAN), may not be able to accurately provide the application response time. Cisco Prime NAM fully interoperates with Cisco WAAS to correctly report application response time with WAN optimization. The network administrator can use application response time information along with optimization statistics to quantify WAN optimization ROI.
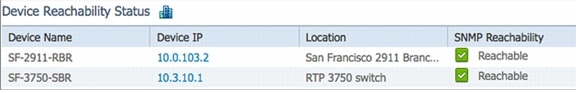
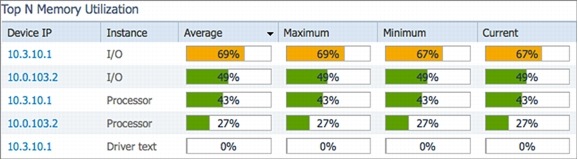
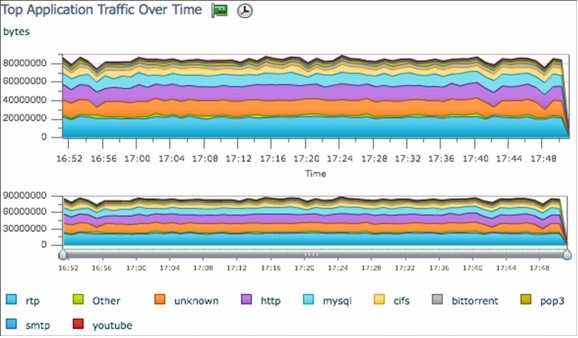
The following screenshot shows the NAM dashboard accessible through Cisco WAAS CM. From the WAAS CM menu, select
Monitor > Network Analysis Module > Overview to display high-level information about applications at the chosen site such as Top-N Applications, Top-N Hosts, etc.
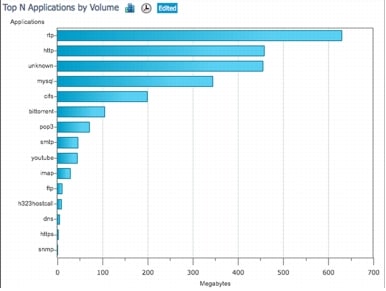
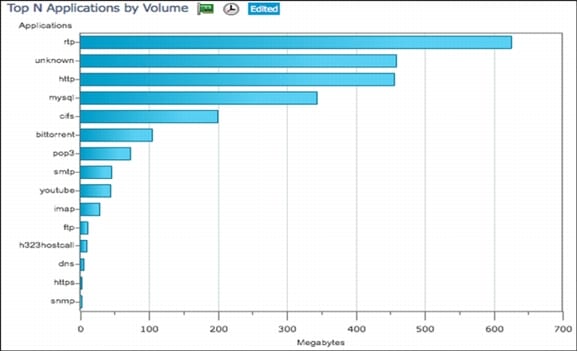
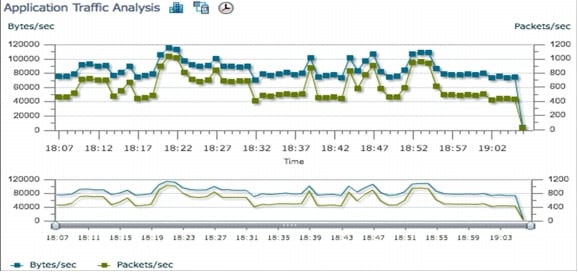
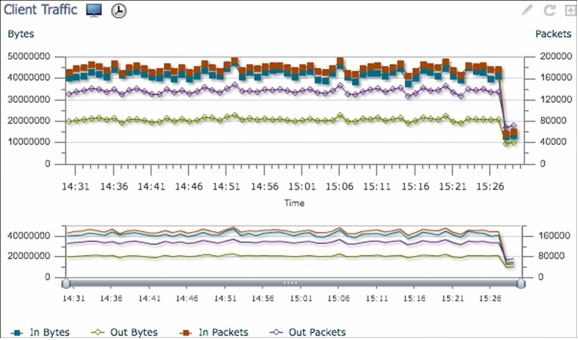
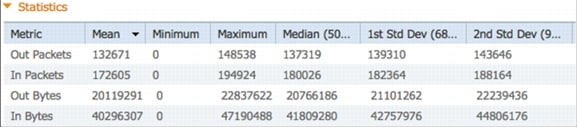
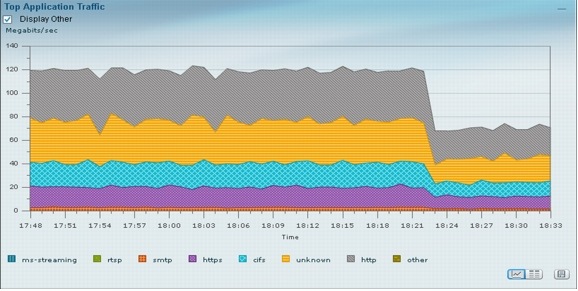
From the same WAAS Central Manager menu, the network administrator can find more information about the application throughput (volume) over time by selecting
Monitor > Network Analysis Module > Throughput > Top Applications.
The following screenshot shows the change in traffic rate after applying traffic shaping:
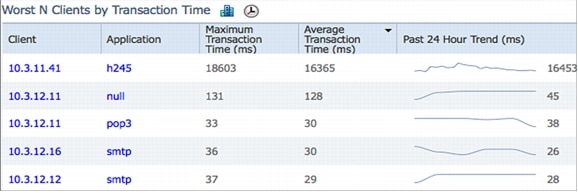
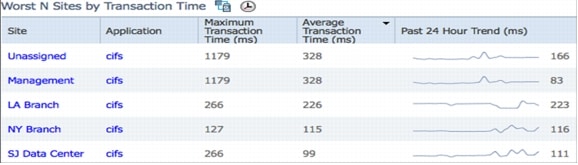
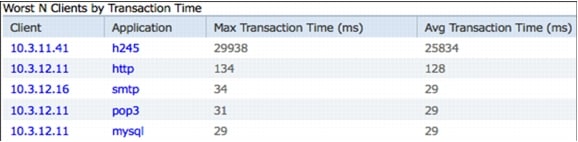
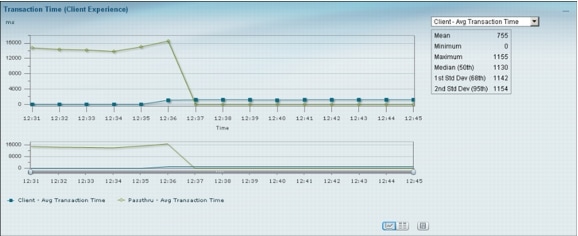
NAM can also provide response-time information that is collected from either Cisco IOS Performance Agent available within a Cisco Integrated Services Routers Generation 2 (ISR G2) router, or WAAS Flow Agent available within all WAAS appliances. Response time provides information about the transaction time and the server delay that is relevant to measuring or quantifying user experience accessing applications. Go to
Monitor > Network Analysis Module > Performance Analysis > Application to see the transaction time. The screenshot shows a significant improvement in application transaction time after enabling WAN optimization.
The table below lists the hardware and software products for NGEW RWAN.
Product List
Role
Hardware or Software
Software Version
Standard branch office
Cisco 2951 Integrated Services Router (ISR)
High-density packet voice video digital signal processor module for Cisco Unified Communications Solutions (PVDM3-256)