Network Insights – Resources for Cisco ACI and Cisco DCNM Based Data Center Fabrics White Paper
Available Languages
Bias-Free Language
The documentation set for this product strives to use bias-free language. For the purposes of this documentation set, bias-free is defined as language that does not imply discrimination based on age, disability, gender, racial identity, ethnic identity, sexual orientation, socioeconomic status, and intersectionality. Exceptions may be present in the documentation due to language that is hardcoded in the user interfaces of the product software, language used based on RFP documentation, or language that is used by a referenced third-party product. Learn more about how Cisco is using Inclusive Language.
Troubleshooting, root-cause analysis, and remediation of network issues are common challenges for any infrastructure operation. They require network administrators to have years of experience, a high level of domain expertise, and the ability to correlate complex IT environments to prevent or fix issues while upholding the infrastructure uptime to honor Service-Level Agreements (SLAs) with minimum disruption. The Network Insights – Resources App (NIR) builds a persistent knowledge base, including expertise and a correlation matrix, to automate troubleshooting, root-cause analysis, and remediation while enabling infrastructure owners to comply with SLAs required by businesses.
Modern data centers are managed through controllers such as Cisco ACI™ or Cisco DCNM which capture the intents of network and security architects and administrators and delivers an automated, consistent policy framework across the data center. The same intent-based policies can be extended to multiple data center sites, remote branches and offices, and cloud service providers, giving centralized control and keeping the infrastructure running with desired policies, postures, and controls.
Inbuilt automation: Administrators are no longer exposed to risk of box-by-box configuration. Architects are no longer exposed to the risks of feature disparity, interoperability, and manual assurance of consistent configurations.
Scalable architecture: As the network’s scope grows from a single data center to multi-site, remote locations, and the cloud, so does its scale. Sometimes single sites can grow up to scale of a few hundred leafs. With this comes the complexity of collecting and analyzing data on everything that is happening in this infrastructure. A data-center infrastructure can be running anywhere between a few thousand to a few million flows. Considering the scale of the infrastructure, at times there may be few hundred messages or events being logged every second.
Operations test: The challenge faced by administrators is to comprehend and correlate all these to a particular problem, such as (for example) slowness in a web application. This includes an implicit expectation that an administrator has the required knowledge and expertise (which usually takes time to build) about most if not everything happening in the infrastructure.
Audit: Another challenge that administrators face is furnishing proof or evidence of that, despite an actual problem, there is no deficiency in the network infrastructure, and that the source of the problem lies elsewhere. Administrators may require proof of persistent trends or patterns for audit, compliance, or even capacity planning and infrastructure reassessment.
At a fundamental level, notwithstanding the scale and complexity of an infrastructure that is ever growing, administrators are expected to prevent problems and recover from them faster when they do occur.
Network insights - Resources addresses these challenges.
Network Insights - Resources (NIR)
NIR is a tool; its GUI is integrated as a plugin into the Cisco ACI APIC controller and Cisco DCNM GUI. NIR attracts administrator’s attention to significant matters relevant to the task at hand, such as troubleshooting, monitoring, auditing, planning, etc. NIR broadly consists of the following components:
● Event analytics: This is software telemetry that leverages audit logs and events and faults data from the Cisco ACI fabric.
● Resource utilization: This is useful for capacity planning because it offers early detection of resources that are exceeding capacity thresholds.
● Environmental: Identifies anomalies by observing parameters such as CPU, memory, temperature, power draw, fan speed, etc.
● Flow analytics: Helps identify, locate and root-cause data path issues such as latency and packet drop for specific flows.
Event analytics is tuned for control-plane events in the infrastructure. It performs the following:
● Data collection: configuration changes and control plane events and faults.
● Analytics: Artificial Intelligence (AI) and Machine-Learning (ML) algorithms determine the correlations between all changes, events, and faults.
● Anomaly detection: output of AI and ML algorithms (unexpected or downtime-causing events).
● Remediation: recommends steps for administrators to take against a particular anomaly.
The event analytics dashboard displays faults, events, and audit logs in a time-series fashion. Clicking on any of these points in the history displays its historical state and detailed information.
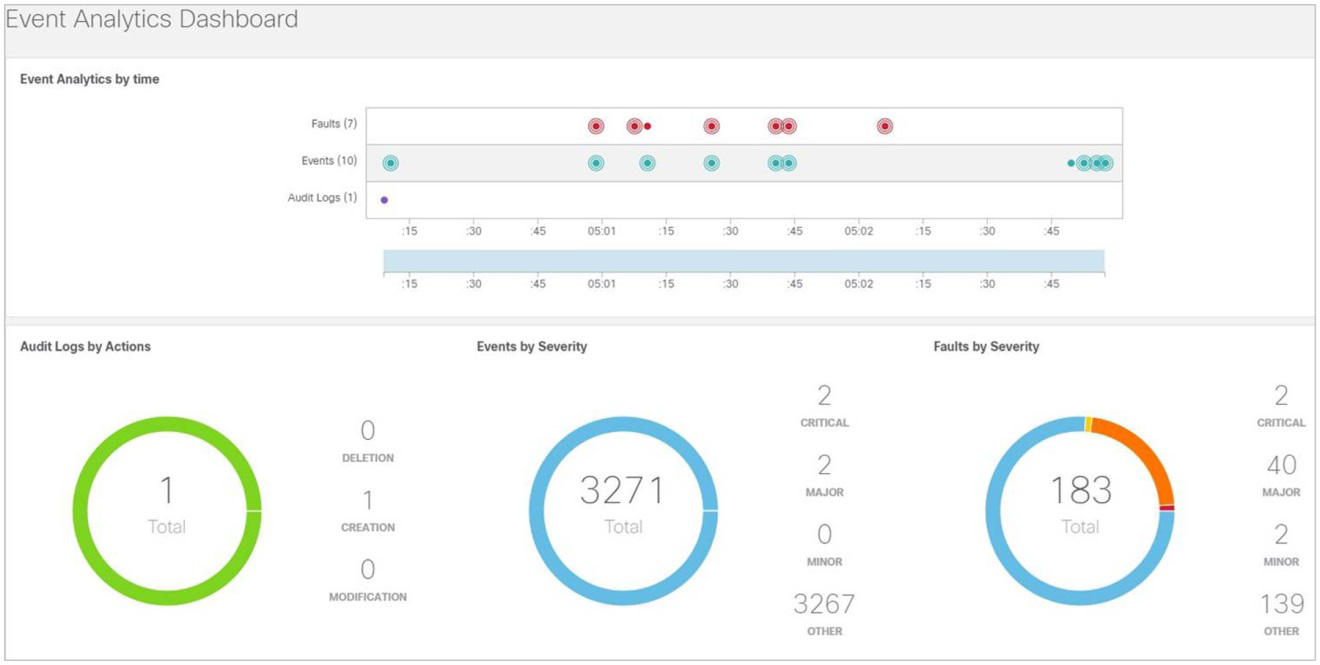
Event Analytics Dashboard
● Audit logs: Show the creation, deletion, and modifications of any object in Cisco ACI – for example, subnet, IP address, next-hop, EPG, VRF, etc. This is useful for identifying recent changes that may be a potential reason for unexpected behavior. It can aid in reverting back changes to a stable state and help assign accountability. The facility of the filters makes it convenient to narrow focus to specific changes by severity, action, description, object, etc. Drilling down on the audit logs provides details for each log.
● Events: Shows operational events in the infrastructure; for example, IP detach/attach, port attach/detach on a virtual switch, interface state changes, etc.
● Faults: Are mutable, stateful and persistent managed objects and show issues in the infrastructure; for example, invalid configurations. This function speeds up administrator action toward problem rectification, thus reducing the time lost in root-cause analysis and rectification, which usually requires multiple steps, expertise, correlation of symptoms, and perhaps a bit of trial and error.
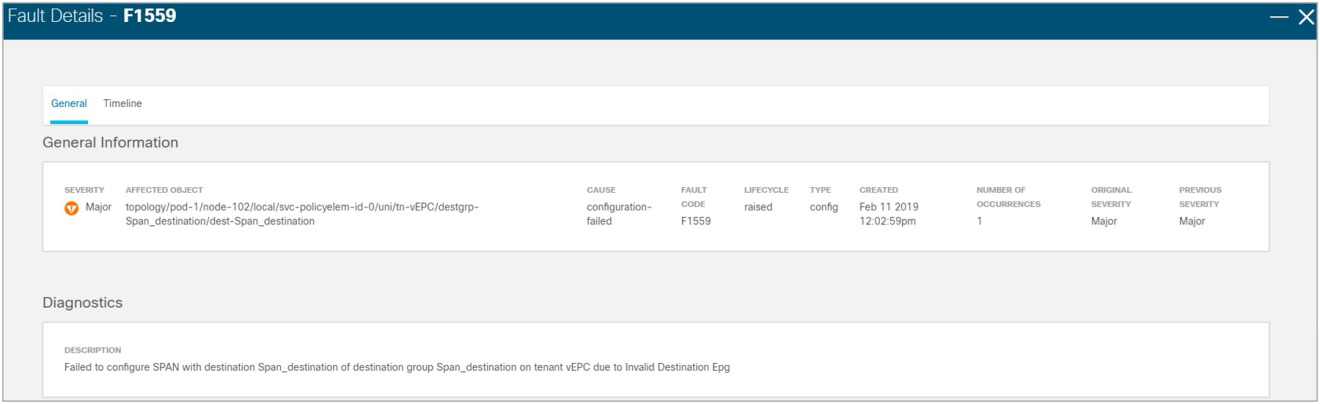
Fault Details
The zoom in and out function in the timeline bar helps to quickly contract or expand the timeline under investigation, as shown in the two screenshots below.
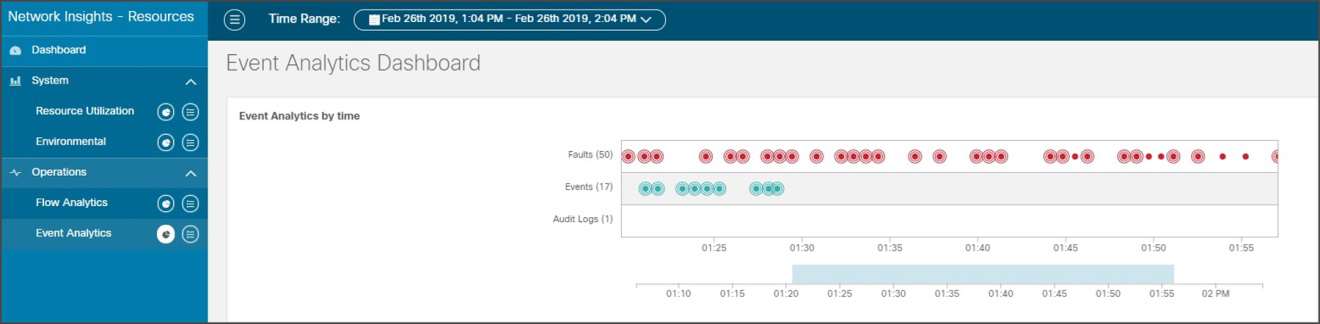
Nexus Insights Resources - Timeline Bar
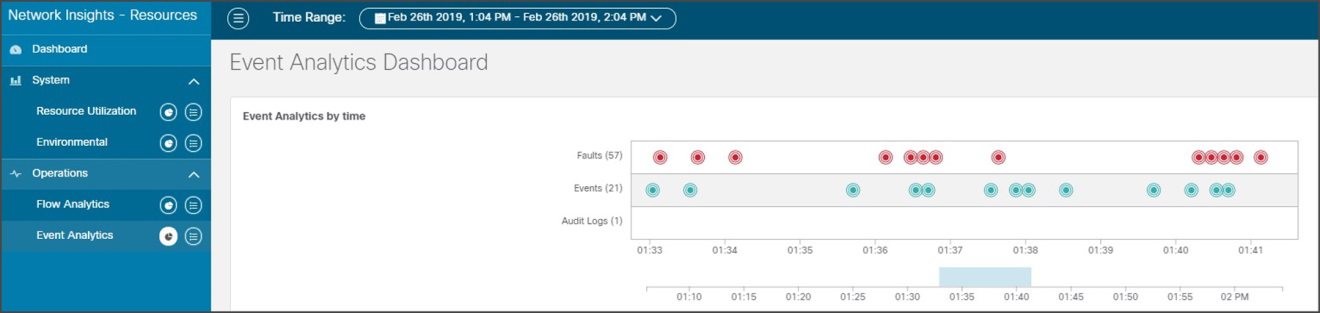
Nexus Insights Resources - Timeline Bar
Resource utilization shows time-series based trends of capacity utilization. Persistent trends help identify burdened pieces of infrastructure and plan for resizing, restructuring, and repurposing. Spikes help to identify transient issues and draw administrator attention for remediation.
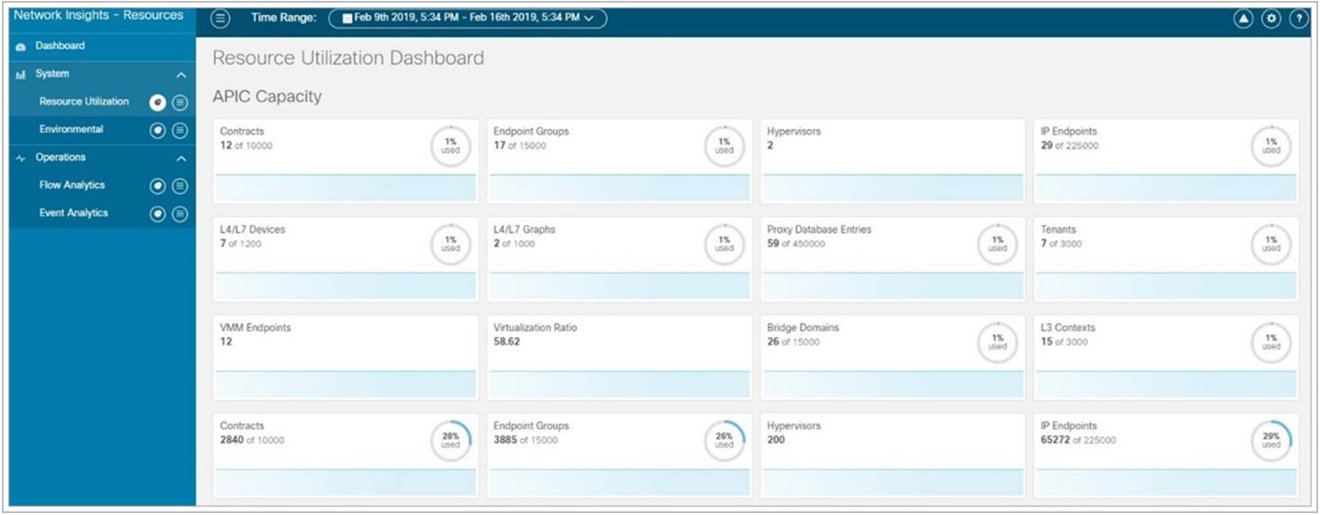
Resource Utilization
Resource utilization categorizes capacity utilization as follows:
● Operational resources: This displays the capacity of transient resources that are dynamic in nature and expected to change over short intervals. Examples are routes, MAC addresses, security TCAM, etc.
● Configuration resources: This displays the capacity utilization of resources that are dependent on configurations, such as the number of VRFs, bridge domains, VLANs, EPGs, etc.
● Hardware resources: This displays port and bandwidth-capacity utilization.
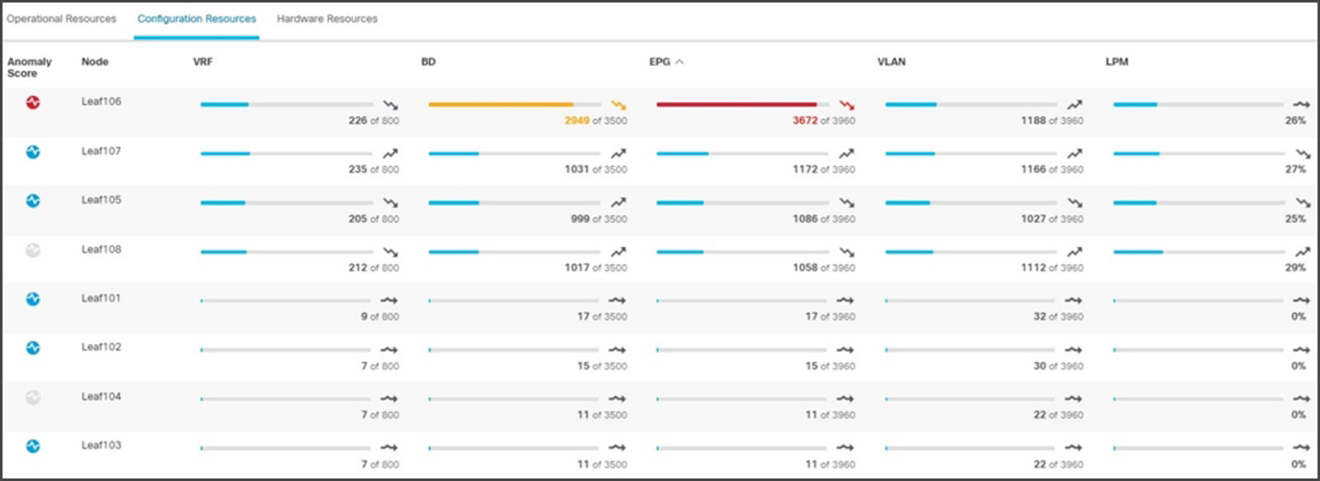
Configuration Resources
Drilling down on any device shows the details of processes that are high consumers of resources. Once resource utilization crosses a 70 percent capacity threshold, it is color-coded orange; beyond 80 percent, it is color-coded red. This helps attract the administrator’s attention to resources requiring attention.
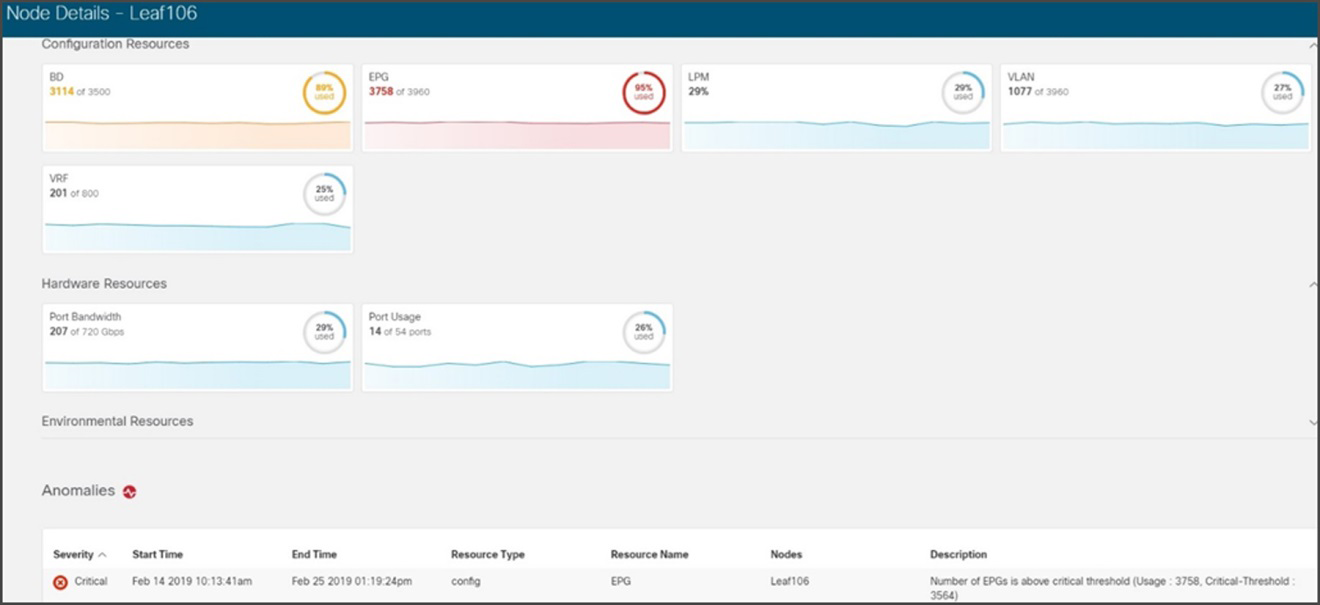
Node details
● Predicts anomalies based on historical trends and rates of change and forecasts resource shortages; see the screenshot below for an example.
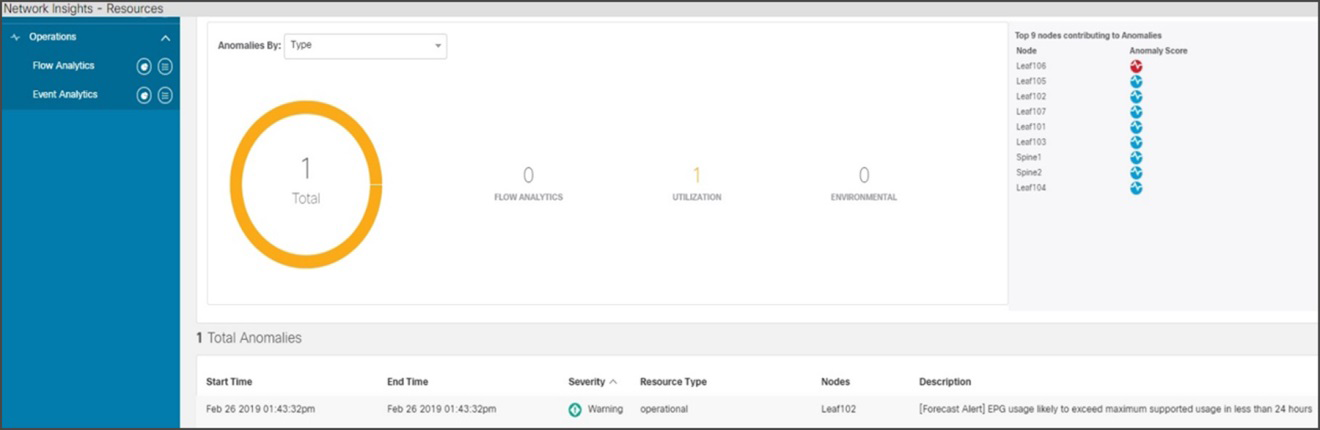
Predict anomalies
Environmental provides anomaly-detection capabilities in hardware components such as CPU, memory, temperature, fan speed, etc. As in the other screens, it highlights components exceeding thresholds and requiring the administrator’s attention.
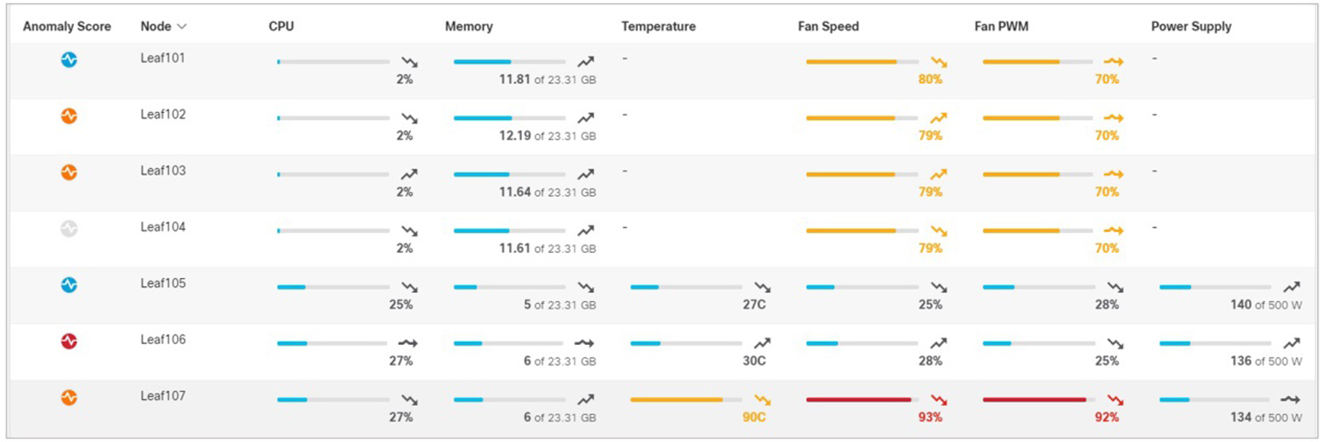
Environmental
Screens with more details provide additional visibility into hardware component anomalies.
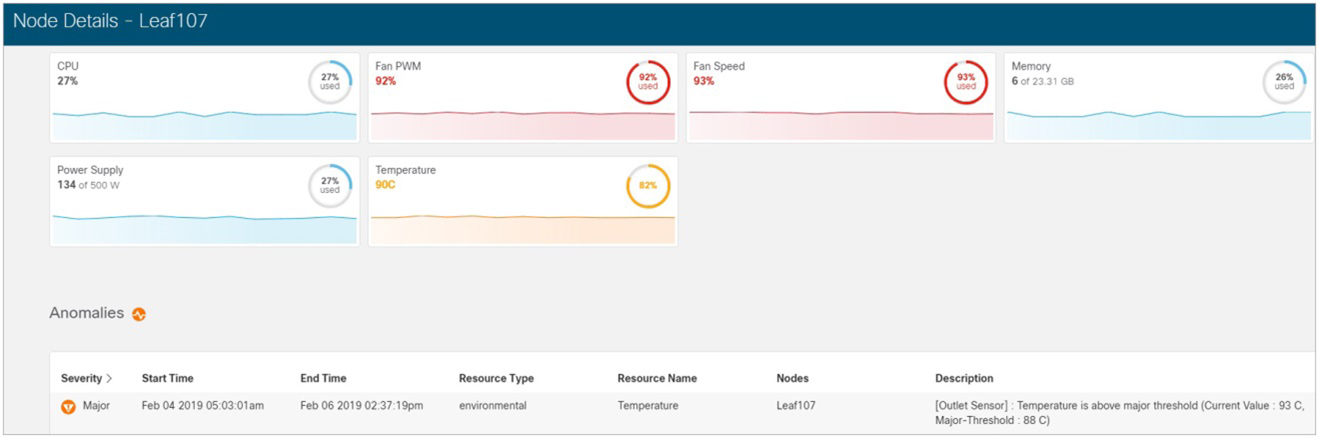
Leaf node details
To turn on flow analytics, please click on flow collection rules, as shown in the screenshot below.
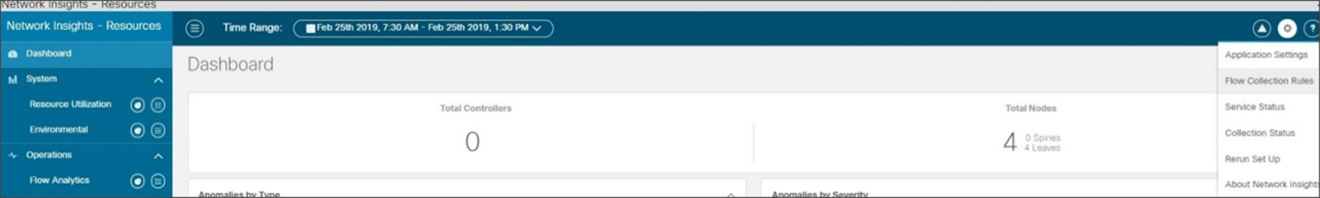
Flow Analytics
In the next screen, as shown below, select the VRF to monitor flows.
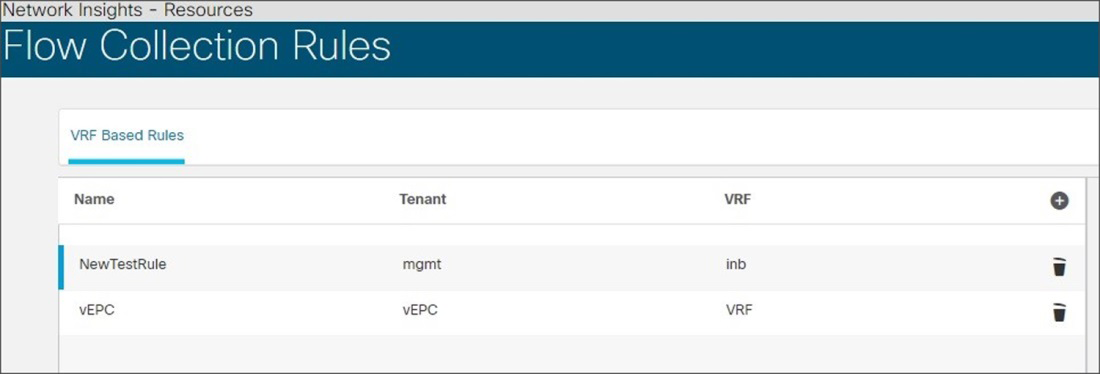
Flow Collection Rules
Flow analytics is designed to identify data-plane anomalies in the network. The flow analytics dashboard attracts administrator attention to key indicators of infrastructure data-plane health. Time-series data offer evidence of historical trends, specific patterns, and past issues and helps the administrator build a case for audit, compliance, and capacity planning or infrastructure assessment. The flow analytics dashboard provides a time-series-based overview, as shown below, with the capability to drill down on specific functions by clicking on the graph.
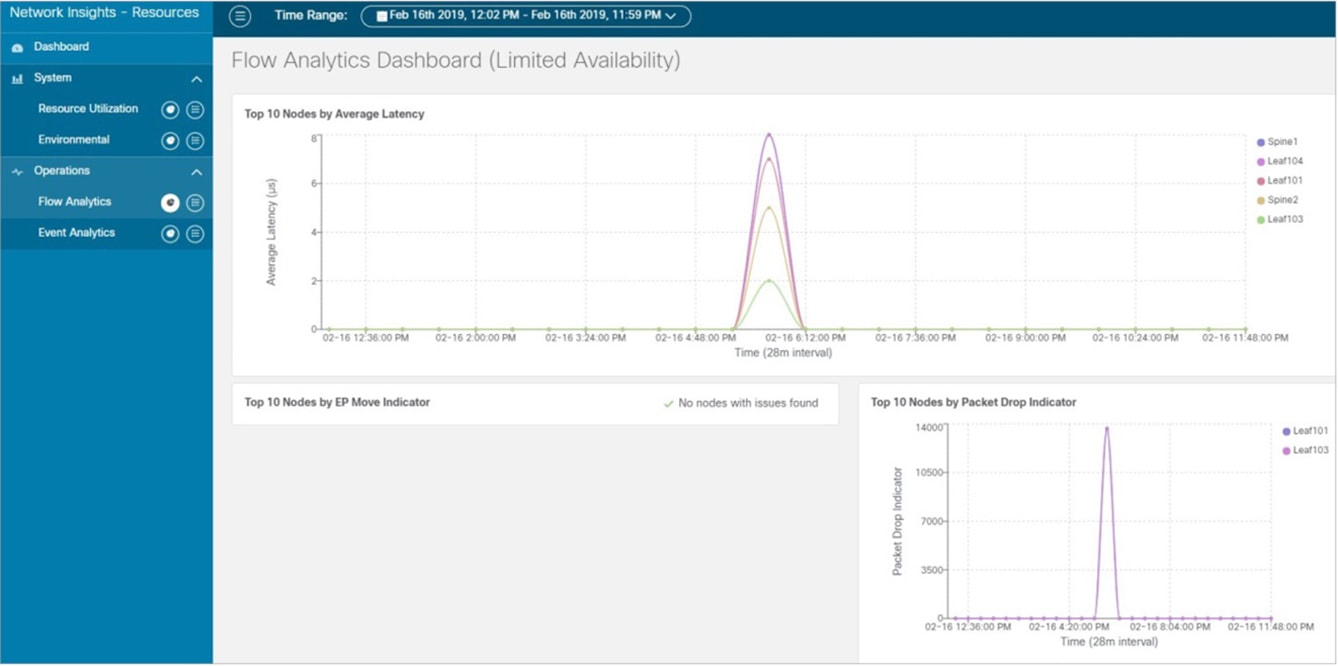
Flow Analytics Dashboard (Limited Availability)
● Packet drop indicator: Shows time-series-based packet drop statistics. Clicking on a particular leaf drills down to detailed flow data, including at which exact point in the fabric the drop occurred, as shown in the two graphics below. This saves precious minutes during troubleshooting and helps administrators focus their attention on specific potential problem-points in the infrastructure.
Packet drop indicator
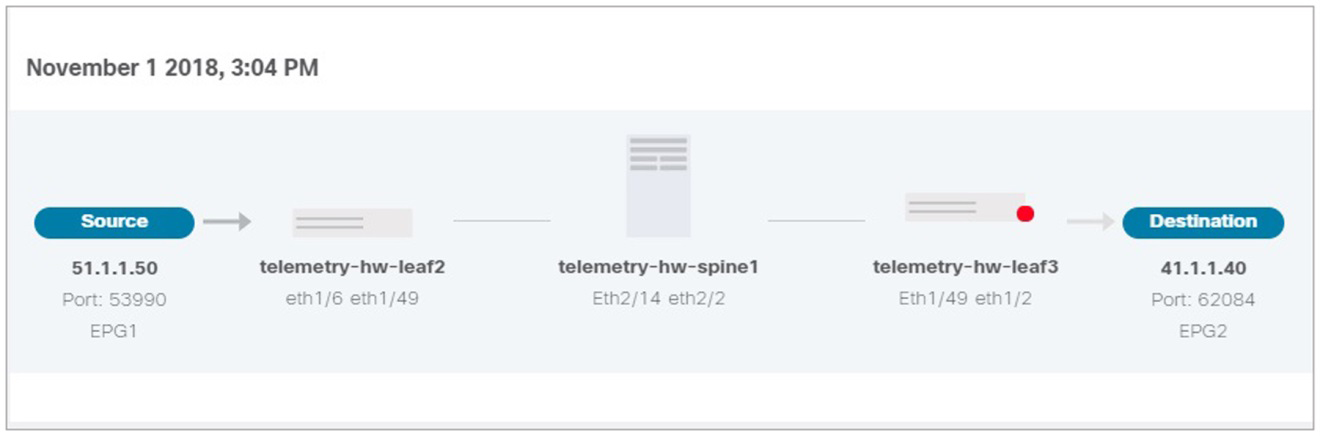
Packet drop indicator
● Latency: Shows time-series-based latency statistics. Clicking on a particular leaf drills down to detailed flow data, including latency numbers, the exact path of the flow in the fabric, and the end-to-end latency. This takes away trial-and-error and manual steps otherwise required to pinpoint latency hot spots in the infrastructure. This leads administrators to focus on the root causes of the latency and remediate them. Historical trends help administrators identify persistent problems and re-evaluate the infrastructure capacity.
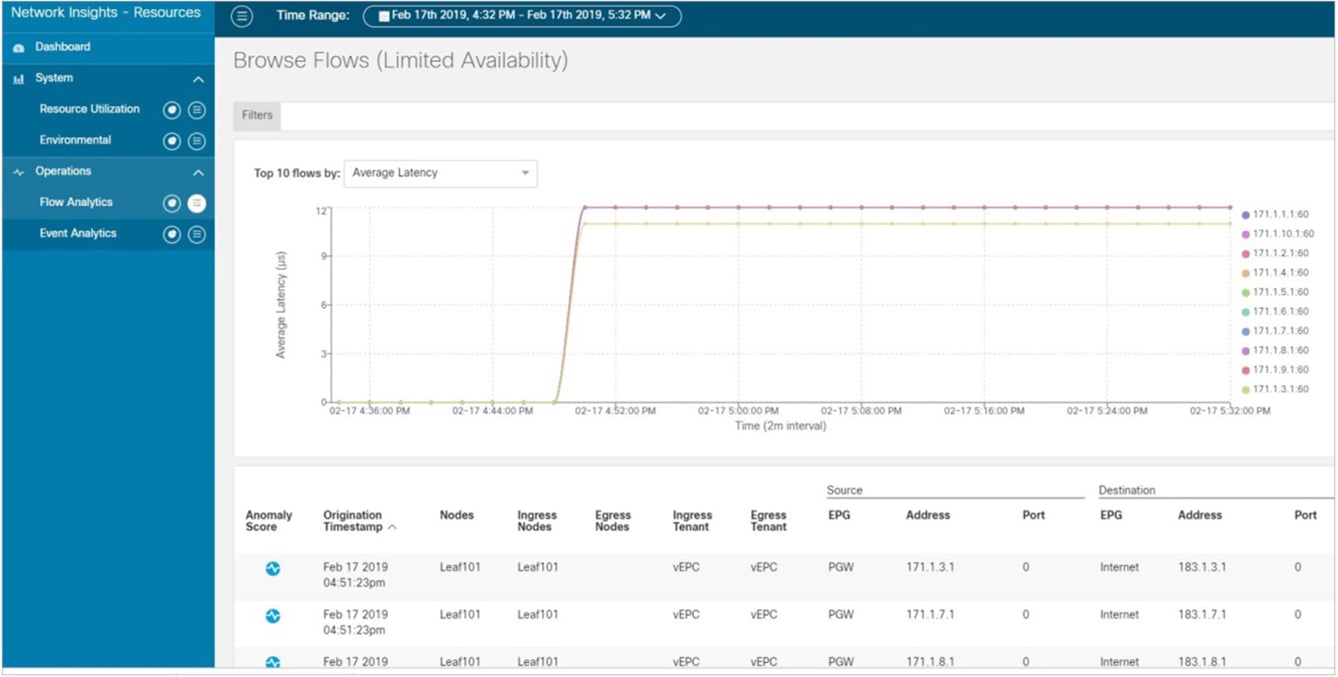
Browse Flows (Limited Availability)
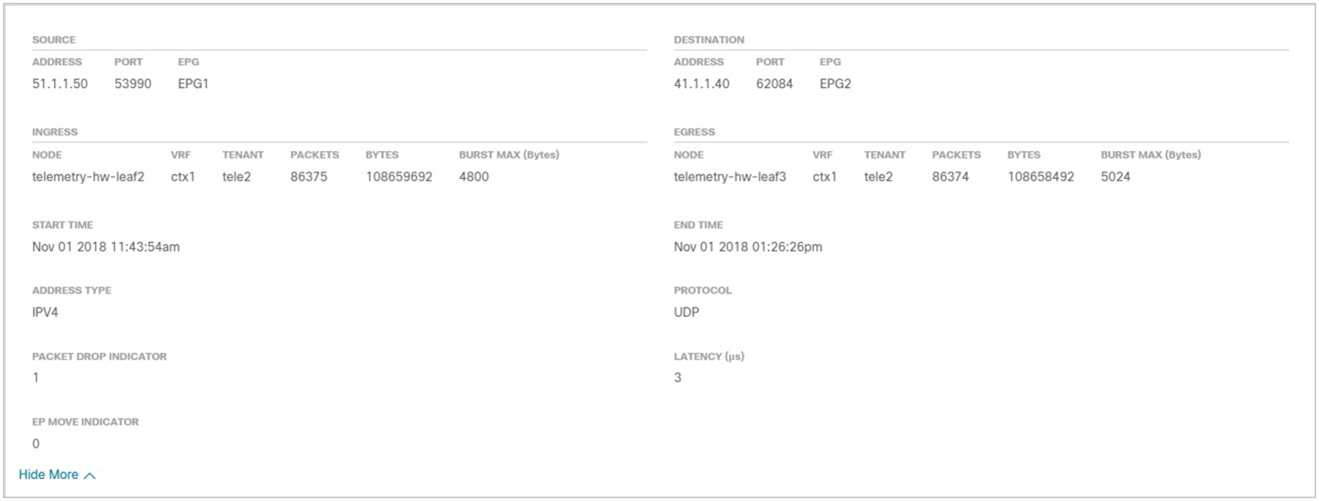
As seen in the screenshot below, by clicking on a particular leaf node in the flow analytics screen, we drill down to flows with a latency anomaly observed on a particular leaf. It also shows the exact flows that experienced the increased latency. Double-clicking on the flow shows the flow level details.
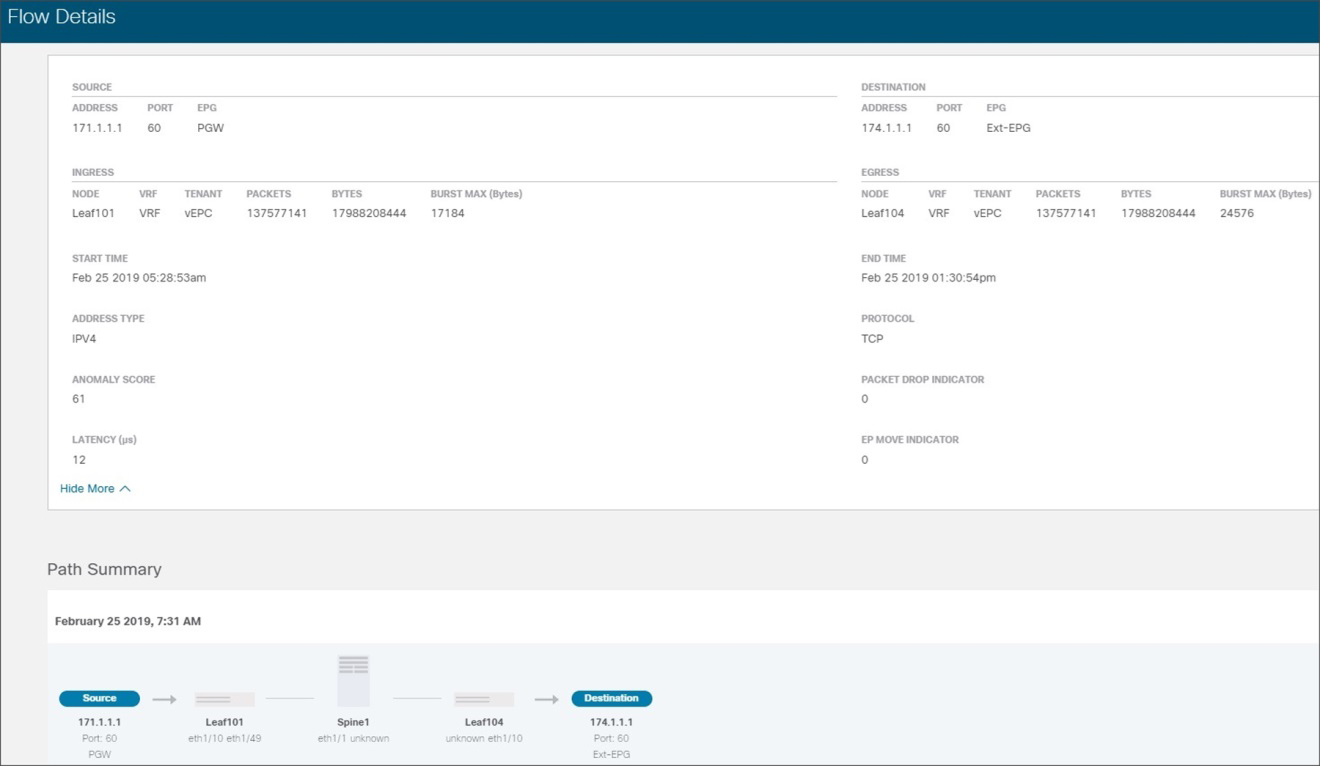
Flow Details
Details of the flow, such as burstiness, help identify and remediate bandwidth issues or apply appropriate Quality of Service (QoS) levels.
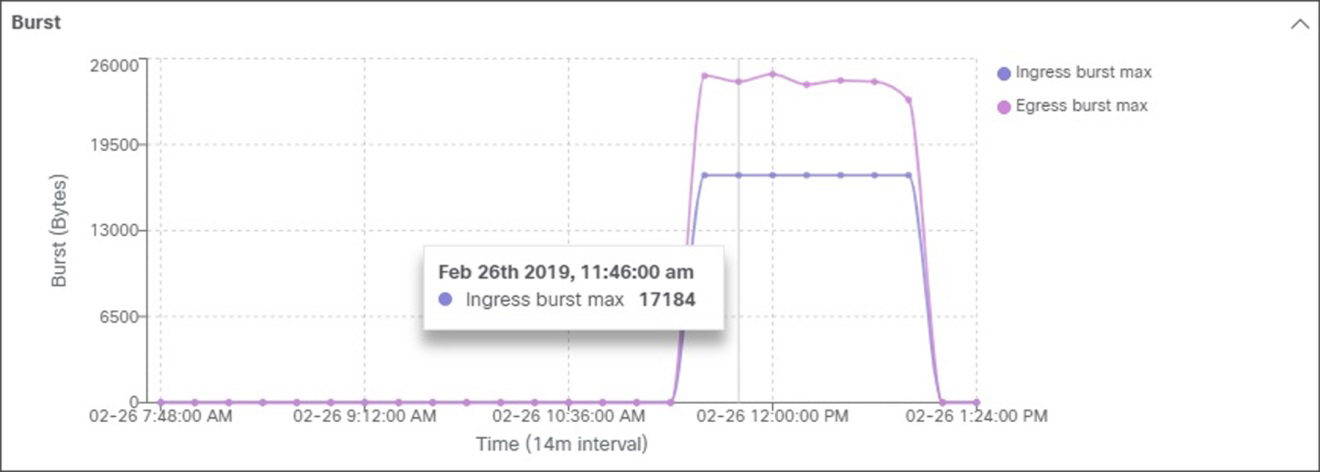
Burst
● EP move indicator: Shows time-series-based endpoint movement in the fabric. In virtualized data-center environments, this keeps track of virtual machine movement, which is extremely useful to identify its current location and its historical movements in the fabric. It provides proof points in establishing virtual-machine movements and thus aids constructively in problem solving while working with other IT teams. See the screenshot below.
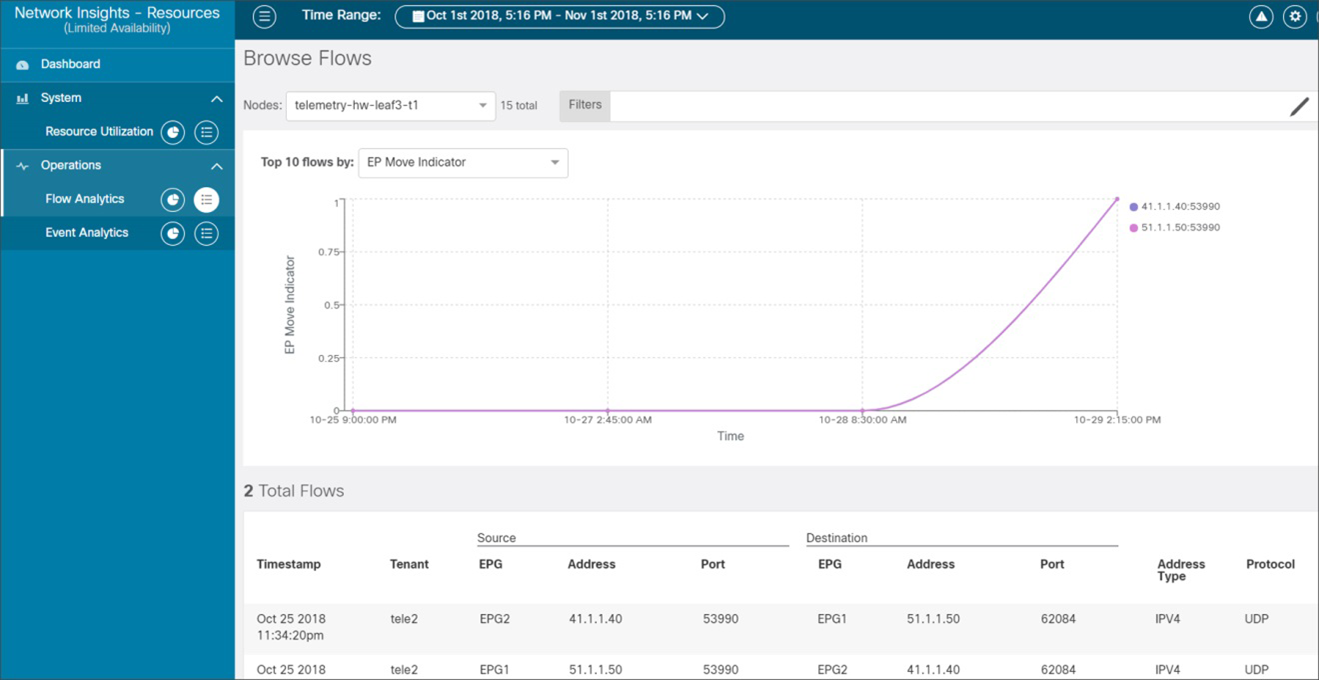
Browse Flows
● For ACI based deployment –
◦ NIR app can be installed on existing APIC M3/L3 cluster to use resource utilization, environmental, event analytics and Statistics functions.
◦ To use flow analytics, NIR app should be installed on Services engine appliance cluster which is targeted to ship Q3 CY19.
● For DCNM based deployment
◦ NIR app on existing DCNM cluster to use resource utilization, environmental, and Statistics functions.
◦ Flow analytics will be supported CY19. Service engine appliance cluster is not required.
● For the steps to install the NIR App, click here.
● To download the NIR App, click here.
The NIR App is supported on Cisco ACI and Cisco DCNM. Please click here to refer release notes for latest software compatibility information.
Successive generations of hardware and software enhance telemetry capabilities. The table below maps NIR functions to hardware platforms.
NIR features support for Cisco ACI
| NIR App function |
Cisco Nexus® 9300/9700 EX series |
Cisco Nexus 9300/9700 FX series |
Cisco Nexus 9300/9700 FX2 series |
| Resource Utilization |
Yes |
Yes |
Yes |
| Environmental |
Yes |
Yes |
Yes |
| Statistics |
Yes |
Yes |
Yes |
| Event Analytics |
Yes |
Yes |
Yes |
| Flow Analytics |
Target CY19 |
Yes |
Yes |
NIR features support for Cisco DCNM
| NIR App function |
Cisco Nexus® 9300//9500 series |
Cisco Nexus® 9300//9500 EX series |
Cisco Nexus 9300/9500 FX series |
Cisco Nexus 9300/9500 FX2 series |
| Resource Utilization |
Yes |
Yes |
Yes |
Yes |
| Environmental |
Yes |
Yes |
Yes |
Yes |
| Statistics |
Yes |
Yes |
Yes |
Yes |
| Flow Analytics |
Not supported |
Target CY19 |
Target CY19 |
Target CY19 |
Scalability of the NIR App:
● Number of leafs supported with NIR installed on APIC M3/L3 cluster (No Flow Telemetry): 100
● Number of leafs supported with NIR installed on DCNM cluster: 250
● Number of leafs supported with NIR installed on Services Engine: 250
● Number of targeted active flows: 10,000
For licensing details, please refer to the Cisco Nexus Insights datasheet.
For ordering information, please click here.
Alternately, Contact your Cisco Account team to learn future pricing and get additional details.
● NIR App Flow Analytics, NetFlow, and Cisco Tetration™ cannot be simultaneously enabled. Only one of these features can be enabled at a time.
Network Insights - Resources (NIR) automates a vast range of information gathering, tracking data about the infrastructure, learning of new events and determining their cause, and highlighting unexpected occurrences in the network while at the same time helping network administrators plan ahead, comply with policies and audits, and keep track of infrastructure capacity and uptime.
Network Insights - Resources attempts to be an extension of the administrator’s brain to prevent failure in the network, or to focus attention on remedial steps to recover faster from failure when it does occur.