Cisco Nexus Dashboard Data Broker Data Sheet
Available Languages
Bias-Free Language
The documentation set for this product strives to use bias-free language. For the purposes of this documentation set, bias-free is defined as language that does not imply discrimination based on age, disability, gender, racial identity, ethnic identity, sexual orientation, socioeconomic status, and intersectionality. Exceptions may be present in the documentation due to language that is hardcoded in the user interfaces of the product software, language used based on RFP documentation, or language that is used by a referenced third-party product. Learn more about how Cisco is using Inclusive Language.
Traffic monitoring in the past used to be the traditional means to manage network operations. Today, along with network management, traffic monitoring plays a bigger role in providing pervasive visibility throughout your network, be it a data center, enterprise, and/or service provider. Pervasive visibility provides useful information that helps to proactively engage with customers and increase your business advantage. This advantage can be gained by using the right packet-broker solution. Cisco Nexus® Dashboard Data Broker provides the right feature-set that such a modern solution needs.
Monitor network traffic to gain business advantage
Every enterprise depends on the smooth running of its business applications and the underlying infrastructure. Visibility into application traffic has traditionally been important for infrastructure operations to maintain security, resolve problems, and perform resource planning. Now, as a result of technological advances and the ubiquity of the internet, organizations increasingly are seeking not just visibility but real-time feedback about their business systems to more effectively engage their customers. Essentially, traffic monitoring is evolving from a tool that manages network operations to a tool for achieving smart business agility that can constructively affect the revenue of the business. In addition to out-of-band traffic monitoring, migration to 40/100/400 Gbps in aggregation and core network infrastructure is presenting new challenges for inline traffic monitoring at the perimeter of the network.
Using Cisco Nexus Dashboard Data Broker controller software and dedicated Cisco Nexus switches, Cisco provides a new software-defined approach for monitoring both out-of-band and inline network traffic.
Scalable TAP and SPAN aggregation with Cisco Nexus Dashboard Data Broker
Cisco Nexus Dashboard Data Broker is a simple, scalable, and cost-effective solution to monitor higher-volume and business-critical traffic. It replaces traditional purpose-built matrix switches with one or more Cisco Nexus 3000 or 9000 series switches (in a dedicated data broker role) that you can interconnect to build a scalable network Test Access Port (TAP) and Cisco Switched Port Analyzer (SPAN) aggregation infrastructure that supports 1, 10, 25/40, 100, and 400 Gbps port bandwidth capacity and you can dedicate these ports both for TAP and SPAN and for traditional Ethernet connectivity.
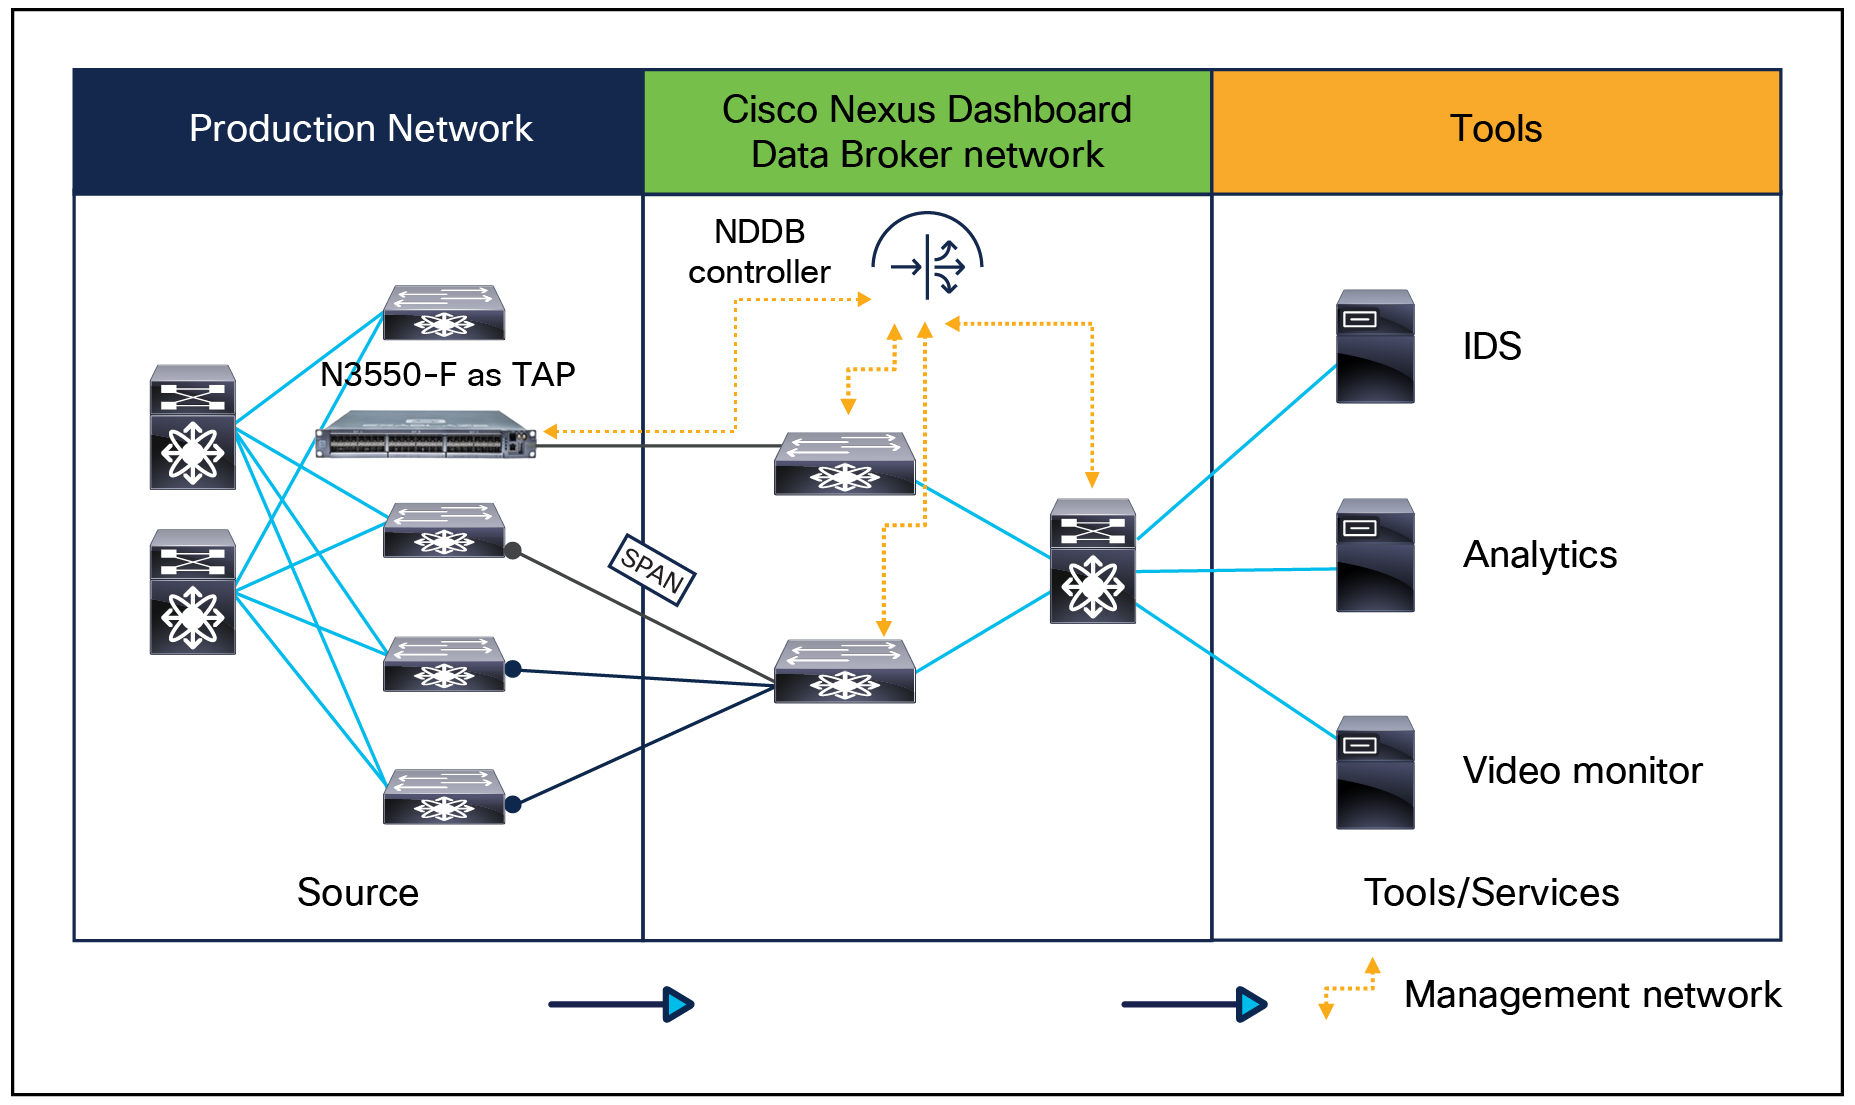
Traffic is tapped into this bank of switches in the same manner as in a matrix network. However, because the data broker lets you interconnect the Cisco Nexus switches to build a scalable TAP and SPAN aggregation infrastructure, you can use a combination of TAP and SPAN sources to bring the copy of the production traffic to this visibility infrastructure. You also can distribute these TAP and SPAN sources and traffic monitoring and analysis tools across multiple Cisco Nexus switches. The monitoring and analysis tools can be physical appliances or virtual machines. Figure 1 shows the two key parts that form the Cisco Nexus Dashboard Data Broker solution. The first of these is the Cisco Nexus switches that provide aggregation, filtering, replication, and redirection capabilities. The second is the controller, which pushes the configuration to the switches to perform these functionalities.
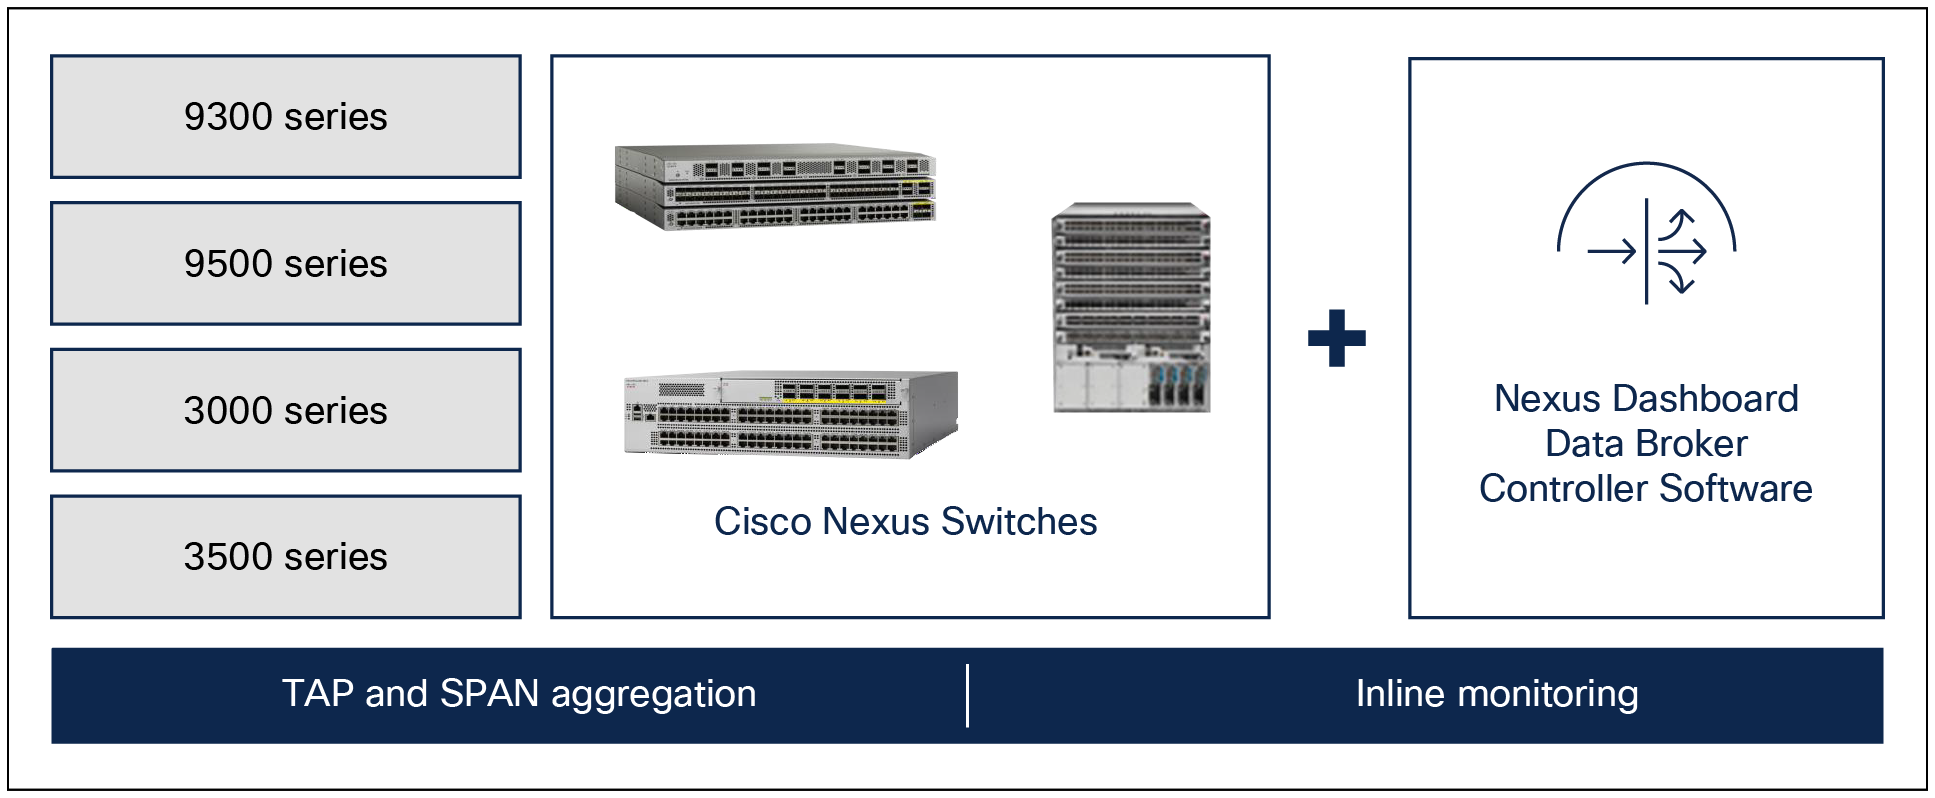
Cisco Nexus Dashboard Data Broker solution
Using Cisco Nexus 9000 platform switches, customers can build a high-density, 10, 25/40-, 100, and 400 Gbps visibility infrastructure. The Cisco Nexus switches form a dedicated Nexus Dashboard Data Broker (NDDB) switch, which connects to the production network to aggregate the copy traffic using TAP and SPAN methods. The aggregated traffic is filtered and redirected to tools based on the policy configured by the customer.
The data broker controller can be deployed in the following modes:
● Centralized: The controller is deployed on a VM/server/bare metal outside the TAP aggregation switches. In this mode, the controller can support a multi-switch TAP aggregation topology.
● Embedded: The controller is deployed on the TAP aggregation (NDDB) switch using guest shell. In this mode, the solution can only be used as a single switch deployment.
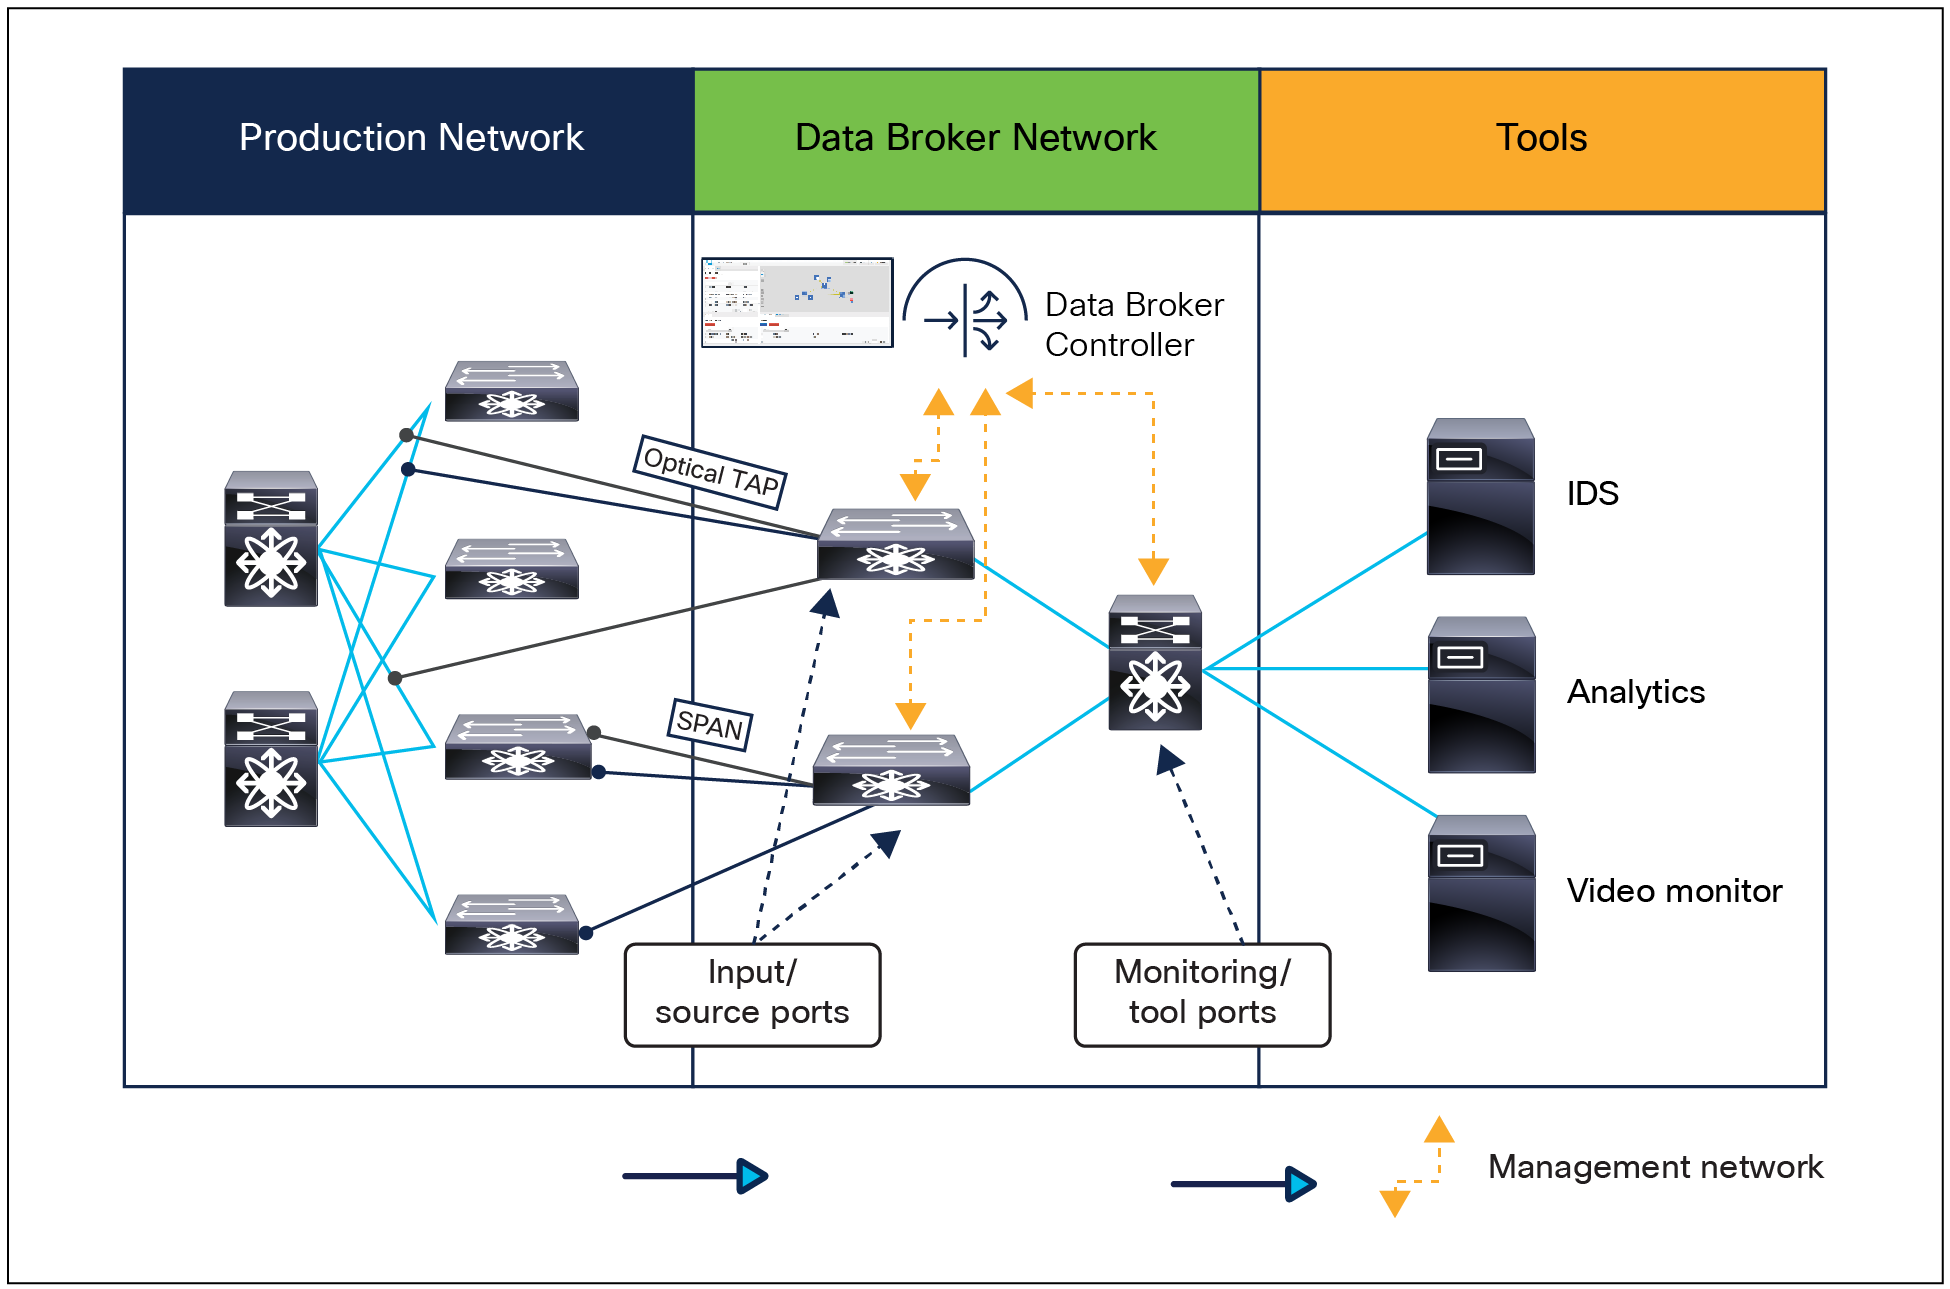
Nexus Dashboard Data Broker centralized deployment model
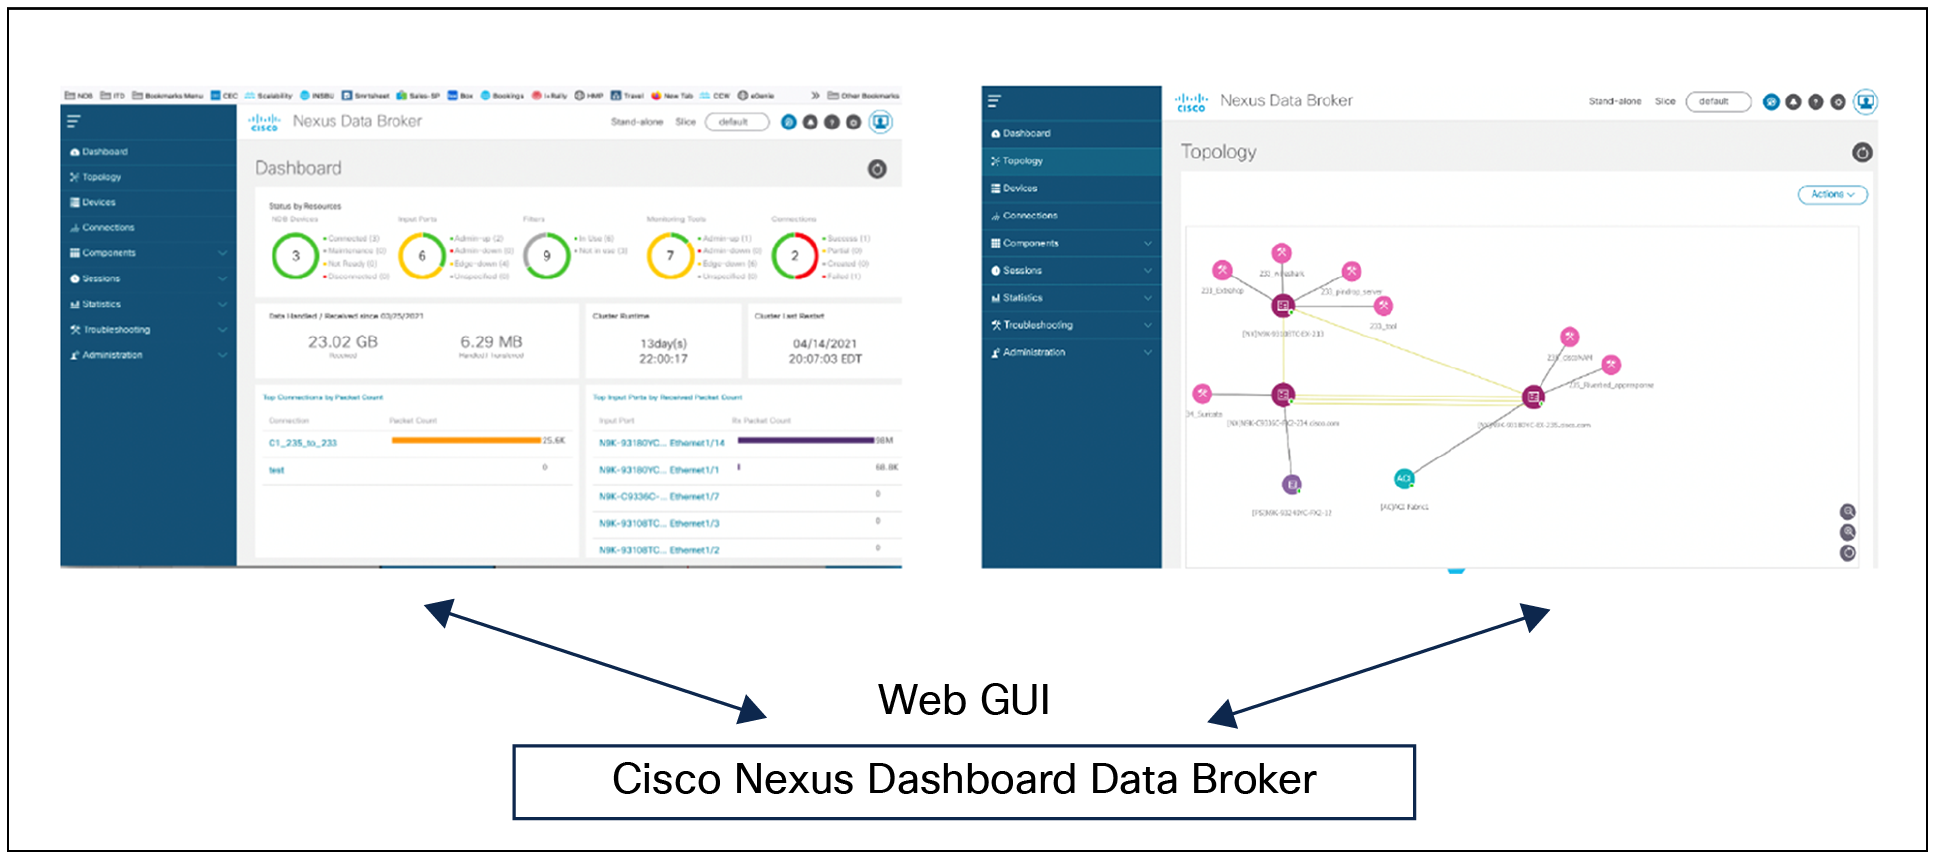
The controller exposes REST API for northbound integrations through the web GUI, which can be used to automate the controller functionality.
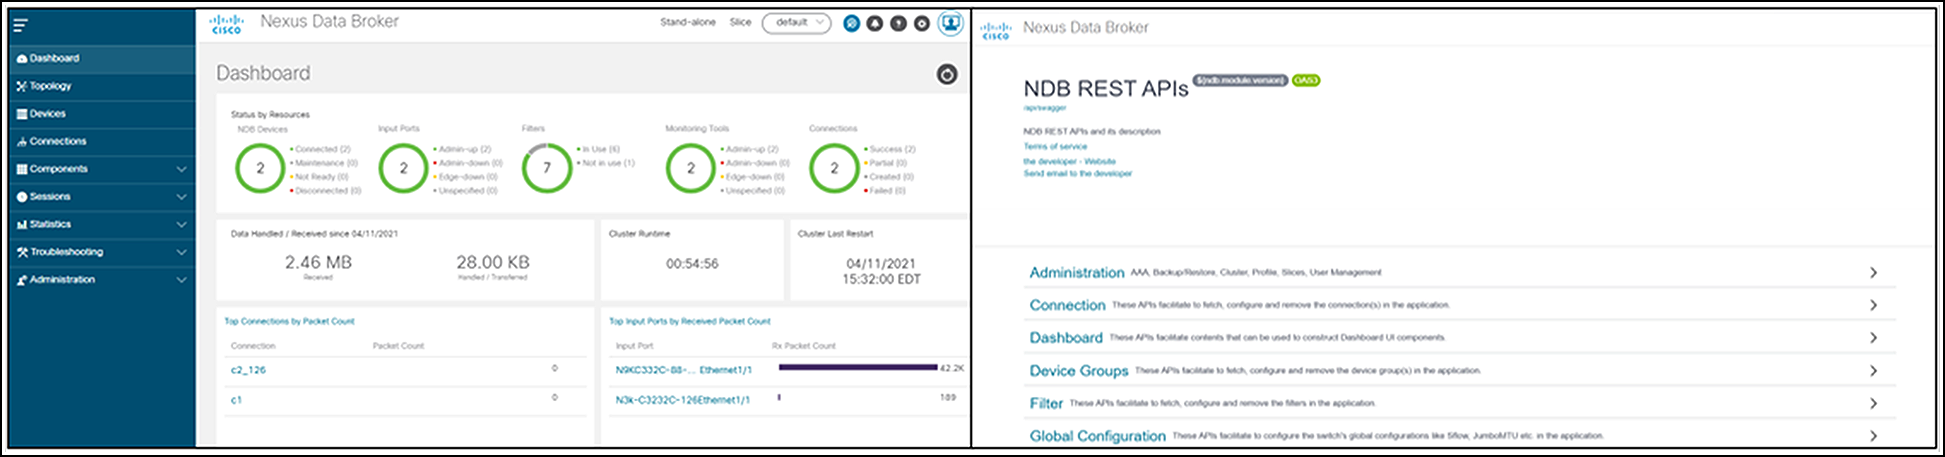
Nexus Dashboard Data Broker (NDDB) web-based GUI and northbound REST APIs
Main Features of TAP and SPAN Aggregation
Table 1 summarizes the main features and benefits of Cisco Nexus Dashboard Data Broker.
Table 1. Main features and benefits of TAP and SPAN aggregation
| Feature |
Benefit |
| Support for wide range of port density and bandwidth |
● Nexus Dashboard Data Broker supports 1, 10, 25/40, 100, and 400 Gbps ports.
● Nexus Dashboard Data Broker supports fixed switch platforms (Cisco Nexus 3000, 9300 series) as well as high-density modular switch platforms (Cisco Nexus 9500 series).
|
| Supports multiswitch packet broker topologies |
● Nexus Dashboard Data Broker software supports various topologies such as leaf-span, CLOS, fully meshed, etc.
● Nexus Dashboard Data Broker software discovers the Cisco Nexus switches and associated topology for TAP and SPAN aggregation.
● Configure ports as monitoring tool ports or as input TAP and SPAN ports
● Set end-device names for easy identification in the topology
|
| IEEE 802.1 Q-in-Q tag insertion |
● Tag traffic with a unique VLAN ID for each TAP or SPAN input port
● Q-in-Q in edge TAP and SPAN ports can uniquely identify the source of traffic and preserve production VLAN information.
|
| Symmetric and asymmetric load balancing* |
● Configure hashing based on Layer 3 (IP address) or Layer 3 plus Layer 4 (protocol ports) to load balance the traffic across a port-channel link
● Spread the traffic across multiple tool instances to accommodate high-traffic-volume scale while still maintaining flow symmetry
|
| Traffic Filtering |
● You can match traffic based on Layer 1 through Layer 4 criteria for both IPv4 and IPv6.
● With advance filtering support, now you can match on TCP/IP flags in addition to other standard Layer-2 and Layer-3 parameters
● You can configure the software to send only the required traffic to the monitoring tools without flooding the tools with unnecessary traffic.
● Egress QoS plicy can be configured to rate limit the filtered traffic being redirected to the monitoring/service tools
|
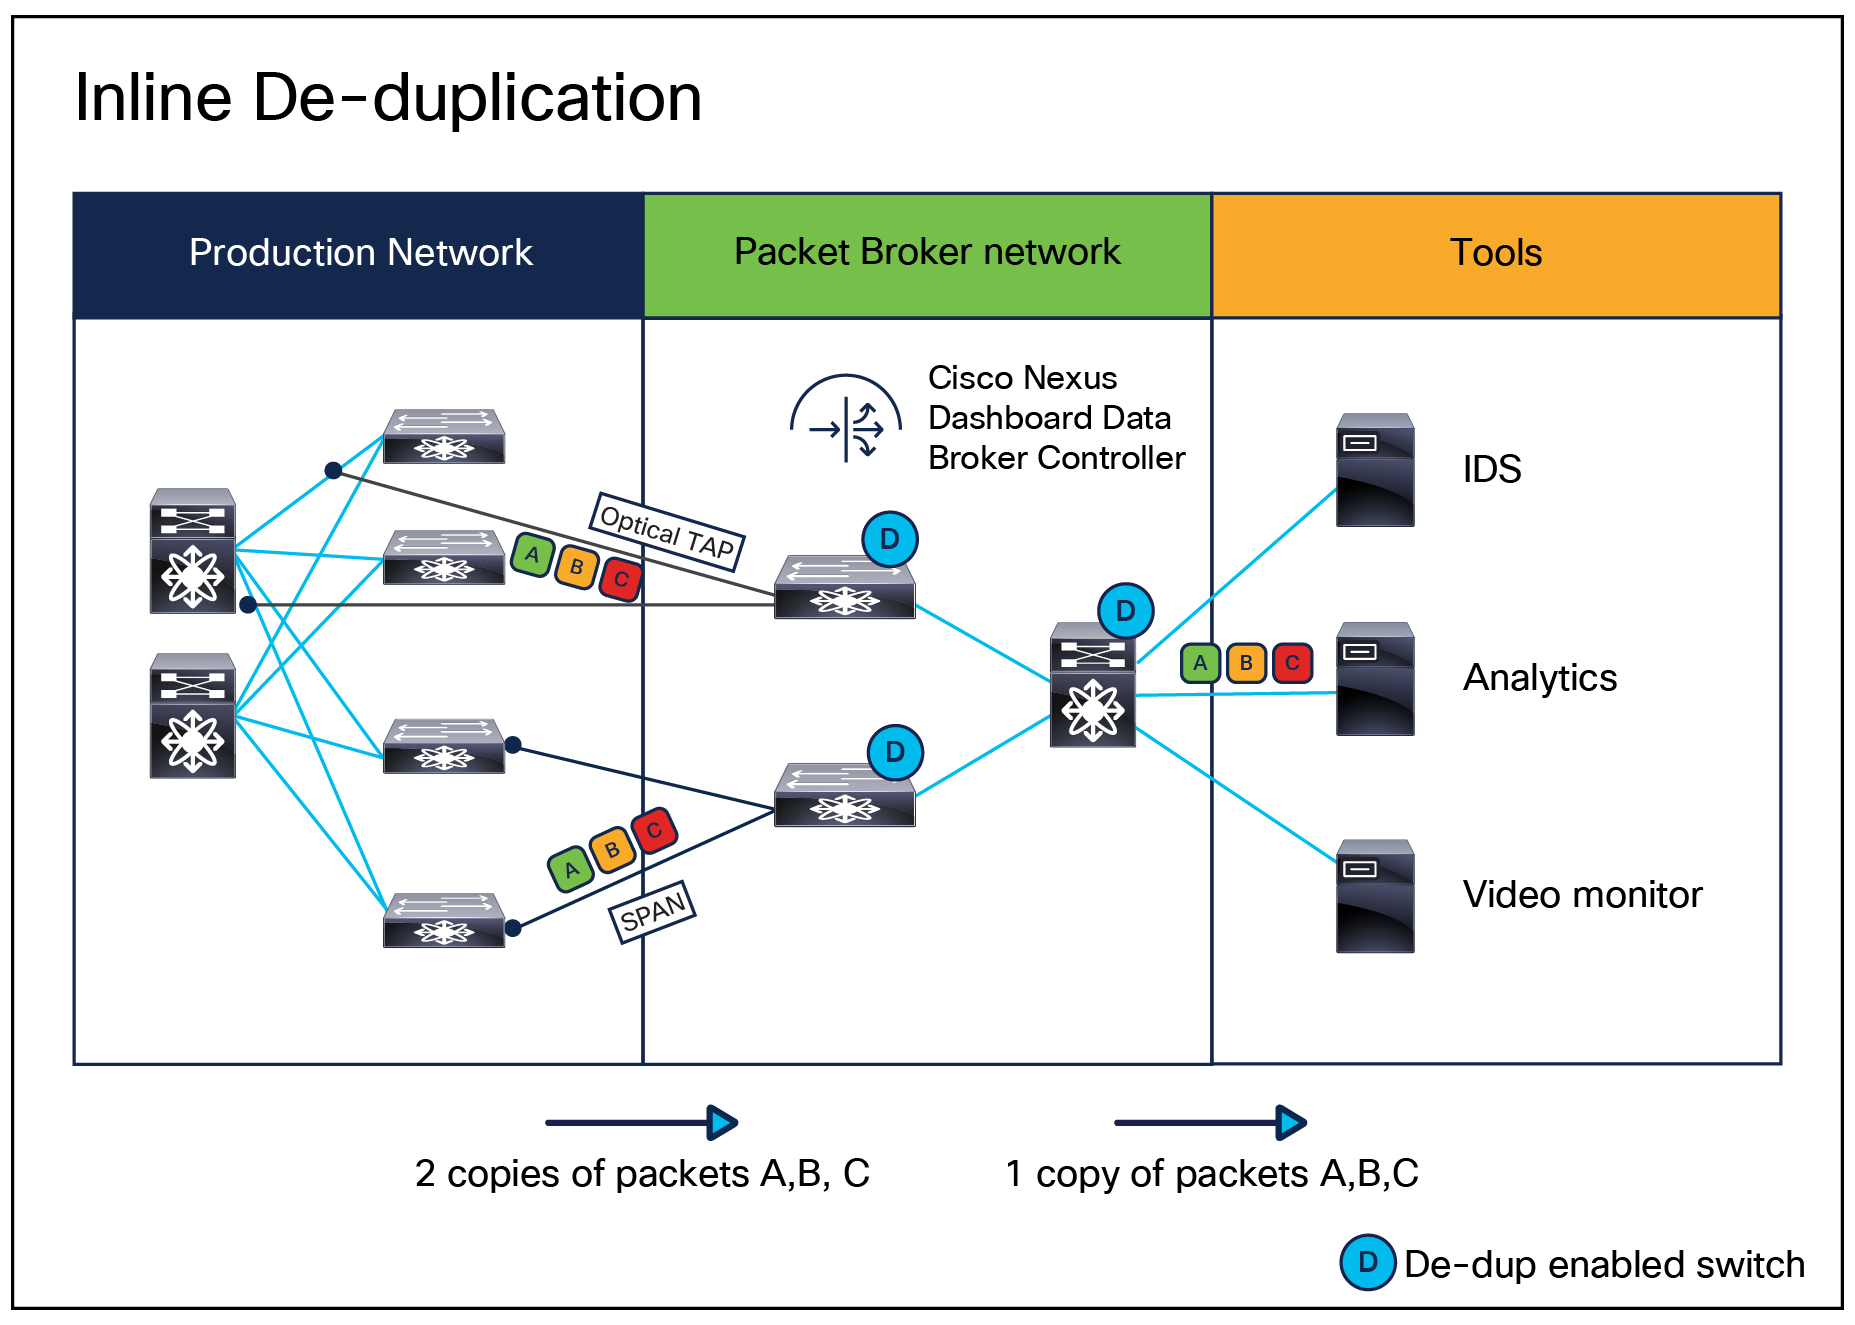
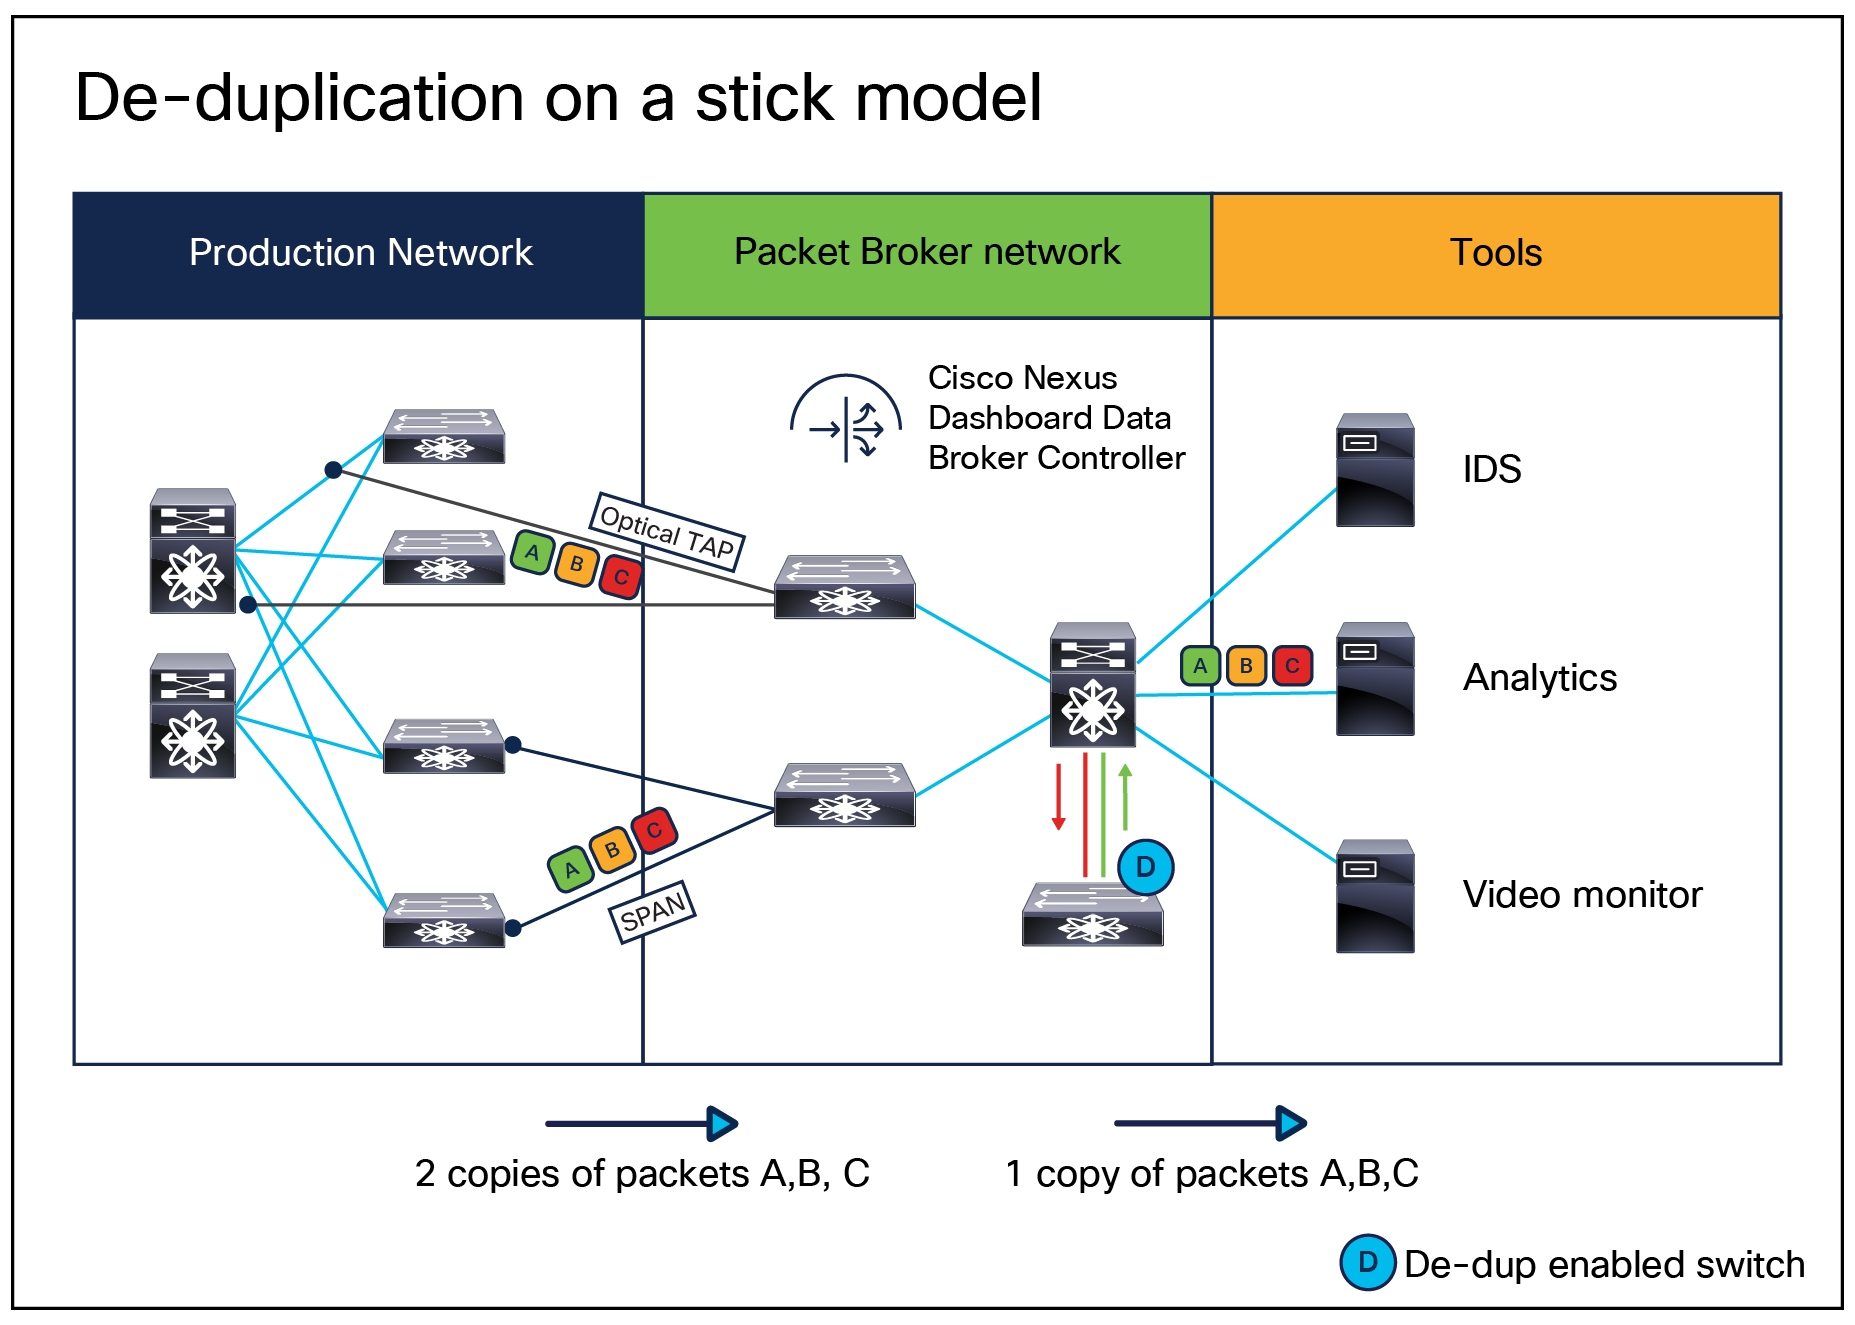
| Packet Deduplication |
● Remove duplicate packets from the copy traffic at a flow level, using the same Nexus Dashboard Data Broker switches (Nexus 9300) Deduplication or Dedup can be deployed in 2 modes:
● Inline Deduplication – where every NDDB switch (Nexus 9300, FX2, GX, GX2A & GX2B), can also be used as a Dedup switch
● Deduplication on a stick – where all aggregated copy traffic is directed to a dedicated NDDB Dedup switch (Nexus 9300, FX2, GX, GX2A, GX2B) that performs the Dedup functionality
|
| User-defined filtering |
● For IPv4 packets, you can match for a pattern by specifying an offset within the first 128 bytes of the packet.
● Match VXLAN, GTP-C, and GTP-U packets (VXLAN identification can be done using a Virtual Network Identifier (VNI).)
|
| Packet header/label stripping |
● Enable Multiprotocol Label Switching (MPLS) label stripping
● Native support for VXLAN header stripping from copy traffic
● Support for Generic Route Encapsulation (GRE) and ERSPAN header stripping
*
● Q-in-Q VLAN header stripping at egress
|
| Traffic replication and forwarding |
● Copy traffic from several TAP and SPAN ports and aggregate it across multiple Data Broker switches
● Configure the Data Broker switches through the controller to replicate and forward traffic to a single or multiple monitoring tools. Supports any-to-many forwarding of interested traffic to the monitoring tools.
|
| Timestamping |
● Timestamp a packet at ingress using the Precision Time Protocol (PTP; IEEE 1588), providing nanosecond accuracy.
|
| Packet truncation (packet slicing) |
● Truncate a packet based on a specified number of bytes. The minimum packet size is 64 bytes.
● Retain only the header by truncating payload for analysis and troubleshooting
● Discard the payload for security and/or compliance reasons
|
| sFlow and NetFlow generation |
● Utilize flow-based analysis techniques to visualize traffic patterns throughout the entire network
● If the production switches are not capable of generating NetFlow records, Data Broker can augment this functionality by generating NetFlow and sFlow records on the SPAN/TAP traffic.
● Egress Netflow generation is supported
|
| Response to changes in the TAP and SPAN aggregation network state |
● Data Broker is aware of the aggregation switch topology and capable of providing a backup path in case of a node or link failure
● Monitor and keep track of network connectivity changes
● Respond to link or node failures by automatically reprogramming the flows through an alternate path
|
| Automatic copy function for out-of-band traffic monitoring |
● Copy traffic for out-of-band traffic monitoring
● Traffic can be copied from the ingress or egress port or both.
|
| End-to-end path visibility |
● For each traffic-forwarding rule, the solution provides complete end-to-end path visibility all the way from the source ports to the monitoring tools, including the path through the network.
|
| Centralized support for multiple Data Broker networks |
● Centralized management and support for multi-site deployments
● Manage multiple independent TAP and SPAN aggregation networks using the same Data Broker instance by configuring slices
|
| IPv6 support for management |
● Communication between Nexus Dashboard Data Broker software and switches is supported over IPv6 management interfaces.
● IPv6 support for high availability and clustering
|
| Automation of SPAN configuration in production network |
● Automate SPAN destination and SPAN configuration using the data broker controller
◦ On the Cisco Nexus switches, in a Cisco NX-OS standalone fabric |
| Cisco ACI integration |
● Automate SPAN destination and SPAN configuration (access / fabric / EPG SPAN) using the data broker controller
◦ On the leaf switches of an ACI fabric |
| Cisco Enterprise Network integration |
● Automate SPAN destination and SPAN configuration using the data broker controller
◦ On individual Cisco Catalyst® switches or on the Catalyst switches through Cisco DNA Center |
| TAP device management |
● Onboard and manage Cisco Nexus 3550-F Fusion Layer 1 platform as a TAP device
|
| Export Nexus Dashboard Data Broker configuration |
● Easy export of Nexus Dashboard Data Broker configuration to replicate the installation in other instances
|
| Role-Based Access Control (RBAC) |
● Integration with external AAA servers using LDAP, TACACS, or RADIUS protocols for user authentication and authorization
|
| Open controller |
● With the availability of northbound APIs from the GUI, Cisco Nexus Dashboard Data Broker controller is highly programmable.
|
| High Availability (HA) |
● Cisco Nexus Dashboard Data Broker controller can be configured to be highly available using active/active clustering.
|
| Remote sources/tools |
● Support for remote sources and remote tools
● Terminate ERSPAN tunnel to copy traffic from a remote source
● Encapsulate the packets using ERSPAN and redirect traffic to remote tools
|
| Vendor neutral |
● Data Broker is source agnostic, tool agnostic, and topology agnostic
● Copy traffic from different vendor devices
● Send traffic to different vendor tools
|
Starting from Cisco NX-OS Release 10.4(1)F, deduplication feature can be used to remove duplicate copies from the copy traffic that is received by the Nexus Data Broker (NDB) switches.
Deduplication supports two model types:
● Inline deduplication Model (Interface Mode).
● Deduplication on a Stick Model (VLAN Mode).
With these features, the Cisco approach provides a compelling solution, saving both Capital Expenditures (CapEx) and Operating Expenses (OpEx) when compared to the traditional matrix network approach. The Cisco approach also helps ensure short response times and full coverage as monitoring needs grow.
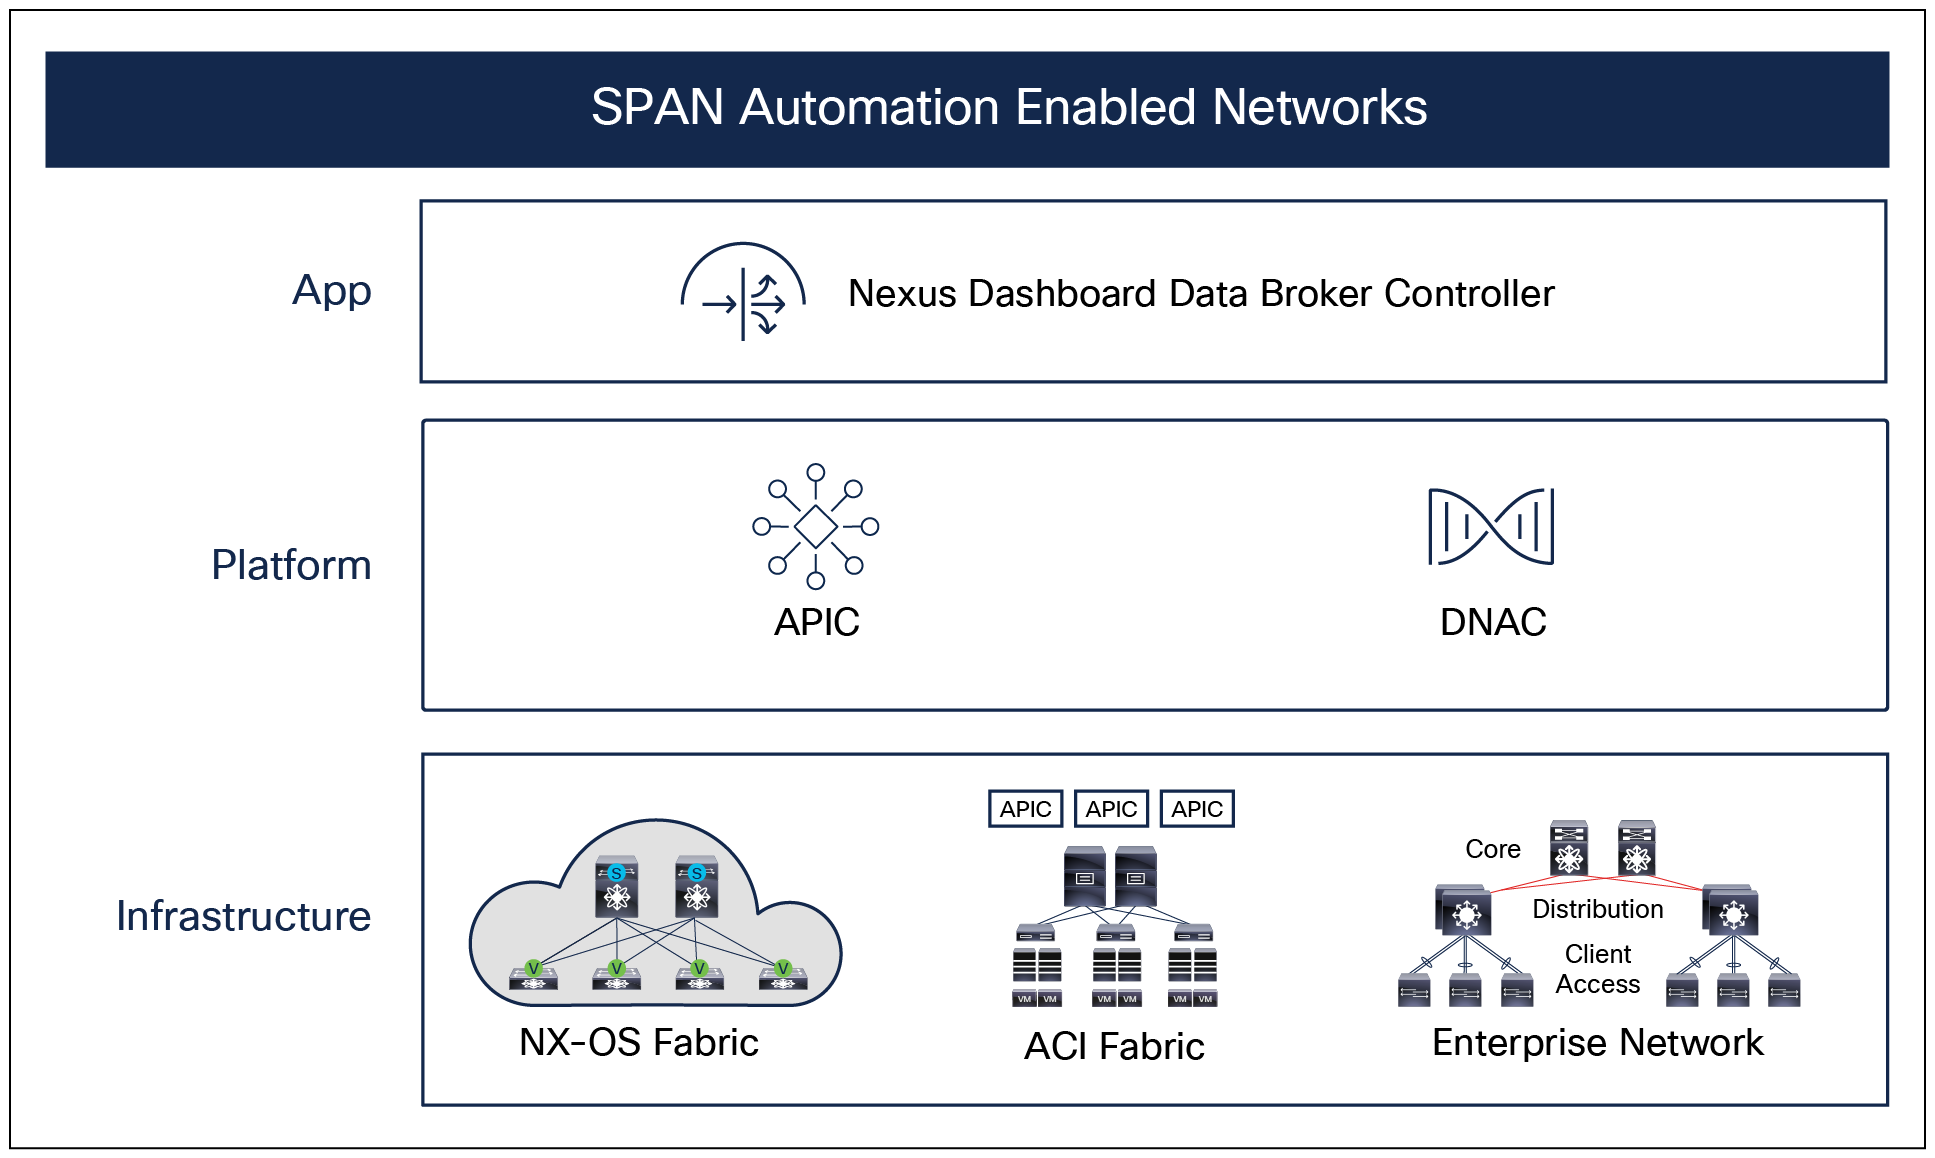
Automated SPAN Configuration in Production Network
NetOps/SecOps teams can onboard production switches in Cisco Nexus Dashboard Data Broker and automate SPAN destination and monitoring session configurations on them. This allows administrators to manage and monitor copy traffic from source to destination from a single pane of glass. The following can be automated from the controller:
● Configure interfaces on the production switch connected to a Data Broker switch as a SPAN destination.
● Configure SPAN sessions on the production switch using one or more source ports or VLANs.
● Redirect SPAN traffic to monitoring tools connected to the Data Broker switches.
The production network can be:
● Cisco NX-OS standalone fabric.
● Cisco ACI fabric.
● Cisco Enterprise Network.
Cisco NX-API needs to be enabled on the TAP aggregation switches as a prerequisite for the controller to automate SPAN configuration.
Nexus Dashboard Data Broker controller architecture
Cisco Application Centric Infrastructure (ACI) integration
Cisco Nexus Dashboard Data Broker integrates with Cisco Application Centric Infrastructure (Cisco ACI) fabric through the Cisco Application Policy Infrastructure Controller (APIC) to push SPAN configuration on Cisco ACI leaf switches and set up SPAN sessions in Cisco ACI to monitor traffic. You can perform all these configurations through Nexus Dashboard Data Broker’s web-based GUI (Figure 7). This integration eliminates the need for the user to separately configure SPAN sessions or copy the function in the APIC. Data Broker supports the following functions through the web GUI and REST API to:
● Set up Cisco ACI leaf ports as SPAN sources and destinations for Access span.
● Set up Cisco ACI EPG span by configuring Cisco Nexus Data Broker switch ports as ERSPAN tunnel destinations.
● Configure SPAN sessions on Cisco ACI using leaf ports or Endpoint Groups (EPGs) as SPAN sources without logging into the APIC.
● Automatically synchronize SPAN session information periodically with the APIC.
● Update SPAN sessions automatically based on EPG port association changes. With this feature, the motion of the end point VMs on the hypervisors can be tracked for visibility.
● Redirect SPAN traffic to monitoring tools connected to the data broker on Cisco Nexus switches.
The Cisco Nexus Dashboard Data Broker performs all these configurations through the APIC REST interface.
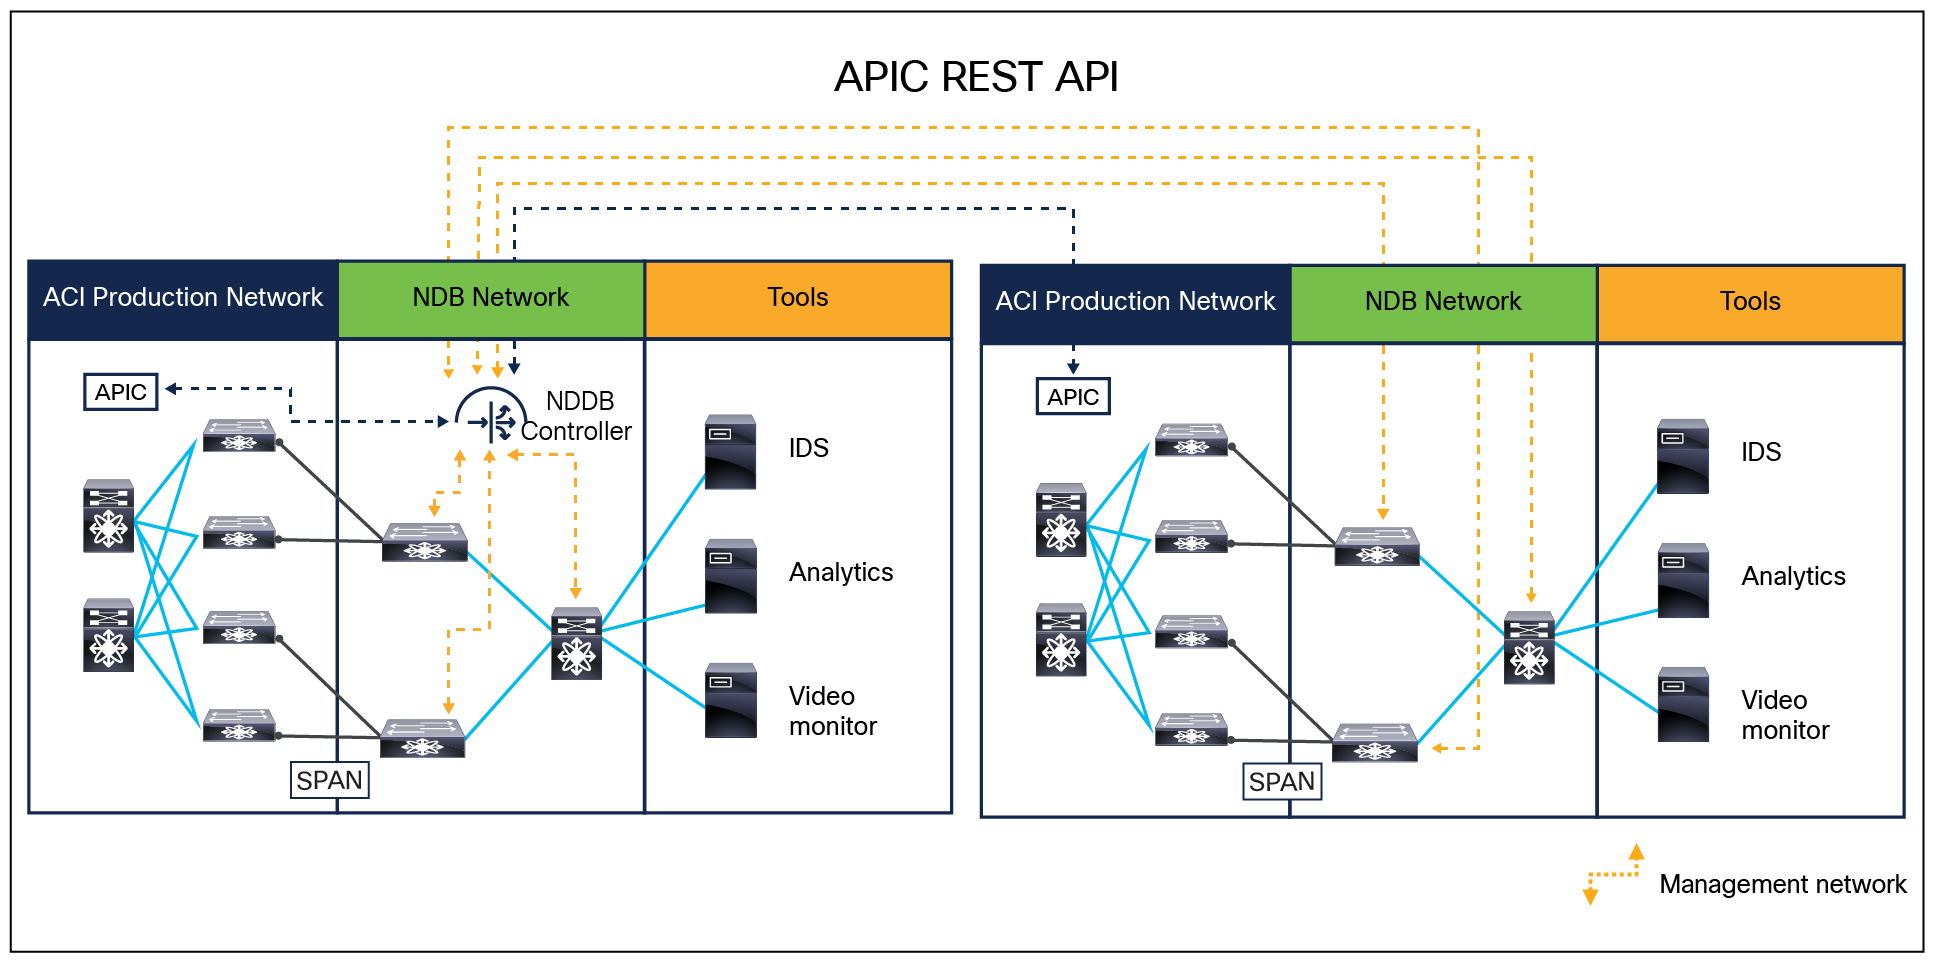
Cisco Nexus Dashboard Data Broker with Cisco ACI
Nexus Dashboard Data Broker Controller can push SPAN configuration onto the access switches in an enterprise network deployment, including campus and branch locations through DNAC. In the absence of DNAC, the Nexus Dashboard Data Broker (NDDB) controller can push SPAN configuration onto the selected switches in the enterprise network by individually onboarding the switches. Test Access Point (TAP) or Switched Port Analyzer (SPAN) can be used to copy traffic from a Cisco Catalyst switch to a Nexus Dashboard Data Broker switch (Figure 8).
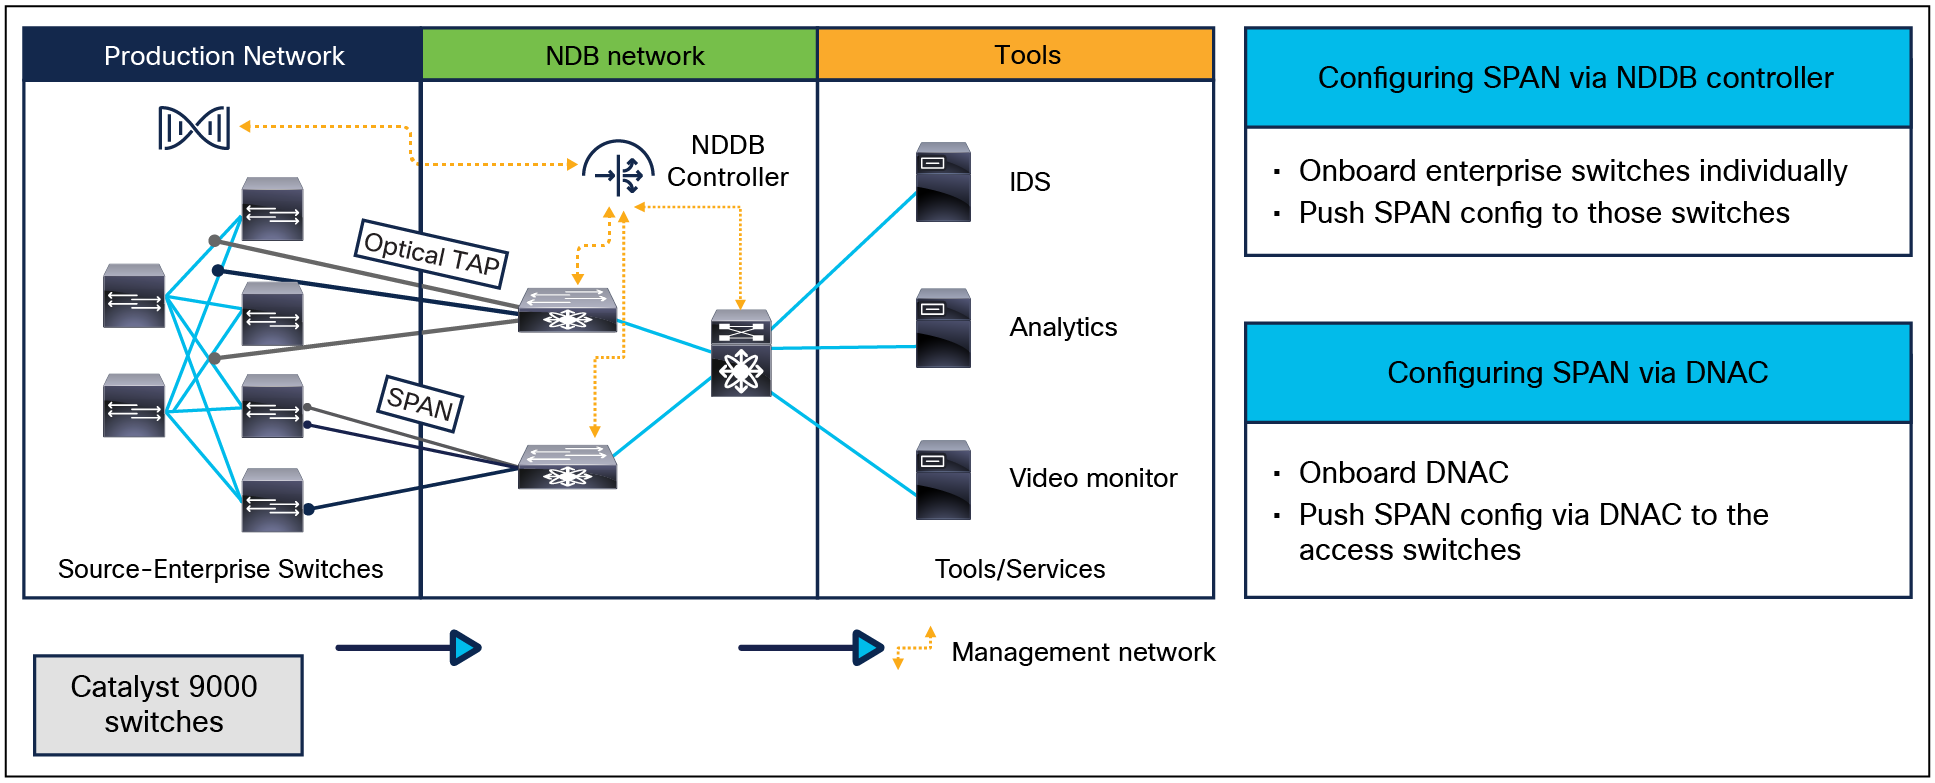
Enterprise Network SPAN Automation
Scalable traffic monitoring with Cisco Nexus Dashboard Data Broker inline option
Today, with ever-increasing volumes of traffic traversing the WAN and Internet, 10/25G bandwidth interfaces are no longer sufficient. Organizations are migrating their aggregation and core infrastructure to 40/100Gbps and higher. In addition, today’s security needs demand pervasive monitoring and hence the use of multiple proactive inline security tools, such as Intrusion Prevention Systems (IPS), Intrusion Detection Systems (IDS), and other web filtering tools, at the perimeter of the network for strong and layered security. Because of the high volume of traffic, these security tools/service nodes themselves can become bottlenecks and single points of failure. To address these concerns, customers need a solution that can adapt to increasing traffic volumes, provide flexible connections for both production infrastructure and inline tools, and provide cost-effective deployment options.
The Cisco Nexus Dashboard Data Broker Inline option allows you to insert one or more Cisco Nexus 3000 Series or 9300 platform switches in your production infrastructure to which these security tools (or service nodes) are connected (Figure 9). Using the Data Broker software, you can configure redirection policies that can match specific traffic and redirect it through multiple security tools before the traffic enters or exits your data center. Cisco’s Data Broker solution also automatically adapts to failure scenarios by bypassing the service nodes. It also provides the option to completely bypass all security tools for any emergency troubleshooting.
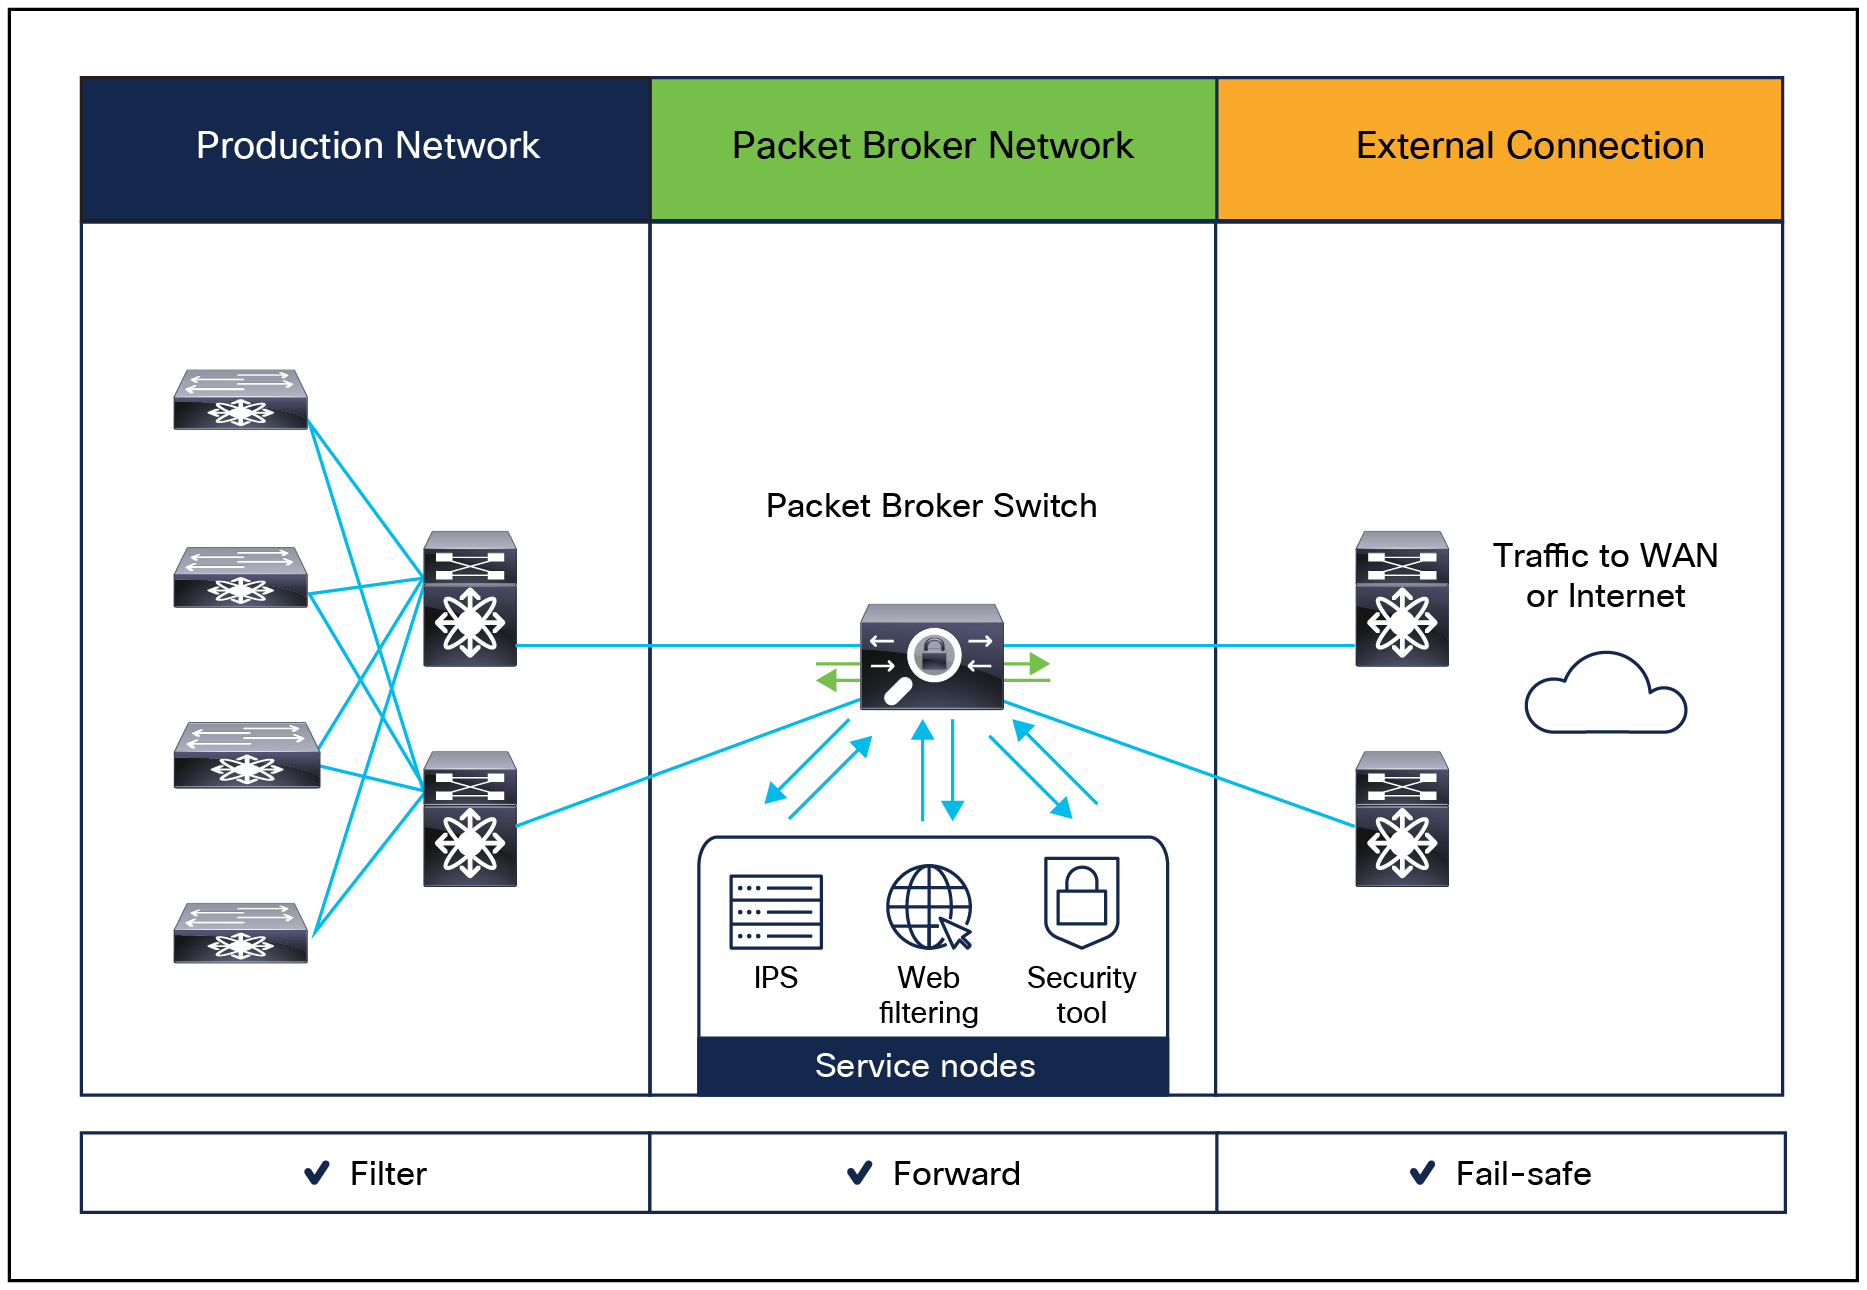
In-band or inline monitoring
Main features of inline monitoring
Table 2 lists the main features and benefits of the Cisco Nexus Dashboard Data Broker inline traffic monitoring option.
Table 2. Main features and benefits of inline monitoring
| Feature |
Benefit |
| Support for wide range of port densities and capacities |
● The Cisco Nexus Dashboard Data Broker inline option supports 1-, 10-, 25-, 40-, and 100
-Gbps connections to the production network switches and routers.
|
| Flexible port-definition option |
● Any port can be used as a production connection port or as a security tool (service node) port.
● Multiple production ingress and egress connections are supported on the same switch.
|
| Symmetric hashing or symmetric load balancing |
● Configure hashing based on Layer 3 (IP address) or Layer 3 plus Layer 4 (protocol ports) to load balance the traffic across multiple security tool instances to accommodate high traffic volumes
|
| Support for multiple service nodes |
● Match production traffic based on Layer 1 through Layer 4 criteria
● Create a redirection policy to direct the traffic through multiple security tools
|
| Implicit tagging to distinguish traffic from different ingress ports |
● To identify traffic uniquely across each ingress and egress port, traffic is implicitly tagged with a VLAN ID.
● The VLAN ID is stripped implicitly before the traffic is sent through an egress port.
|
| Service-node health check |
● By sending heartbeat messages to the service nodes, the data broker can determine a node’s functional state.
● Automatically bypass the service node if heartbeat packets are not received
|
| Automatic service-node removal |
● If a port connected to a service node fails, that service node is automatically removed from the path.
|
| Default fail-safe option |
● The data broker automatically configures the fail-safe option to send the traffic directly from an ingress port to an egress port.
|
Cisco Nexus Dashboard Data Broker access mechanisms
You can access the Cisco Nexus Dashboard Data Broker application through the web-based GUI or REST API. Figures 10 and 11 show the GUI and REST API access mechanisms, respectively, to connect to Data Broker.
Cisco Nexus Dashboard Data Broker Application GUI access mechanism
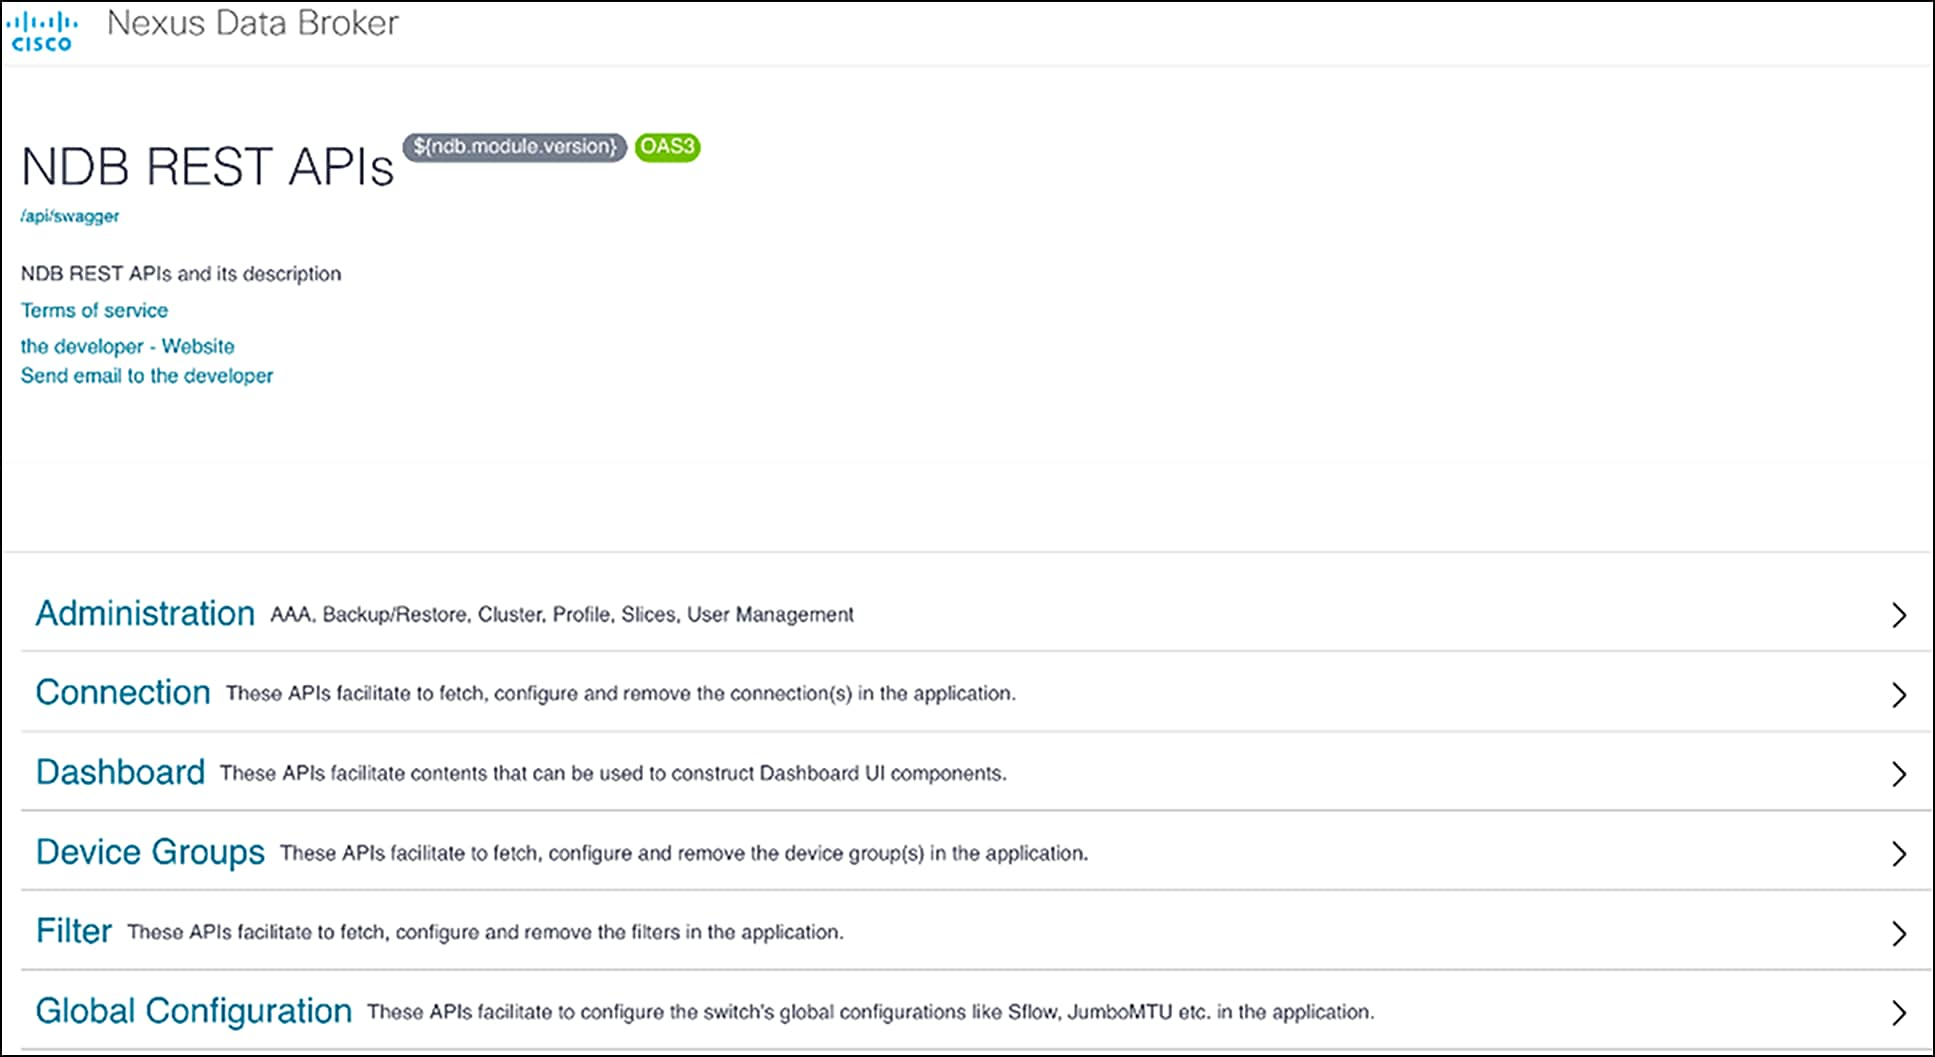
Cisco Nexus Dashboard Data Broker application REST API access mechanism
Cisco Nexus Dashboard Data Broker Embedded Deployment Mode
If you want to deploy Cisco Nexus Dashboard Data Broker using a single Cisco Nexus 3000 or 9000 series switch in your topology, install the data broker software on the switch using the guest shell available with Cisco NX-OS on the switch. Cisco Nexus Dashboard Data Broker Embedded software is provided as a binary that you can deploy in the guest shell of the Cisco Nexus switch. After you download the binary to the switch, you must activate it, and by default the data broker uses the IP address of the management interface of the Cisco Nexus switch to access the controller.
Note: The features of the data broker application, listed below, will NOT be available with the embedded option:
● Clustering and high availability
● Management for multiple switches in the network topology
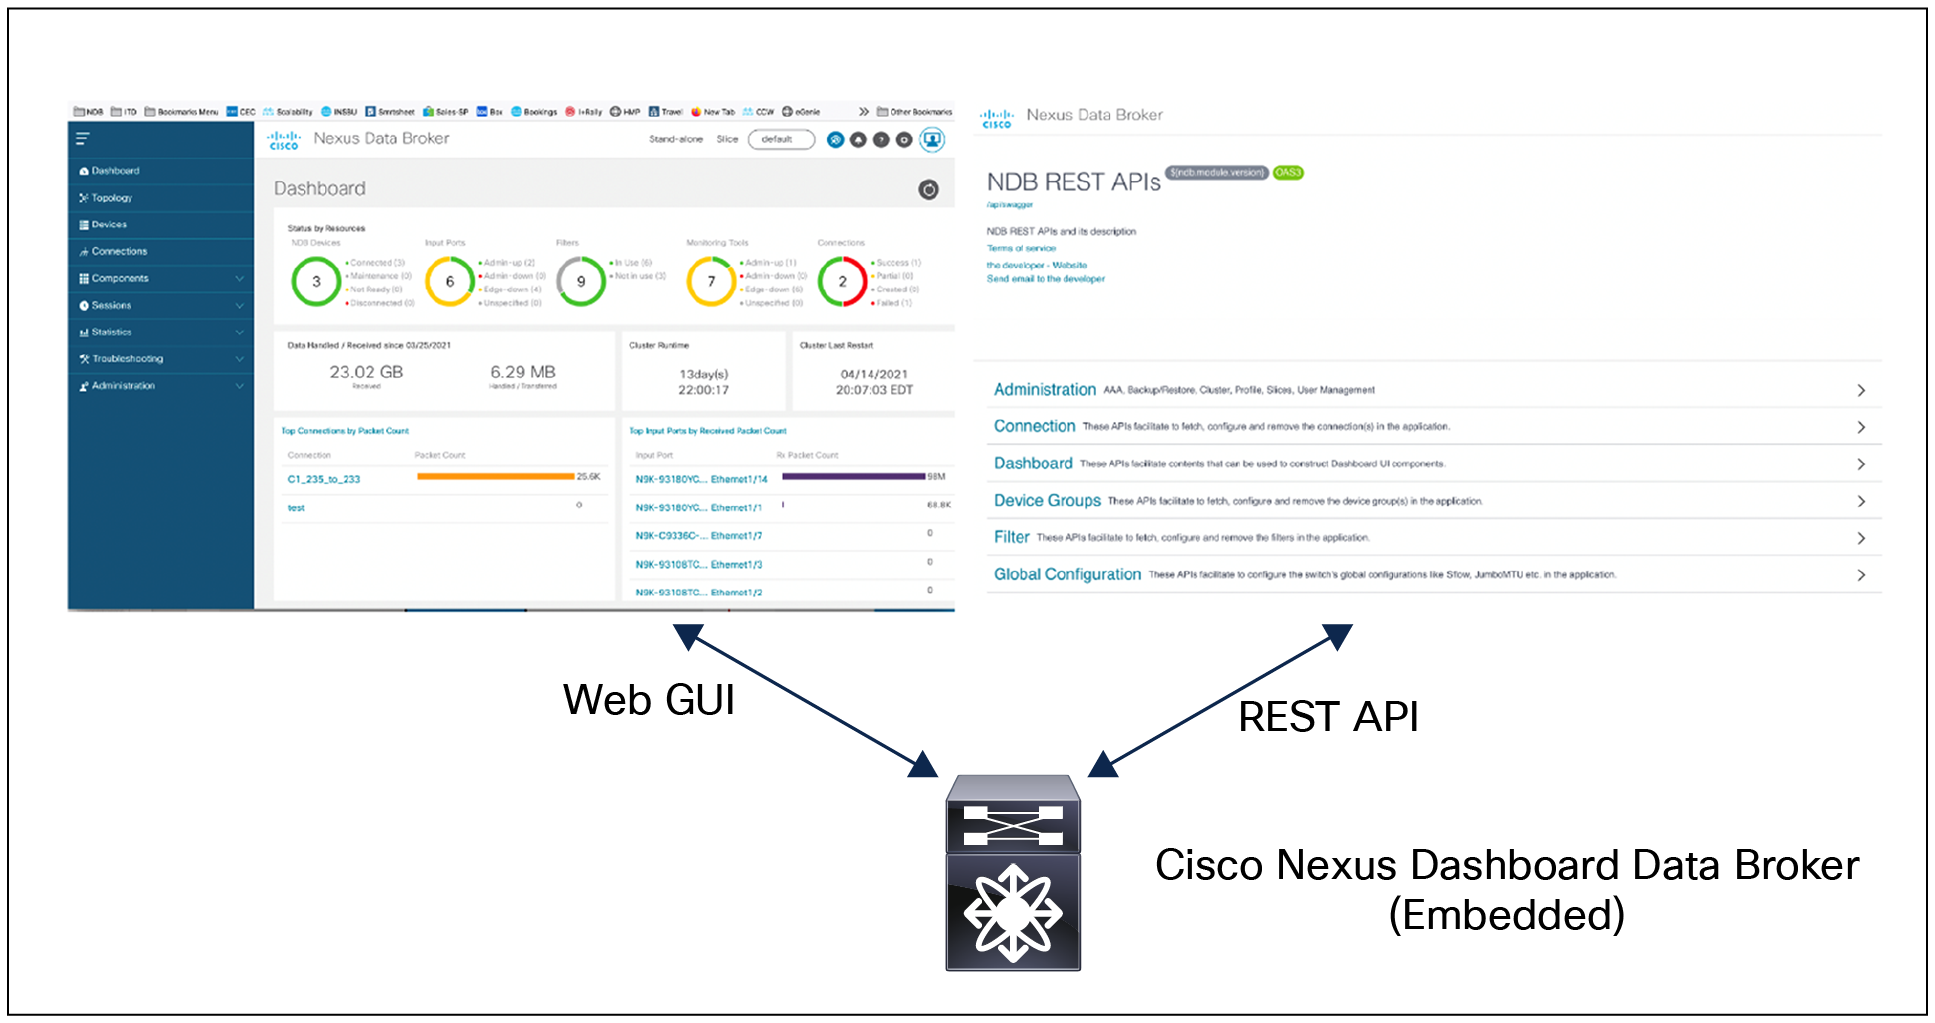
Cisco Nexus Dashboard Data Broker embedded
Cisco Nexus Dashboard Data Broker Support of TAP device
Cisco Nexus Dashboard Data Broker now supports Cisco Nexus 3550-F Fusion Layer 1 platform as a TAP device (Figure 13). With this, TAP functionality can be provided by the Nexus 3550-F Fusion switch with complete automation of TAP configuration from the Nexus Dashboard Data Broker controller GUI. The following are the two functionalities provided by the data broker:
● Onboard Nexus 3550-F as TAP switch
● Push TAP configurations to Nexus 3550-F
Provisioning Cisco Nexus 3550-F as a TAP device
Device support matrix for Cisco Nexus Dashboard Data Broker
Table 3 lists the supported Cisco Nexus Dashboard Data Broker software for the various Cisco Nexus switches.
Table 3. Cisco Nexus Dashboard Data Broker application device support matrix
| Device model |
Supported versions |
Deployment mode |
Use cases |
| Cisco Nexus 3000 series |
Cisco Nexus Dashboard Data Broker 3.8 or later |
Centralized and Embedded |
TAP and SPAN aggregation and inline redirection |
| Cisco Nexus 3100 series |
Cisco Nexus Dashboard Data Broker 3.8 or later |
Centralized and Embedded |
TAP and SPAN aggregation and inline redirection |
| Cisco Nexus 3164Q |
Cisco Nexus Dashboard Data Broker 3.8 and later |
Centralized and Embedded |
TAP and SPAN aggregation only |
| Cisco Nexus 31108 series |
Cisco Nexus Data Broker 3.8 or later |
Centralized and Embedded |
TAP and SPAN aggregation and in-line redirection |
| Cisco Nexus 3200 series |
Cisco Nexus Dashboard Data Broker 3.8 |
Centralized and Embedded |
TAP and SPAN aggregation and inline redirection |
| Cisco Nexus 3500 series |
Cisco Nexus Dashboard Data Broker 3.8 and later |
Centralized and Embedded |
TAP and SPAN aggregation only |
| Cisco Nexus 9200 series |
Cisco Nexus Dashboard Data Broker 3.8 or later |
Centralized and Embedded |
TAP and SPAN aggregation only |
| Cisco Nexus 9300 series |
Cisco Nexus Dashboard Data Broker 3.5 and later |
Centralized and Embedded |
TAP and SPAN aggregation and inline monitoring |
| Cisco Nexus 9300-EX series |
Cisco Nexus Dashboard Data Broker 3.5 or later |
Centralized and Embedded |
TAP and SPAN aggregation only |
| Cisco Nexus 9300-FX series |
Cisco Nexus Dashboard Data Broker 3.5 or later |
Centralized and Embedded |
TAP and SPAN aggregation only |
| Cisco Nexus 9300-FX2 series |
Cisco Nexus Dashboard Data Broker 3.7 or later |
Centralized and Embedded |
TAP and SPAN aggregation only |
| Cisco Nexus 9300-FX3 series |
Cisco Nexus Dashboard Data Broker 3.9 or later |
Centralized and Embedded |
TAP and SPAN aggregation only |
| Cisco Nexus 9300-GX series switch |
Cisco Nexus Dashboard Data Broker 3.10 or later |
Centralized and Embedded |
TAP and SPAN aggregation only |
| Cisco Nexus 9332C series switch |
Cisco Nexus Dashboard Data Broker 3.8 or later |
Centralized and Embedded |
TAP and SPAN aggregation only |
| Cisco Nexus 9364C series switch |
Cisco Nexus Dashboard Data Broker 3.8 or later |
Centralized and Embedded |
TAP and SPAN aggregation only |
| Cisco Nexus 9500 platform |
Cisco Nexus Dashboard Data Broker 3.8 and later |
Centralized and Embedded |
TAP and SPAN aggregation only |
| Cisco Nexus 9500-EX series |
Cisco Nexus Dashboard Data Broker 3.8 or later |
Centralized and Embedded |
TAP and SPAN aggregation only |
| Cisco Nexus 9500-FX series |
Cisco Nexus Dashboard Data Broker 3.8 or later |
Centralized and Embedded |
TAP and SPAN aggregation only |
The following Cisco Nexus 9500 chassis models are supported with Nexus Dashboard Data Broker:
● Cisco Nexus 9504
● Cisco Nexus 9508
● Cisco Nexus 9516
The following line cards are supported with Nexus Dashboard Data Broker for Cisco Nexus 9500 series chassis:
● N9K-X97160YC-EX
● N9K-X9732C-EX
● N9K-X9732C-FX
● N9K-X9736C-EX
● N9K-X9736C-FX
● N9K-X9788TC-FX
Licensing and ordering information
You can refer Cisco Nexus Data Broker Ordering Guide.
Flexible payment solutions to help you achieve your objectives
Cisco Capital® makes it easier to get the right technology to achieve your objectives, enable business transformation and help you stay competitive. We can help you reduce the total cost of ownership, conserve capital, and accelerate growth. In more than 100 countries, our flexible payment solutions can help you acquire hardware, software, services and complementary third-party equipment in easy, predictable payments. Learn more.
For more information about Cisco Nexus Dashboard Data Broker, please visit https://www.cisco.com/go/nexusdatabroker or contact your local Cisco account representative.
| New or revised topic |
Described in |
Date |
|
|
|
|
|
|
|
|
|
|
|
|